


Introduction
Marginal fluctuations are one of the ways glaciers adapt to climatic changes (Reference OerlemansOerlemans, 1994, Reference Oerlemans2005; Reference Arendt, Echelmeyer, Harrison, Lingle and ValentineArendt and others, 2002). Data on global trends in glacier terminus changes compiled by the World Glacier Monitoring Service (WGMS, http://www.wgms.ch) suggest that an overall glacier recession occurred throughout the 20th century, although periods of local readvance have been noted. In Greenland, widespread recession of the Greenland ice-sheet margin prevailed from the last cooling during the Little Ice Age (LIA) around 1880 to about 1950 (Reference WeidickWeidick, 1968, Reference Weidick1985), followed by a period of general stillstand or readvance around 1985 (Reference WeidickWeidick, 1991). In recent years, many tidewater glaciers emanating from the Greenland ice sheet have undergone a drastically accelerated recession (e.g. Reference JoughinJoughin, 2006).
On Disko Island (Qeqertarsuaq), central West Greenland, about 1000 glaciers, ice caps and firn fields exist, covering an area of about 1610 km2 (Reference HumlumHumlum, 1988; Reference Weidick, Böggild and KnudsenWeidick and others, 1992). At present, all of these terminate on land. Reference SteenstrupSteenstrup (1901) initiated systematic observations of changes in glacier length on Disko Island. He compared photographs of glaciers taken in 1880 and 1898, and conducted field measurements of glacier front positions for future comparisons. In 1913, Reference JostJost (1940) visited the central valleys on the island and argued that the glaciers were receding. He also compared his observations in 1913 with a map surveyed in 1931–33 and concluded that recession had continued. Since then, aerial and satellite remote sensing has become the standard technique for monitoring glacier extension over large remote areas. Reference WeidickWeidick (1968) and Reference HumlumHumlum (1987) used aerial photographs to conclude that glaciers on Disko Island have been receding since the beginning of the 20th century. Disagreement exists, as Reference WeidickWeidick (1968) suggests that maximum recession rates occurred between 1920 and 1940, whereas Reference HumlumHumlum (1987) interprets lichenometric observations to indicate that a short period of readvance occurred around 1930–35. However, a complete and up-to-date assessment of changes in glacier extent during the 20th century is lacking.
Disko Island belongs to the Disko–Nuussuaq surge cluster, one of two recognized surge clusters in Greenland, both primarily situated on Tertiary basalts. Glacier fluctuations as a result of glacier surges are superimposed upon the climatic signal, and the extent and duration of the surge cycle are important parameters, when the role of glacier surging has to be assessed in relation to rapid advance and subsequent recession during the quiescent phase over decadal and centennial timescales. The Disko–Nuussuaq surge cluster is characterized by some of the longest frontal advances ever recorded, such as the 10.5 km advance of Kuannersuit Glacier (inventory code: 1HB15017) in 1995– 98, which advanced with a maximum velocity of at least 50md–1 (Reference Gilbert, Nielsen, Möller, Desloges and RaschGilbert and others, 2002; Reference Yde and KnudsenYde and Knudsen, 2005). The general duration of the quiescent phase is presumably considerably longer than 100 years (Reference Yde and KnudsenYde and Knudsen, 2005). On Disko Island, past surge events are geomorphologically evident by large areas of dead ice in many major valleys, and many glaciers show glaciomorphological surge-related features such as looped medial moraines and potholes.
The purpose of this paper is (1) to evaluate glacier fluctuations on Disko Island throughout the 20th century, and (2) to assess the role of glacier surging on recession rates. Special emphasis is given to the second half of the century, where aerial and satellite documentation is available. As only a few glaciers have formal names, reference to a specific glacier is given by its hydrological code in the glacier inventory of West Greenland (Reference Weidick, Böggild and KnudsenWeidick and others, 1992).
Study Area
Disko Island (70˚N, 54˚W) is situated in central West Greenland (Fig. 1) and is the largest island in Greenland, covering an area of 8575 km2, of which about 19% is glacierized (Reference HumlumHumlum, 1987). Two major ice caps, Sermer-suaq (Storbræen) and Bræpasset, cover the central part of the island. The non-glacierized landscape is characterized by Tertiary basalt plateaux (600–1200ma.s.l.) with numerous cirques and deep U-shaped valleys with talus slopes and outwash plains.
Location map of Disko Island, West Greenland.

In Greenland, the LIA comprises the period 1150–1920 (Reference HumlumHumlum, 1999). A meteorological data series has been obtained since 1873 in the town of Ilulissat (Jakobshavn), located about 50km southeast of Disko Island. A marked rise of about 4˚C in the mean annual air temperature (MAAT) occurred in the period 1921–30 (Fig. 2). The 1891–1920 MAAT was –5.9˚C, whereas the 1931–60, 1961–90 and 1991–2005 MAATs were –4.1˚C, –4.4˚C and –4.3˚C, respectively. The mean summer air temperature (MSAT; June–August) for these 30 year intervals was 5.8˚C, 6.2˚C, 6.2˚C and 6.5˚C, respectively. Interannual temperature variations are in the range 2–7˚C, with large variations between winter seasons and small variations between summer and autumn seasons (Reference HumlumHumlum, 1999).
MSAT (June–August 1873–2004) and MAAT (1873–2005) variations in Ilulissat. Data are from Reference Cappelen, Laursen, Jørgensen and Kern-HansenCappelen and others (2005) and Reference CappelenCappelen (2006).

In 1923, a meteorological station was established in the coastal village of Qeqertarsuaq (Godhavn). It showed the same trend as in Ilulissat, with a decline in temperature from the 1931–60 MAAT of –3.2˚C to the 1961–90 MAAT of –4.0˚C (Reference HumlumHumlum, 1999). The climate in Qeqertarsuaq is polar maritime, whereas the central and northeastern part of the island has a more continental climate. In 1993–94, meteorological measurements in Mellemfjord, 50km northwest of Qeqertarsuaq, showed a mean temperature of –7.8˚C in contrast to –4.9˚C in Qeqertarsuaq during the same period (Reference HumlumHumlum and others, 1995). The vertical lapse rate is 0.006–0.007˚Cm–1 (Reference HumlumHumlum, 1998). The mean annual precipitation in Qeqertarsuaq is about 400mm compared to about 200mm (1961–72) in Qullis-sat, an abandoned mining village on the northeast coast of Disko Island (Reference HumlumHumlum and others, 1995). Coastal areas have discontinuous permafrost, whereas the central part of the island has continuous permafrost indicated by periglacial landforms such as pingos. No mass-balance measurements have been conducted on the glaciers of Disko Island.
Data
According to the regional glacier inventory (Reference Weidick, Böggild and KnudsenWeidick and others, 1992), Disko Island has a total of 1070 ice caps, glaciers and firn areas, of which 350 are larger than 1 km2. In our analysis we included 247 of these 350 glaciers, as the remaining glaciers consisted of ice- and snowfields where glacier length or flow direction could not be determined. Two glaciers (1HB15013 and 1HE09089) were divided into branches, as they are not confluent. Glacier 1 HB16025 was omitted due to lack of image cover in 1953, and glacier 1HE01022 was omitted as it was closely connected to interannual variations in non-climate-related ice- and rockfalls from its headwall and the superjacent ice cap. The 247 glaciers cover a total area of 1523 km2, representing about 95% of the glacierized area on Disko Island. Rock glaciers, of which almost 1700 have been mapped on Disko Island (Reference HumlumHumlum, 1988), were not included. Data on glacier area, elevation and orientation were derived from the regional glacier inventory and refer to 1985 estimates (Reference Weidick, Böggild and KnudsenWeidick and others, 1992).
Information on 19th-century fluctuations of glacier termini has been compiled from expedition accounts, drawings, maps and photographs. Although most of this information cannot be regarded as exact, the historical sources provide a foundation for evaluating the general extent of the glaciers on Disko Island at the end of the 19th century. In 1880, Reference Hammer and SteenstrupHammer and Steenstrup (1893) conducted a mineralogical survey along the coast of Disko Island and published a map showing 25 glaciers, of which some were rock glaciers (referred to as ‘dead glaciers’). Hammer also drew panoramic sketches showing descending glaciers along the northeast and north coast (Reference SteenstrupSteenstrup, 1901). In 1898, an expedition led by Steenstrup explored several previously unvisited valleys (Reference SteenstrupSteenstrup, 1901; Reference PorsildPorsild, 1902). Reference SteenstrupSteenstrup (1901) described and photographed several glaciers, for some of which he estimated the distance between the sea and the glacier terminus and determined the altitude of the glacier terminus using a barometer. Comparing unpublished photographs taken in 1880 and observations in 1898, he concluded that no significant frontal changes had occurred to a glacier complex (glaciers 1HC05004, 1HC05006 and 1HC05007). By 2005, these three glaciers had retreated 2.8, 2.4 and 2.3 km, respectively, from their positions in 1898, which is equal to about 44% of the 1898 lengths of these glaciers.
Glacier fluctuations are best documented from glaciers near the village of Qeqertarsuaq. Between September 1890 and September 1891, glacier 1 HA03004 is reported to have receded 46 m (Reference SteenstrupSteenstrup, 1901). In 1894, Reference ChamberlinChamberlin (1894) initiated investigations of glaciers 1HA04001, 1HA04002, 1HA04003, 1HA04009 and 1HA04011, which were followed by qualitative descriptions, mapping and photographic documentation in 1897 (Reference PjeturssonPjetursson, 1898), 1898 (Reference SteenstrupSteenstrup, 1901), 1912 (de Quervain and Mercanton, 1925) and 1923 (Reference FrodaFroda, 1925). Except for 1HA04003, these glaciers seem to have been close to their outermost terminal moraine in 1894. By 2005, they had receded 1.5–2.0 km, corresponding to 29–56% of their lengths in 1894.
Information on the 20th century is compiled from a topographic map surveyed in 1931–33 (GID, 1941) covering the south and central part of the island, and aerial photographs from 1953–54, 1964 and 1985. The 1964 aerial photographs do not cover the northern part of Disko Island. Information compiled from satellite remote-sensing systems includes Landsat 1 Multispectral Scanner (MSS) from 1973, Landsat 2 MSS from 1976, Landsat 5 Thematic Mapper (TM) from 1985, Système Probatoire pour l’Observation de la Terre (SPOT) 2 from 1991, and Landsat 7 Enhanced TM Plus (ETM+) from 1999, 2002 and 2005 (Table 1). For this study, the terminal recession rate of the 247 glaciers in the database was determined from the years 1953–54 (referred to as 1953), 1964, 1985 and 1999–2005 (referred to as 2005). The 1931–33 map was used to provide a general impression of glacier positions at that time. The relatively low spatial resolution and the total snow cover made the 1973 Landsat 1 MSS and 1976 Landsat 2 MSS images vulnerable to misinterpretation and they were only used to confirm trends. Also, the 1991 SPOT 2 image was only used to confirm trends in glacier fluctuations between 1985 and 1999–2005.
Details of the digital satellite imagery utilized in this study

The SPOT 2 image covers the central, most glacierized part of the island. Manual measurements were consistently obtained along the central axis of the glaciers, although some smaller east–west-orientated glaciers showed asymmetric recession due to the shading effect of adjacent steep north-facing mountain walls. The error margin of determination of glacier fluctuations is assessed to be within ±50–200 m. The main reason for inaccuracy is the distinction between debris-covered glacier snouts, proglacial ice-cored moraines and glacier-derived rock glaciers. Field observations are needed to confirm that some interpretations are correct. Also, although images were selected close to the end of the ablation season where possible, proglacial snow cover made measurements difficult in some cases.
In addition to the data sources used in this study, unpublished photographs taken by Steenstrup in 1898 and by J.P. Koch in 1913 and aerial photographs taken between 1942 and 1945 and in 1949 have previously been referred to in the literature (Reference WeidickWeidick, 1968; Reference HumlumHumlum, 1988).
Results
All the glaciers mentioned in expedition accounts and on early maps have receded during the period 1900–53. Although most of the early authors focused upon marginal recession and thinning of maritime glaciers located near Qeqertarsuaq, exploration surveys to the central valleys also suggest that more continental glaciers have retreated since the beginning of the 20th century (Reference SteenstrupSteenstrup, 1901; Reference PorsildPorsild, 1902; Reference JostJost, 1940). Comparison between the 1931–33 map and the 1953 aerial photographs confirms that many glaciers have receded in the intervening period. However, at least five glaciers advanced between 1931 and 1953, and all show signs of surge activity.
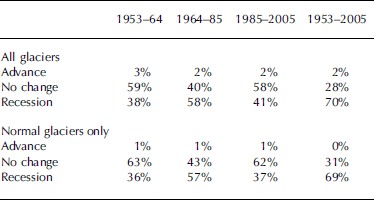
Of the 247 glaciers included in this study, 174 (70%) receded, 68 (28%) experienced no overall change in glacier length and 5 (2%) advanced between 1953 and 2005 (Table 2). Table 2 also shows that most glaciers exhibited no terminus fluctuations between 1953 and 1964 and between 1985 and 2005, whereas the majority of glaciers were receding between 1964 and 1985.
Percentage of glaciers showing changes in length between 1953 and 2005
The incidence and flow characteristics of surge-type glaciers on Disko Island are not well documented. Only four active surge events have previously been described (Reference WeidickWeidick 1984a, Reference Weidickb, Reference Weidick1988; Weidick and others, 1992; Reference Gilbert, Nielsen, Möller, Desloges and RaschGilbert and others, 2002; Reference Yde and KnudsenYde and Knudsen, 2005), and 20 possible surge-type glaciers have been suggested (Reference WeidickWeidick, 1988; Reference Weidick, Böggild and KnudsenWeidick and others, 1992), of which six have been reclassified as normal glaciers in this study. Based upon glaciomorphological surge diagnostics such as looped medial moraines, crevassed surfaces, pothole assemblages, chasms and stranded ice (Reference Yde and KnudsenYde and Knudsen, 2005), a preliminary investigation has classified 75 glaciers as surge-type. However, many glaciers show conspicuously large moraine complexes with limited vegetation cover, and field observations are needed to determine the past surge activity of some glaciers. For instance, the small glacier 1 HD06009 surged in 1953, but no glaciomorphological surge features were identified on later aerial photographs and satellite imagery. Thus, the actual number of surge-type glaciers may be higher.
Field observations of Kuannersuit Glacier (1HB15017) in its initial quiescent phase revealed that lateral recession commenced right after the termination of the surge event in 1998 and was of the order of 10 ma–1. On the other hand, the glacier terminus remained stationary and became more and more debris-covered as a result of melting. By 2005, rapid thinning occurred up-glacier of the uppermost thrust band, and this will eventually lead to detachment of the entire snout. Similar detachment events have been observed at the terminus of several glaciers on Disko Island, leading to periods of enhanced recession.
When glaciers classified as surge-type are excluded from the dataset, the distribution of glacier fluctuations between 1953 and 2005 is similar to the distribution for the entire dataset, except that no normal glaciers advanced in this period (Table 2).
Mean recession rates are assessed with respect to surge behaviour (Table 3). Between 1953 and 2005, normal glaciers receded about 8ma–1, whereas surge-type glaciers retreated 16 ma–1. If glaciers with active surging since 1953 are excluded, quiescent surge-type glaciers experienced a mean recession of 20 ma–1. The maximum recession during the 20th century was the >10km retreat of the Sorte Hak glaciers (1HB15029 and 1HB15031) after a surge event, which must have occurred before 1898.
Mean recession rates of normal and surge-type glaciers, normal glaciers below or above 5 km2 in size, and normal glaciers below or above 800m in elevation of glacier terminus. The mean recession rate of surge-type glaciers, excluding glaciers where surge events have occurred since 1953, is shown in parentheses. Data on size and minimum elevation are from Reference Weidick, Böggild and KnudsenWeidick and others (1992)

In order to evaluate the influence of glacier size on recession rates between 1953 and 2005, normal-flow glaciers were divided into small (1–5km2) and large (5– 21 km2) glaciers. The 5 km2 boundary was chosen to indicate a general change from small glaciers affected by debris cover, rockfall and shadows cast by adjacent mountains to larger valley or outlet glaciers. The mean recession rate for glaciers below 5 km2 was 6ma–1, whereas it was 13 ma–1 for glaciers above 5 km2 (Table 3). Although statistical analyses indicate that mean recession rates and variances were significantly different for glaciers above and below 5 km2, there was no statistical association between glacier size and recession rate within the two populations. The mean recession between 1953 and 2005 was 11% of the glacier lengths in 1953 (n = 172), and 38% of the distance between identified LIA moraines and glacier termini in 1953 (n = 87).
Dividing normal-flow glaciers into populations below or at 800ma.s.l. and above elucidated the role of terminus elevation in glacier recession between 1953 and 2005. The 800ma.s.l. boundary was chosen to reflect the general elevation of the basalt plateaux. The mean recession rate for glaciers with terminus elevation below 800m was 9ma–1, whereas glaciers at higher altitudes receded at 6ma–1 (Table 3). Again, although the mean recession rates and variances were statistically different for the two populations, the associations between minimum elevation and recession rate below and above the 800 m threshold were statistically insignificant.
Mean recession rates were also assessed with respect to the orientation of glacier ablation areas of normal-flow glaciers (Table 4). The results indicated that glaciers with ablation areas facing in the arc south to northwest retreated faster (7–17ma–1) than glaciers with ablation areas facing north to southeast (2–7ma–1).
Mean recession rates of normal glaciers as a function of orientation of ablation area. Data on orientation are from Reference Weidick, Böggild and KnudsenWeidick and others (1992)

Discussion
Glacier fluctuations on Disko Island during the 20th century are in accordance with worldwide observations of glacier retreat (WGMS, http://www.wgms.ch). In 1900, many glaciers were under recession after the advance period during the LIA (Reference SteenstrupSteenstrup, 1901). Field observations in 1913 and comparison with the 1931–33 map indicated that glacier recession continued during the first half of the 20th century (Reference JostJost, 1940). From the early descriptions of glacier terminus positions and calculated recession rates, it seems that glacier recession rates were higher during the first half of the 20th century than during the second half. This supports the finding of Reference WeidickWeidick (1968) that accelerated recession occurred between 1920 and 1940. During the period 1953– 64, the majority of glacier termini remained stationary, followed by a period (1964–85) with more glaciers under recession. Towards the end of the 20th century (1985–2005), most glaciers showed little change in length, although many still receded. The overall glacier fluctuations through the 20th century seem to be in accordance with MAAT and MSAT variations (Fig. 2). The enhanced recession between 1964 and 1985 is in contrast to observations of increase in the number of advancing Alpine glaciers (WGMS, http://www.wgms.ch) and the readvance of parts of the Greenland ice-sheet margin during that period (Reference WeidickWeidick, 1991). The 1964–85 recession on Disko Island may be explained by the time taken by individual glaciers to respond to climatic ameliorations. Information on interannual variations in the duration of ablation seasons in relation to changes in glacier length is required in order to assess more detailed correlations. In addition to temperature, other factors that affect decadal recession rates of normal glaciers are changes in winter precipitation, snowdrift patterns, cloud cover and supraglacial debris cover. Reference HumlumHumlum (1987) notes that an increase in annual precipitation by about 20% has occurred in Ilulissat since the beginning of the 20th century. This increase has likely diminished the effect of the 1.5–2˚C increase in MAAT.
The results indicate that normal glaciers with ablation areas facing in the direction south to northwest, covering an area above 5 km2 and having a minimum altitude below 800m are the most climate-sensitive. This is not surprising, as glaciers facing in these directions are more vulnerable to changes in incoming solar radiation; large glaciers can afford a relatively larger terminal recession in relation to the percentage area loss; and glacier termini at low elevation are exposed to relatively higher summer air temperatures and more days with positive temperatures.
Surge-type glaciers behave differently from normal glaciers in the way that they experience rapid non-climate-related advance phases. Although the advance–retreat cycles of surge-type glaciers are unrelated to climate forcing, the duration and extent of recession and accumulation during the quiescent phase are controlled by climatic conditions in combination with parameters such as glacier dynamics and local topography. On Disko Island, surge-type glaciers are generally larger (12.0km2) than normal glaciers (3.6km2), but their mean terminus elevation is nearly the same (620ma.s.l.) as for normal glaciers (670ma.s.l.), indicating that size may be partly responsible for the enhanced recession rates of surge-type glaciers. The long surge cycles of >100 years and the large frontal advances result in significant volumes of ice being relocated from higher to lower altitudes and extension of ablation areas, when glaciers eventually surge. In the case of Kuannersuit Glacier (1HB15017), about 3 km3 of ice was moved during the 1995–98 surge event, with the result that 80–90% of the total post-surge glacier area is situated in the ablation area.
The potential of glacier surging to explain the advanced positions of many complex moraine systems has been overlooked by previous authors (e.g. Reference Ingólfsson, Frich, Funder and HumlumIngólfsson and others, 1990). When unravelling the Holocene history of Disko Island, past glacier surging must be considered in order to apply glacier fluctuations as an independent proxy for palaeoclimatic conditions (e.g. temperature). In this respect, dating of moraines and glaciofluvial deposits in combination with morphological interpretations of land systems and glaciological features are demanded in order to increase our knowledge on glacier–climate–surging interactions on historical scales.
Conclusions
This study reports that glaciers on Disko Island have undergone a sustained period of recession throughout the 20th century, although the MAAT and MSAT have shown no long-term trends between 1930 and 1990. Glacier recession rates seem to have been higher during the first half of the 20th century. Between 1953 and 2005, 70% of the glaciers showed overall recession, 28% kept the same terminal position and 2% experienced advance due to glacier surging.
Surge-type glaciers have been identified and excluded from the dataset in order to focus on the relationship between changes in glacier length and climate changes. The results suggest that normal glaciers with ablation areas facing in the arc south to northwest, covering an area above 5km2 and having a minimum altitude below 800m are the most sensitive to climatic changes. However, as the incidence of surge-type glaciers is significantly larger than previously believed, their presence has implications for the interpretation of Holocene advance and recession periods and, thus, for the application of glacier fluctuations as a proxy for palaeotemperatures.
Acknowledgements
This research was funded by a grant from the Commission for Scientific Research in Greenland (KVUG). J.C. Yde received financial support from the International Research School of Water Resources (FIVA). We thank A. Kääb, D. Benn and O. Humlum for beneficial comments and suggestions on an earlier version of the paper.



