Implications
Several health beneficial effects have been attributed to n-3 polyunsaturated fatty acids (PUFA); thus, dietary recommendations have focused on reducing the intake of saturated fatty acids, and on increasing that of PUFA, especially n-3 fatty acids. Tissue composition can be improved through the diet, which can be used to improve the nutritional value of meats. This might alter tissue oxidation, which may produce negative biological effects, and in meat this may affect its stability, nutritional and sensory quality. Oxidation may be prevented by increasing tissue content of antioxidants such as tocopherol. We studied the influence of rabbits fed with different fats and antioxidants on the composition and stability of their plasma, liver and meat.
Introduction
The composition of biological tissues can be modified through diet, either by direct incorporation of the absorbed compounds or by their interactions with anabolic and catabolic pathways. If the n-6/n-3 fatty acid (FA) ratio of diets is reduced, this generates eicosanoids with more beneficial effects in some chronic diseases than those derived from n-6 FA (Kinsella et al., Reference Kinsella, Lokesh and Stone1990; Simopoulos, Reference Simopoulos1997; Siddiqui et al., Reference Siddiqui, Harvey and Zaloga2008).
Attempts have been made to increase the long-chain n-3 polyunsaturated fatty acids (PUFA) content in animal tissues by enriching diets with fats that have a high linolenic acid content (Bernardini et al., Reference Bernardini, Dal Bosco and Castellini1999; Enser et al., Reference Enser, Richardson, Wood, Gill and Sheard2000; Bou et al., Reference Bou, Grimpa, Guardiola, Barroeta and Codony2006b). However, the increase in dietary long-chain n-3 PUFA, achieved for instance by adding marine fat sources to the diet, has been reported to be more effective (Nettleton, Reference Nettleton1991; Wood and Enser, Reference Wood and Enser1997). But this might also lead to more unstable tissues from an oxidative point of view because lipid oxidation is favored in highly unsaturated FA (Frankel, Reference Frankel1998).
Oxidation in biological tissues should be avoided because some negative biological effects have been attributed to lipid oxidation products (Guardiola et al., Reference Guardiola, Dutta, Codony and Savage2002; Niki et al., Reference Niki, Yoshida, Saito and Noguchi2005; Spiteller, Reference Spiteller2006). In meat and food products, oxidation might lead to a reduction of the sensory and nutritional quality (Gray et al., Reference Gray, Gomaa and Buckley1996). Oxidation can be prevented in foods and biological tissues by the action of antioxidants, for instance increasing the α-tocopherol (αT) content in tissues as a result of a higher αT intake (Cherian et al., Reference Cherian, Wolfe and Sim1996; Gray et al., Reference Gray, Gomaa and Buckley1996).
Rabbit meat is interesting from a nutritional point of view, since it has a low cholesterol and fat content, and the fat depot can be more easily removed than in other meats, such as beef or pork (Food Standards Agency, 2002). Regardless of the feeding regimen, rabbit meat FA composition is richer in PUFA than lamb, beef or pork and its content of saturated fatty acids (SFA) is lower than in beef or lamb (Food Standards Agency, 2002).
Several studies have been conducted on animals such as chicken, pig or beef, since they produce highly consumed meats (Gray et al., Reference Gray, Gomaa and Buckley1996; Wood et al., Reference Wood, Richardson, Nute, Fisher, Campo, Kasapidou, Sheard and Enser2003). Fewer studies in the literature deal with rabbit feeding, although recently the number of studies conducted with rabbit has increased (Pla and Cervera, Reference Pla and Cervera1997; Bernardini et al., Reference Bernardini, Dal Bosco and Castellini1999; Castellini et al., Reference Castellini, Dal Bosco and Bernardini2001; Dalle Zotte, Reference Dalle Zotte2002; Dal Bosco et al., Reference Dal Bosco, Castellini, Bianchi and Mugnai2004; Lo Fiego et al., Reference Lo Fiego, Santoro, Macchioni, Mazzoni, Piattoni, Tassone and De Leonibus2004; Corino et al., Reference Corino, Lo Fiego, Macchioni, Pastorelli, Di Giancamillo, Domeneghini and Rossi2007; Gigaud and Combes, Reference Gigaud and Combes2008; Maertens et al., Reference Maertens, Huyghebaert and Delezie2008; Zsedely et al., Reference Zsedely, Toth, Eiben, Virag, Fabian and Schmidt2008). Most of them are focused on rabbit meat due to its nutritional value, but there is a lack of comprehensive studies dealing, at the same time, with rabbit plasma, meat and other tissues more involved in the animal’s metabolism, such as the liver. Therefore, we studied the addition of different fat sources to feeds, with or without the dietary supplementation with α-tocopheryl acetate (TA) on the FA composition, the αT content and the oxidative stability of plasma, liver and meat. In a previous paper coming from this study, the effects of cooking and the refrigerated storage of cooked rabbit meat were reported (Tres et al., Reference Tres, Bou, Codony and Guardiola2008).
Material and methods
The reagents and standards used were reported in Tres et al. (Reference Tres, Bou, Codony and Guardiola2008).
Animals and diets
The preparation of diets and housing of animals took place in the Animal Science Department at the Polytechnic University of Valencia. A total of 12 isocaloric dietary treatments were prepared from a basal diet (described in Tres et al. (Reference Tres, Bou, Codony and Guardiola2008)) by combining several dietary factors, according to a factorial design (2 × 3 × 2) replicated four times: two vegetable fat sources were used to replace animal fat (beef tallow (BT)), one rich in n-6 FA (sunflower oil (SO)) and another rich in n-3 FA (linseed oil (LO)); three doses of vegetable fat replacement (0%, 1.5% or 3% (wt/wt) of vegetable fat; in all treatments, total added fat was completed up to 3% (wt/wt) with BT); and TA (0 or 100 mg TA/kg of feed).
The animal experiments were performed in the animal facilities of the Polytechnic University of Valencia (Spain), and received prior approval from the respective Animal Protocol Review Committee. All animal housing, husbandry and slaughtering conditions agreed to current European Union guidelines.
Samples
Feed samples were taken at the end of the feeding trial, as described in Tres et al. (Reference Tres, Bou, Codony and Guardiola2008).
In all, 288 rabbits (a cross of New Zealand and Californian rabbits) were weaned at 28 days. They were randomly divided into 48 groups (12 dietary treatments, four replicates, six rabbits per cage) and fed ad libitum with the corresponding experimental diet. At 63 days of age, rabbits were electrically stunned and killed by cutting carotids and jugulars. From four rabbits in each group, 20 ml of blood per animal was collected in heparinized tubes and immediately centrifuged at 1450 × g at 4°C for 10 min. Plasma samples from each group were mixed and transferred into microtubes and stored at −80°C until analysis. Livers were immediately removed from carcasses and refrigerated at 4°C for 5 h. Then, the six livers from each group were mixed, ground and vacuum-packed in high-barrier multilayer bags (Cryovac BB325, permeability to O2 25 cm3×m−2×day−1×bar−1 at 23°C and 0% RH, ASTMD-3985; Cryovac Europe, Sealed Air S. L., Sant Boi de Llobregat, Spain; approximately 15 g liver/bag) and stored at −80°C until analysis. Meat samples were obtained as described in Tres et al. (Reference Tres, Bou, Codony and Guardiola2008).
Feed and meat analysis
Feed FA composition and αT content were analyzed as described in Tres et al. (Reference Tres, Bou, Codony and Guardiola2008).
Fatty acid composition, αT content, oxidation (thiobarbituric acid (TBA) value) and oxidative stability (lipid hydroperoxide (LHP) value) of meat were described in Tres et al. (Reference Tres, Bou, Codony and Guardiola2008).
Fatty acid composition of plasma and liver
Plasma FA composition was determined by gas chromatography. First, 0.6 ml of plasma was pipetted into a 50 ml-screw-capped tube. A volume of 20 ml chloroform : methanol (2 : 1, vol/vol) was then added and the mixture was mixed for 45 min using a magnetic stirring bar. The mixture was transferred to another tube, and residues in the first tube were washed twice with 10 ml of the same solvent mixture and transferred to the second tube. Then, 10 ml of 1% (wt/vol) sodium chloride was added. The tube was manually shaken and centrifuged for 20 min at 500 × g. The chloroform phase was filtered through anhydrous sodium sulfate (using Whatman No. 1 filter paper), which was then washed once with 5 ml of chloroform : methanol (2 : 1, vol/vol) and then twice with 5 ml of chloroform. The lipid extract was concentrated in a vacuum rotatory evaporator at 35°C. It was then dissolved with diethyl ether and quantitatively transferred to a screw-capped tube (16 × 100 mm) containing the internal standard (heneicosanoic acid (C21:0) methyl ester). The solvent was removed under a slight nitrogen stream, and the tube was left overnight in a vacuum desiccator at 10 mmHg. FA methyl esters were prepared by adapting the method used for feed, liver and meat (Guardiola et al., Reference Guardiola, Codony, Rafecas, Boatella and Lopez1994) to plasma samples: 1 ml of 0.5 N methanolic solution of sodium methoxide was added and the tube was placed in a boiling water bath for 20 min. Then, the tube was chilled and 1 ml of a methanolic solution of boron trifluoride (14%, wt/vol) was added and the tube was placed in a boiling water bath for 15 min. It was then chilled to room temperature and the FA methyl esters were extracted by adding 2 ml of n-hexane and 1 ml of saturated sodium chloride solution to the tube. The hexanic phase was transferred to a vial containing a small amount of anhydrous sodium sulfate. After 1 h, 1 ml of the hexanic phase was transferred to another tube (10 × 75 mm) and evaporated under a light nitrogen stream at 30°C. Then, 0.15 ml of n-hexane was added to dissolve the FA methyl esters. A volume of 2 μl was injected in the gas chromatograph, following the conditions described in Tres et al. (Reference Tres, Bou, Codony and Guardiola2008).
The FA composition of liver was determined by gas chromatography, following the same procedure used in meat, which is also described in Tres et al. (Reference Tres, Bou, Codony and Guardiola2008).
Determination of α-tocopherol in plasma and liver
Plasma αT content was determined as follows: 0.25 ml of plasma was transferred into a screw-capped tube (16 × 100 mm). Then, 0.1 ml of internal standard solution (TA in ethanol) and 0.4 ml of an ethanolic solution containing 0.032% (wt/vol) of butylated hydroxytoluene and 0.3% (wt/vol) of pyrogallol was added. After 1 min of vortex agitation, 0.75 ml of hexane was added, and the solution was mixed by another minute of vortex agitation. Tubes were then centrifuged for 10 min at 1000 × g, and the hexanic phase was transferred to another tube. The remaining ethanolic phase was re-extracted twice with 0.75 ml of hexane. The three hexanic phases were mixed and filtered through a 0.45 μm PTFE (polytetrafluoroethylene) filter. Filters were washed twice with 0.5 ml of hexane. The solvent was evaporated under a light nitrogen stream at 30°C. The residue was dissolved in 200 μl of 96% ethanol. Chromatographic separation of this solution was performed using an Agilent 1100 Series liquid chromatograph (Agilent Technologies, Santa Clara, CA), equipped with a Rheodyne 7725i model injector (Rheodyne, Cotati, CA) with a loop volume of 500 μl (samples were injected by partial loop filling using 100 μl of sample), a reverse phase column (15 × 0.4 cm, 3 μm, 80 Å, Tracer Extrasil ODS2; Teknokroma, Sant Cugat del Valles, Spain) and a precolumn (1 × 0.4 cm, 3 μm, 80 Å, Tracer Extrasil ODS2; Teknokroma). Sample compounds were isocratically eluted with methanol at 1.5 ml/min at 27°C and detected by means of an Agilent 1100 Series variable wavelength UV detector (Agilent Technologies) (wavelength at 292 nm, set after 3.9 min at 285 nm). The content of αT was determined by means of a calibration curve using TA as an internal standard.
The content of αT in liver was determined, after saponification, by HPLC-fluorescence detection (Tres et al., Reference Tres, Bou, Codony and Guardiola2008).
Lipid hydroperoxide determination
In order to assess the susceptibility of plasma and liver to lipid oxidation, LHP value was measured by the ferrous oxidation–xylenol orange (FOX) method (Grau et al., Reference Grau, Codony, Rafecas, Barroeta and Guardiola2000a) adapted to these samples. In this method, the methanolic extract of a sample was mixed with the FOX reagents in glass cuvettes capped with Teflon caps, and then the mixture (the final volume of the reaction mixture was always 2 ml) was left in the dark to induce LHP formation until absorbance readings at 560 nm were steady over time. The formed LHP were quantified with a calibration curve using cumene hydroperoxide (CHP) as standard.
The FOX method described by Grau et al. (Reference Grau, Codony, Rafecas, Barroeta and Guardiola2000a) was adapted to plasma samples: 300 μl of plasma were pipetted into screw-capped tubes (16 × 100 mm), and 3 ml of cold methanol was added. This blend was agitated by vortex for 1 min and centrifuged for 5 min at 1350 × g. Then, in glass cuvettes capped with Teflon caps, two aliquots of 600 μl of the supernatant were mixed: one with 500 μl of 10 mM triphenylphosphine (TPP) in methanol, and the other with 500 μl of methanol. After 30 min, 900 μl of FOX reagent (500 μl of 1 mM ferrous-ammonium sulfate, 200 μl of 0.25 M sulfuric acid in methanol, 200 μl of 1 mM xylenol orange in methanol) was added. Absorbance from cuvettes containing TPP was measured after 30 min, and absorbance from cuvettes without TPP was assessed after 116 h. As TPP is a specific reducing agent of organic hydroperoxides, the residual absorbance developed by cuvettes containing TPP measures hydrogen peroxide, free ferric ion or other chromophores present in the sample (Nourooz-Zadeh et al., Reference Nourooz-Zadeh, Tajaddini-Sarmadi and Wolff1994; Sodergren et al., Reference Sodergren, Nourooz-Zadeh, Berglund and Vessby1998; VanderJagt et al., Reference VanderJagt, Harrison, Ratliff, Hunsaker and VanderJagt2001). Therefore, the difference in absorbance between cuvettes without TPP and with TPP was used to calculate the LHP value by means of a calibration curve, using CHP as standard. No increase in absorbance at 560 nm was observed when the FOX reaction was incubated for 30 min with meat or liver methanolic extracts and TPP (data not shown).
The FOX method used for meat samples (Tres et al., Reference Tres, Bou, Codony and Guardiola2008) was adapted to liver samples: 20 ml of cold methanol was added to 2 g liver samples. After homogenization and centrifugation, methanolic extract was diluted ten-fold and 250 μl of it was added to the FOX mixture. Absorbance was measured after 168 h.
Determination of TBA value
The TBA value in rabbit plasma and liver was determined by an acid aqueous extraction method with third derivative spectrophotometry described by Grau et al. (Reference Grau, Guardiola, Boatella, Barroeta and Codony2000b). In plasma, the volumes of reagents needed were adjusted to the sample amount that was 1 ml of plasma. In liver, the sole difference with respect to the original method was that after the reaction mixture was cooled, samples were tempered for 2.5 h at room temperature in order to obtain a steady reading.
Statistics
Multifactor ANOVA was used to determine significant differences in αT content, FA composition and LHP and TBA values due to the dietary factors (source of n-3 or n-6 fat, dose of n-6 or n-3 fat, and TA supplementation) in rabbit plasma (n = 48) and liver (n = 48). Multifactor ANOVA was used to determine whether there were any significant differences in αT content, LHP value, TBA value and FA composition between plasma, liver and meat samples (n = 144). Least-squares means for the main factors that had a significant effect were separated by the Scheffé’s test (except when otherwise stated). Pearson correlation coefficients were calculated between αT content, LHP and TBA values in plasma, liver and meat. In all cases, P ⩽ 0.05 was considered significant.
Results and discussion
Fatty acid composition
The FA composition of feeds differed depending on both the source and dose of unsaturated fat used to replace BT (Tres et al., Reference Tres, Bou, Codony and Guardiola2008). Feeds containing 3% (wt/wt) BT had the highest content of SFA, monounsaturated fatty acids (MUFA) and total trans FA, and the lowest content of PUFA. Feeds with added SO had a higher content of C18:2n-6, while in feeds containing LO, the C18:3n-3 content was higher. Long-chain PUFA, such as C22:5n-6, C22:5n-3 or C22:6n-3, were not detected in feeds. The addition of TA (100 mg/kg) to feeds had no effect on feed FA composition. Feed composition was fully described in Tres et al. (Reference Tres, Bou, Codony and Guardiola2008).
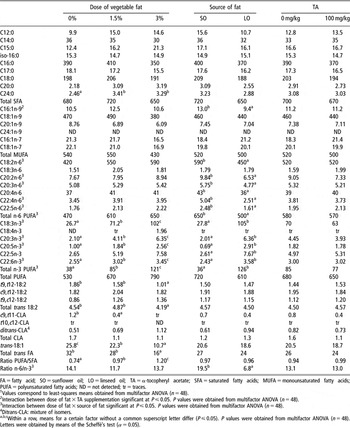
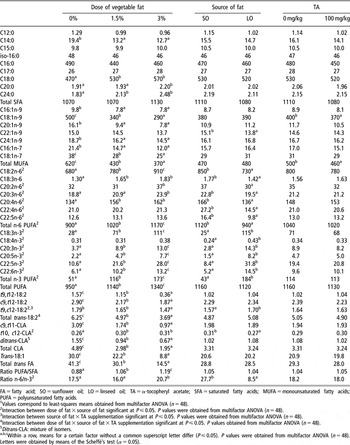
According to what was found in meat (Tres et al., Reference Tres, Bou, Codony and Guardiola2008), the FA composition of plasma (Table 1) and liver (Table 2) was mainly affected by feed FA composition (Tres et al., Reference Tres, Bou, Codony and Guardiola2008), which depended on the dose and source of n-6- or n-3-rich vegetable fat used in feeds. Changes in the FA composition of tissues from rabbit (Bernardini et al., Reference Bernardini, Dal Bosco and Castellini1999), other animals (Wood and Enser, Reference Wood and Enser1997; Enser et al., Reference Enser, Richardson, Wood, Gill and Sheard2000; Bou et al., Reference Bou, Grimpa, Guardiola, Barroeta and Codony2006b) and humans (Arterburn et al., Reference Arterburn, Hall and Oken2006) have been reported as a result of varying the FA profile of diets. In our study in rabbits, the content of trans FA in plasma and liver and the content of MUFA in liver decreased, while total PUFA in liver increased (Tables 1 and 2) as BT in feeds was replaced by increasing doses of n-6- or n-3-rich vegetable fat (Tres et al., Reference Tres, Bou, Codony and Guardiola2008). Meat FA composition was similarly affected by the type and dose of vegetable fat added to feeds (Tres et al., Reference Tres, Bou, Codony and Guardiola2008).
The content of SFA in plasma was not significantly affected by feed FA composition, whereas C24:0 increased when BT had been replaced in the feeds, thus reflecting feed FA composition (Table 1). In liver, most of the SFA remained unchanged when BT was replaced by a vegetable fat source (Table 2) whereas C18:0, C20:0 and C24:0 increased. These increases reflected feed FA composition with the exception of stearic acid which followed the opposite trend than in feeds. However, in meat, all SFA, including stearic acid, followed feed FA composition (Tres et al., Reference Tres, Bou, Codony and Guardiola2008). Therefore, liver stearic acid content might be affected by the tissue’s role in FA metabolism and storage, since its metabolic pathways might be altered by the dietary factors. One possible explanation can be found in the increase in PUFA content in liver as BT was reduced in feeds. It has been reported that PUFA inhibit the activity of stearoyl-CoA-desaturase, the enzyme that synthesizes oleic acid from stearic acid, thus regulating its expression (Sessler et al., Reference Sessler, Kaur, Palta and Ntambi1996). This inhibition could lead to accumulation of the precursor (C18:0), and reduction in MUFA content, which might also be affected by the lower MUFA supply in the diet as vegetable fat increased in feeds. In fact, MUFA content was much more reduced in liver (40%) than in meat (26%) (Tres et al., Reference Tres, Bou, Codony and Guardiola2008) as the dose of vegetable fat increased in feeds. This difference between tissues might be related to the higher biosynthetic role of liver, in which the inhibition of stearoyl-CoA-desaturase might lead to a major decrease in MUFA content and to an accumulation of stearic acid in liver but not in meat.
The PUFA/SFA ratio increased in plasma and liver as increasing doses of n-6- or n-3-rich vegetable fats were added to feeds. However, long-chain PUFA, such as C22:5n-6, C22:5n-3 or C22:6n-3, were not detected in feeds (Tres et al., Reference Tres, Bou, Codony and Guardiola2008). Therefore, their presence in plasma and liver might have a biosynthetic origin, which in turn could be modified by the dietary factors, particularly the dose and the FA profile of the dietary fat added to feeds. In addition, supplementation with TA might also affect FA biosynthesis (Tres et al., Reference Tres, Bou, Codony and Guardiola2008).
Long-chain n-6 and n-3 PUFA are biosynthesized from their precursors (linoleic acid and linolenic acid, respectively) through an enzymatic system that involves elongation and desaturation. Both precursors share the same enzyme, Δ6-desaturase (Burdge and Calder, Reference Burdge and Calder2005b), which has more affinity for linolenic acid. In our study in rabbits, increased amounts of EPA and DHA were found in plasma and liver due to the addition of LO to feeds (Tables 1 to 3), as it had been found in meat (Tres et al., Reference Tres, Bou, Codony and Guardiola2008). This is in accordance with other studies in rabbit (Bernardini et al., Reference Bernardini, Dal Bosco and Castellini1999; Dal Bosco et al., Reference Dal Bosco, Castellini, Bianchi and Mugnai2004; Maertens et al., Reference Maertens, Huyghebaert and Delezie2008) and other animals (Enser et al., Reference Enser, Richardson, Wood, Gill and Sheard2000; Bou et al., Reference Bou, Grimpa, Guardiola, Barroeta and Codony2006b). However, the effectiveness of the synthesis of DHA from linolenic acid in animals and humans is controversial, as it has been reported to be limited (Cherian and Sim, Reference Cherian and Sim1995; D’Arrigo et al., Reference D’Arrigo, Hoz, Lopez-Bote, Cambero, Pin and Ordonez2002; Hoz et al., Reference Hoz, Lopez-Bote, Cambero, D’Arrigo, Pin, Santos and Ordonez2003; Burdge and Calder, Reference Burdge and Calder2005b; Nuernberg et al., Reference Nuernberg, Fischer, Nuernberg, Kuechenmeister, Klosowska, Eliminowska-Wenda, Fiedler and Eder2005). This has been related to the last step in the biosynthesis pathway of DHA, a β-oxidation of C24:6n-3 which involves translocations between the endoplasmic reticulum and peroxisomes of both DHA and its precursor (C24:6n-3) (Burdge and Calder, Reference Burdge and Calder2005b; Arterburn et al., Reference Arterburn, Hall and Oken2006).
Fatty acid composition of rabbit plasma (mg of FA/l) depending on the dose and source of vegetable fat used to replace beef tallow in feeds, and on dietary supplementation with α-tocopheryl acetateFootnote 1

FA = fatty acid; SO = sunflower oil; LO = linseed oil; TA = α-tocopheryl acetate; SFA = saturated fatty acids; MUFA = monounsaturated fatty acids; PUFA = polyunsaturated fatty acids; ND = not detected; tr = traces.
1 Values correspond to least-squares means obtained from multifactor ANOVA (n = 48).
2 Interaction between dose of fat × TA supplementation significant at P ⩽ 0.05. P values were obtained from multifactor ANOVA (n = 48).
3 Interaction between dose of fat × source of fat significant at P ⩽ 0.05. P values were obtained from multifactor ANOVA (n = 48).
4 Ditrans-CLA: mixture of isomers.
a,b,c Within a row, means for a certain factor without a common superscript letter differ (P ⩽ 0.05). P values were obtained from multifactor ANOVA (n = 48). Letters were obtained by means of the Scheffé’s test (α = 0.05).
Fatty acid composition of liver (mg of FA/100 g) depending on the dose and source of vegetable fat used to replace beef tallow in feeds, and on dietary supplementation with α-tocopheryl acetateFootnote 1

FA = fatty acid; SO = sunflower oil; LO = linseed oil; TA = α-tocopheryl acetate; SFA = saturated fatty acids; MUFA = monounsaturated fatty acids; PUFA = polyunsaturated fatty acids.
1 Values correspond to least-squares means obtained from multifactor ANOVA (n = 48).
2 Interaction between dose of fat × source of fat significant at P ⩽ 0.05. P values were obtained from multifactor ANOVA (n = 48).
3 Interaction between source of fat × TA supplementation significant at P ⩽ 0.05. P values were obtained from multifactor ANOVA (n = 48).
4 Interaction between dose of fat × source of fat × TA supplementation significant at P ⩽ 0.05. P values obtained from multifactor ANOVA (n = 48).
5 Ditrans-CLA: mixture of isomers.
a,b,c Within a row, means for a certain factor without a common superscript letter differ (P ⩽ 0.05). P values were obtained from multifactor ANOVA (n = 48). Letters were obtained by means of the Scheffé’s test (α = 0.05).
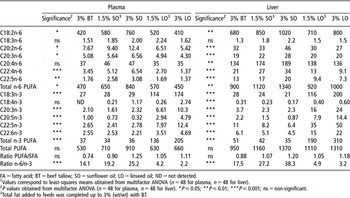
Effect of the source and dose of unsaturated fat used to replace beef tallow in feeds on the content of n-6 and n-3 FA in plasma (mg of fatty acid/l of plasma) and liver (mg of fatty acid/100 g of liver)Footnote 1

FA = fatty acid; BT = beef tallow; SO = sunflower oil; LO = linseed oil; ND = not detected.
1 Values correspond to least-squares means obtained from multifactor ANOVA (n = 48 for plasma, n = 48 for liver).
2 P values obtained from multifactor ANOVA (n = 48 for plasma, n = 48 for liver). *P ⩽ 0.05; **P ⩽ 0.01; ***P ⩽ 0.001; ns = non-significant.
3 Total fat added to feeds was completed up to 3% (wt/wt) with BT.
For the content of long-chain n-6 and n-3 PUFA in plasma and liver, we observed an interaction between the dose and the source of n-6- or n-3-rich vegetable fat used to replace BT in feeds (Table 3). As the dose of SO increased in feeds (linoleic acid increased and linolenic acid remained the same), the content of long-chain n-6 FA increased in the plasma and liver with significant reductions in some n-3 PUFA, such as C20:5n-3, C22:5n-3 or C22:6n-3. When LO was added to feeds at 1.5% or 3% (wt/wt), linolenic acid and long-chain n-3 PUFA increased in plasma and liver, while the content of some very long-chain n-6 FA (such as C22:4n-6 or C22:5n-6) was concomitantly reduced. For instance, in plasma, C22:5n-3 and C22:6n-3 increased 1.8-fold and 4.7-fold, respectively, when BT (3%, wt/wt) was completely replaced by LO (3%, wt/wt), and there was a 60% and 22% reduction in the content of C22:4n-6 and C22:5n-6 (Table 3). Although the content of C18:2n-6 in feeds and liver was higher in LO than in BT treatments, the linoleic/linolenic acid ratio of LO treatments favored the biosynthesis of long-chain n-3 PUFA by Δ6-desaturase due to its greater affinity for linolenic acid than for linoleic acid. A similar effect of increasing doses of LO in feeds was found in meat FA composition (Tres et al., Reference Tres, Bou, Codony and Guardiola2008); however, due to the higher biosynthetic activity of liver, the increases in long-chain n-3 PUFA in liver were greater than in meat, as were the decreases in long-chain n-6 FA. In other animal and human studies, concomitant reductions have also been reported in the content of long-chain n-6 PUFA, as a result of increased biosynthesis of n-3 FA in several tissues due to dietary LO (Cherian et al., Reference Cherian, Wolfe and Sim1996; Bernardini et al., Reference Bernardini, Dal Bosco and Castellini1999; Nuernberg et al., Reference Nuernberg, Fischer, Nuernberg, Kuechenmeister, Klosowska, Eliminowska-Wenda, Fiedler and Eder2005; Arterburn et al., Reference Arterburn, Hall and Oken2006).
Dietary TA supplementation (100 mg/kg) did not affect plasma FA composition, but reduced the content of C18:1n-9 in liver (Table 2). In meat, TA supplementation affected the n-3 FA composition when LO was added at 3% (wt/wt). This effect was attributed to both a protection effect of αT against PUFA oxidation, and to an enhancement of long-chain PUFA biosynthesis (Tres et al., Reference Tres, Bou, Codony and Guardiola2008). These changes on n-3 FA composition were not significant in plasma and liver, although the same tendency was observed. The higher αT content already in livers from non-TA supplemented diets, compared with the corresponding meats, could account for the lack of significance for this interaction. This is in accordance with Surai and Sparks (Reference Surai and Sparks2000) who, as a result of increased dietary vitamin E, also found increases in long-chain FA content in cockerel meat, testes and cerebellum, but not in liver.
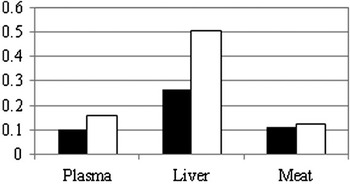
When the FA composition in plasma, liver and meat was compared, some differences were found. The proportions of the different FA varied among the tissues. For instance, in plasma the linoleic/linolenic acid ratio is higher than that found in meat (Tables 1 and 3) (Tres et al., Reference Tres, Bou, Codony and Guardiola2008). In liver, linoleic acid content was 1.5-fold higher than in meat, but the content of linolenic acid was only half that in meat (Tables 2 and 3). This could be due to liver preferentially accumulating linoleic acid rather than linolenic acid; to a reduction in the content of linolenic acid due to its preferential use by Δ6-desaturase in the biosynthesis of long-chain PUFA (Burdge and Calder, Reference Burdge and Calder2005a); and to preferential use of linolenic acid instead of linoleic acid for β-oxidation (McCloy et al., Reference McCloy, Ryan, Pencharz, Ross and Cunnane2004). Consequently in liver, the ratio between the amount of long-chain n-3 PUFA derived from linolenic acid and the content of linolenic acid was much higher than the ratio between the amount of long-chain n-6 PUFA derived from linoleic acid and the content of linoleic acid (Figure 1). Furthermore, these ratios were higher in liver than in plasma and meat, which in turn showed similar values. However, the long-chain n-3 PUFA/linolenic acid ratio was slightly higher in plasma. These findings might reflect the different functions of FA in these tissues: FA in muscle have mainly a structural, regulatory and energy function, but liver has a greater biosynthetic function. As plasma transports FA between tissues, its FA composition, and therefore its ratios, were proportionally intermediate between those of liver and meat.
Ratio between long-chain n-6 fatty acids synthesized from linoleic acid and linoleic acid (in black), and ratio between long-chain n-3 fatty acids synthesized from linolenic acid and linolenic acid (in white), in rabbit plasma, liver and meat.

Dietary FA composition determines the FA composition of several tissues, both by direct incorporation of FA from the diet into tissues and also by the induction of some changes in FA metabolism. Dietary recommendations suggest increasing the PUFA/SFA ratio, and decreasing the n-6/n-3 FA ratio of diets to values of 10 to 5 or less (Simopoulos, Reference Simopoulos2002; Food and Nutrition Board, 2005), as both n-6 and n-3 FA compete for the same enzymes in the production of eicosanoids. In our study, the replacement of BT in feeds by a vegetable fat source led to increases in the PUFA/SFA ratio in plasma, liver and meat. However, the FA composition of tissues was improved when the vegetable fat used was LO, since it decreased the n-6/n-3 FA ratio (Tables 1, 2 and 3). Therefore, rabbit meat FA profile was more nutritionally favorable when LO was used in feeds instead of BT or SO (Tres et al., Reference Tres, Bou, Codony and Guardiola2008).
Content of α-tocopherol
The content of αT was higher in supplemented feeds (100 mg TA/kg) than in non-supplemented feeds (124 v. 34 mg of αT/kg of feed). It was also slightly higher in SO feeds than in LO feeds (81 v. 75 mg of αT/kg of feed). However, it was not affected by the dose of unsaturated fat used in BT replacement (Tres et al., Reference Tres, Bou, Codony and Guardiola2008).
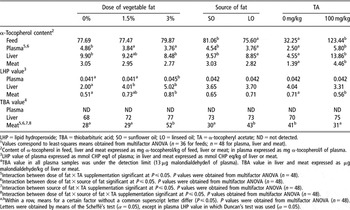
The highest content of αT was found in liver (9.21 mg/kg), followed by plasma (4.15 mg/l) and meat (2.93 mg/kg).
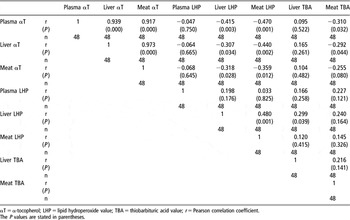
Dietary supplementation with TA (100 mg/kg) increased the αT content in rabbit plasma by 2.3-fold, and the content in liver and meat by 3-fold (Table 4), according to previous literature in rabbit (Castellini et al., Reference Castellini, Dal Bosco and Bernardini1998 and Reference Castellini, Dal Bosco, Bernardini and Cyril2001; Oriani et al., Reference Oriani, Corino, Pastorelli, Pantaleo, Ritieni and Salvatori2001; Lo Fiego et al., Reference Lo Fiego, Santoro, Macchioni, Mazzoni, Piattoni, Tassone and De Leonibus2004) and other animal species (Sheehy et al., Reference Sheehy, Morrissey and Flynn1994; Russell et al., Reference Russell, Lynch, O’Sullivan and Kerry2004; Bou et al., Reference Bou, Grimpa, Baucells, Codony and Guardiola2006a). Although this increase was proportionally slightly higher in meat than in liver (3.2-fold v. 3-fold), liver from rabbits on TA-supplemented diets presented the highest αT content (Table 4). This reflects the αT storage capacity of liver, according to previous studies (Surai and Sparks, Reference Surai and Sparks2000; Lo Fiego et al., Reference Lo Fiego, Santoro, Macchioni, Mazzoni, Piattoni, Tassone and De Leonibus2004; Russell et al., Reference Russell, Lynch, O’Sullivan and Kerry2004). Furthermore, positive correlations were found among the αT content in plasma, liver and meat (Table 5). This suggests that αT content in plasma responds to feed αT content and reflects the αT status of tissues (Sheehy et al., Reference Sheehy, Morrissey and Flynn1994; Castellini et al., Reference Castellini, Dal Bosco and Bernardini2001; Oriani et al., Reference Oriani, Corino, Pastorelli, Pantaleo, Ritieni and Salvatori2001).
Content of α-tocopherol, LHP and TBA values of rabbit plasma, liver and meat depending on the dose and source of n-6- or n-3-rich vegetable fat used to replace beef tallow in feeds, and on dietary supplementation with α-tocopheryl acetate (100 mg/kg)Footnote 1

LHP = lipid hydroperoxide; TBA = thiobarbituric acid; SO = sunflower oil; LO = linseed oil; TA = α-tocopheryl acetate; ND = not detected.
1 Values correspond to least-squares means obtained from multifactor ANOVA (n = 36 for feeds; n = 48 for plasma, liver and meat).
2 Content of α-tocopherol in feed, liver and meat expressed as mg α-tocopherol/kg of feed, liver or meat; in plasma expressed as mg α-tocopherol/l of plasma.
3 LHP value of plasma expressed as mmol CHP eq/l of plasma; in liver and meat expressed as mmol CHP eq/kg of liver or meat.
4 TBA value in all plasma samples was under the detection limit (13 μg malondialdehyde/l of plasma). TBA value in liver and meat expressed as μg malondialdehyde/kg of liver or meat.
5 Interaction between dose of fat × TA supplementation significant at P ⩽ 0.05. P values were obtained from multifactor ANOVA (n = 48).
6 Interaction between dose of fat × source of fat significant at P ⩽ 0.05. P values were obtained from multifactor ANOVA (n = 48).
7 Interaction between source of fat × TA supplementation significant at P ⩽ 0.05. P values were obtained from multifactor ANOVA (n = 48).
8 Interaction between dose of fat × source of fat × TA supplementation significant at P ⩽ 0.05. P values obtained from multifactor ANOVA (n = 48).
a,b Within a row, means for a certain factor without a common superscript letter differ (P ⩽ 0.05). P values were obtained from multifactor ANOVA (n = 48). Letters were obtained by means of the Scheffé’s test (α = 0.05), except in plasma LHP value in which Duncan’s test was used (α = 0.05).
Pearson correlation coefficients between α-tocopherol content, TBA value and lipid hydroperoxide value in rabbit plasma, liver and meat

αT = α-tocopherol; LHP = lipid hydroperoxide value; TBA = thiobarbituric acid value; r = Pearson correlation coefficient.
The P values are stated in parentheses.
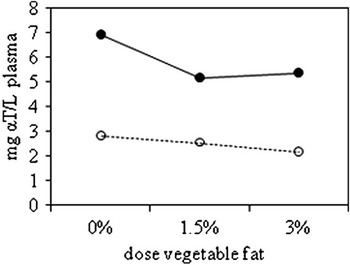
Dietary supplementation with TA (100 mg/kg) increased the αT content in plasma. However, this αT content was much higher when BT was not replaced by a vegetable fat, while it reached similar levels when BT was half or completely replaced (Figure 2). The complete replacement of BT by a vegetable fat (regardless of its source) led to a significant reduction in αT content in plasma from rabbits on non-TA supplemented diets (Figure 2).
Content of α-tocopherol in plasma depending on the dose of vegetable fat used to replace beef tallow in feeds and dietary supplementation with α-tocopheryl acetate (0 mg/kg, discontinuous line – open symbols, or 100 mg/kg, continuous line, bold symbols).

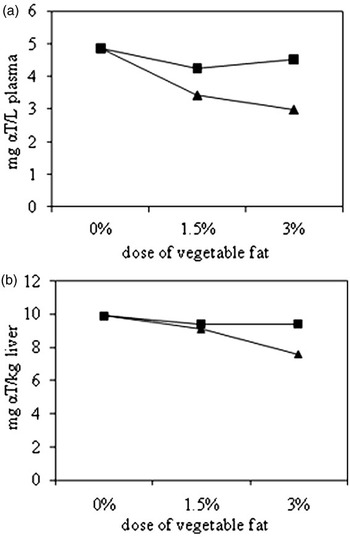
For the αT content in plasma, there was a significant interaction between the doses of vegetable fat used to replace BT in feeds and its source (SO or LO) (Figure 3a). The content of αT decreased as the dose of vegetable fat increased, but this decrease was more pronounced when LO was used. Indeed, the addition of either 1.5% or 3% (wt/wt) SO to feeds decreased (10%) the plasma αT content to similar levels. However, when LO was used at 1.5% (wt/wt), the αT content in plasma was reduced by 30% (compared with plasma from BT diets). In contrast, when LO was added at 3% (wt/wt), a 39% reduction in plasma αT content was found (Figure 3a). Similar results were obtained in liver (P = 0.080), in which the lowest αT content was also encountered in animals on 3% LO diets. All the other treatments led to higher and similar liver αT content (Figure 3b). These reductions in αT content were in accordance with the FA composition of tissues which, as discussed above, also depended on the dose and source of n-3- or n-6-rich vegetable fat. The amount of unsaturated fat rose as LO increased in feeds. Therefore, the increase of PUFA in tissues, which are more prone to oxidation than SFA or MUFA (Frankel, Reference Frankel1998), might explain these reductions in αT content. When the source of fat was SO, the effects on αT content were attenuated, as the FA profile of tissues was less unsaturated than when LO was used. In liver, αT might be accumulated and released into circulation when the demand for αT in tissues (i.e. muscles) increases as a result of greater oxidability. This might explain why αT in meat was not significantly affected by PUFA increases (Tres et al., Reference Tres, Bou, Codony and Guardiola2008) than plasma and liver.
Content of α-tocopherol in plasma (P < 0.05) (a) and liver (b) (P = 0.080) depending on the dose of vegetable fat used to replace beef tallow in feeds and the source of n-6- or n-3-rich vegetable fat used (sunflower oil in squares, linseed oil in triangles).

Susceptibility to oxidation and oxidation levels in rabbit plasma, liver and meat
The FOX method applied in this study evaluates the susceptibility of samples to lipid oxidation. It is an induced method that assesses sample oxidability by measuring the LHP formed in the FOX reaction media over time. It has been applied to chicken and rabbit meat (Grau et al., Reference Grau, Codony, Rafecas, Barroeta and Guardiola2000a; Bou et al., Reference Bou, Codony, Baucells and Guardiola2005 and Reference Bou, Codony, Tres, Decker and Guardiola2008; Tres et al., Reference Tres, Bou, Codony and Guardiola2008), but this is the first time that it has been used on rabbit’s plasma and liver samples. Oxidation was assessed by the TBA value, which measures the content of malondialdehyde (MDA, a secondary oxidation compound) in the sample.
Both LHP and TBA values in the different samples decreased in the following order: liver, meat and plasma (Table 4), which was the same as the order for the fat content in the different tissues. Positive correlations were found between the LHP value of liver and the LHP value of meat, and between the TBA and the LHP of liver (Table 5).
Plasma TBA values were below the detection limit in all samples: 13 μg of MDA/l of plasma. This low oxidation status of plasma might be related to its high ratio αT/FA content with respect to fattier tissues, such as liver and meat.
Negative correlations were found between the αT content of plasma and the LHP value in liver and meat, as well as between plasma αT content and meat TBA value (Table 5). Therefore, plasma αT content was a good indicator of meat oxidation and of the susceptibility to oxidation of liver and meat, thus supporting the antioxidant effect of αT against oxidation.
The dietary supplementation with TA (100 mg/kg) did not significantly modify liver oxidation levels (TBA values) or their susceptibility to oxidation (LHP values) although it tended to be reduced (Table 4), due to the protection effect of the increased αT content against induced oxidation. In meat, this effect was significant (Tres et al., Reference Tres, Bou, Codony and Guardiola2008). Reductions in meat, liver and plasma oxidation and oxidability as a result of TA supplementation have been previously reported in rabbit (Castellini et al., Reference Castellini, Dal Bosco and Bernardini2001; Oriani et al., Reference Oriani, Corino, Pastorelli, Pantaleo, Ritieni and Salvatori2001; Dal Bosco et al., Reference Dal Bosco, Castellini, Bianchi and Mugnai2004; Zsedely et al., Reference Zsedely, Toth, Eiben, Virag, Fabian and Schmidt2008) and other animals (Monahan et al., Reference Monahan, Buckley, Gray, Morrissey, Asghar, Hanrahan and Lynch1990; Grau et al., Reference Grau, Guardiola, Grimpa, Barroeta and Codony2001; Bou et al., Reference Bou, Guardiola, Tres, Barroeta and Codony2004; Russell et al., Reference Russell, Lynch, O’Sullivan and Kerry2004).
Plasma and liver susceptibility to oxidation, measured by means of the FOX induced method, was altered by the dose of vegetable fat used to replace BT in feeds (in plasma it was significant when the least-squares means were separated by the Duncan’s test, however, the Scheffé’s test did not give significant differences) (Table 4). The same tendency was observed for liver TBA value (Table 4). The higher oxidation and lower oxidative stability of tissues as a result of increasing the dose of vegetable fat in feeds could be attributed to the increase in their PUFA content, which are more prone to oxidize than SFA and MUFA (Frankel, Reference Frankel1998). This may have led to lower αT contents in the studied tissues (as discussed above) (Table 4). Whether this vegetable fat was SO or LO did not affect LHP or TBA values of plasma and liver, although the addition of LO reduced their αT contents (Table 4). In meat however, LO increased TBA values (Tres et al., Reference Tres, Bou, Codony and Guardiola2008). Therefore, although the increase in PUFA in tissues may be interesting from a nutritional point of view, and in the prevention of some chronic diseases (Kinsella et al., Reference Kinsella, Lokesh and Stone1990; Simopoulos, Reference Simopoulos1997; Siddiqui et al., Reference Siddiqui, Harvey and Zaloga2008), it might cause a reduction in αT content and an increase in tissue oxidability that should be avoided, due to the negative biological effects that have been described for various oxidation compounds (Guardiola et al., Reference Guardiola, Dutta, Codony and Savage2002; Niki et al., Reference Niki, Yoshida, Saito and Noguchi2005; Spiteller, Reference Spiteller2006).
Rabbit producers should take this into account, because the αT content usually found in basal diets might not be enough for preventing oxidation in rabbit tissues, especially when unsaturated fats are added to feeds. The assessment of rabbit plasma αT content might be indicative of tissue oxidability. Apart from the in vivo effects of oxidation in tissues, oxidation might be developed post mortem. Oxidation in tissues increases as a result of pre-slaughter stress, slaughtering techniques, post-mortem pH, carcass temperature, disruption of cell membranes, as well as during processing and storage, which might reduce their nutritional and sensory quality due to the loss of PUFA and αT, and the formation of secondary oxidation compounds presenting unpleasant flavors (Gray et al., Reference Gray, Gomaa and Buckley1996; Erickson, Reference Erickson2007).
In another part of this study (Tres et al., Reference Tres, Bou, Codony and Guardiola2008), cooking of meat and the refrigerated storage of cooked meat, reduced its αT content and increased its oxidation, reaching the lowest αT content and the highest increase in oxidation when 3% LO diets had not been supplemented with TA (Tres et al., Reference Tres, Bou, Codony and Guardiola2008). Dietary supplementation with 100 mg TA/kg on 3% LO diets, or the addition of 1.5% (wt/wt) LO with or without TA supplementation, diminished this oxidation (Tres et al., Reference Tres, Bou, Codony and Guardiola2008).
In summary, the dose of n-6- or n-3-rich vegetable fats and dietary supplementation with TA (100 mg/kg) modified the FA composition, the αT content, and the oxidative stability of rabbit plasma, liver and meat. The FA composition was modified by the accumulation of FA absorbed from the diet, and by changes in some metabolic pathways due to the dietary treatments. As BT was replaced in feeds with increasing doses of LO (n-3-rich vegetable fat source), the ratio n-6/n-3 was more favored from a nutritional point of view. The n-6/n-3 ratio was decreased due to absorption of linolenic acid from the diet, which led to higher long-chain n-3 FA biosynthesis. However, this increase in plasma, liver and meat unsaturation increased their susceptibility to oxidation, which was prevented by dietary supplementation with TA (100 mg/kg). Therefore, the combination of 1.5% (wt/wt) LO plus 1.5% (wt/wt) BT, and 100 mg of TA/kg of feed is the best diet out of those studied, as it provides a healthier n-6/n-3 ratio in tissues and good protection against oxidation. Furthermore, as significant negative correlations have been encountered between αT content in plasma and the oxidative stability of tissues, plasma αT determination could be useful in the assessment of the αT status and the oxidability of rabbit tissues beforehand.
Acknowledgements
This work was funded by the Spanish Ministry of Science and Education (MEC) (Research project AGL2003-06559-C02-01 and a Ph.D. grant (FPU) to A. Tres) and by a research grant from Instituto Danone to A. Tres. The authors thank the Department of Animal Science of the Polytechnic University of Valencia for preparing diets, housing animals, and providing slaughtering facilities. They are also grateful to E. Carmona and L. Bourgain for their help in the analyses.