


Data Collection in Glaciology
Understanding the past is essential for modeling future climate development and environmental changes. The amount of analytical and measured data in any field of climate research, as proxy data for models, has reached a level where mechanisms to manage this important resource effectively have to be found. For the final interpretation of comprehensive datasets, there are paramount requirements to find a specific dataset quickly, to determine its relevance and to evaluate it in comparison with other data at regional to global scales.
Data relating to previous environmental conditions are available from instrumental records, historical documents and from various natural paleoclimatic archives. Continental ice, marine, lacustrine and terrestrial sediments, cave speleothems, tree rings and corals extend the baseline of human environmental and climatic observations far back into the geological past and provide records of time-spans ranging from years to millions of years, and resolutions ranging from months to thousands of years.
The fossil data libraries are our best means of determining flow the climatic system operated under boundary conditions substantially different from today. Since the invention of ice coring using conventional drilling techniques, ice cores have been recovered from the Greenland and the Antarctic ice sheets as well as from many glaciers. The last decade of glaciological research, especially, has clearly shown that this paleoclimatic archive contains a wealth of information about two important parts of the climatic system: the atmosphere and the cryosphcrc; with high-resolution records covering up to 400 000 years of the Earth's history.
Samples taken from ice cores are analyzed to reconstruct paleoclimatic and paleoglaciological conditions for different analytical parameters: e.g. the ice sheets, as the major archive of fossil atmosphere, allow reconstruction of the concentration of greenhouse gases during a glacial/interglacial cycle, as documented by the Vostok and GRIΡ ice cores (GRIP, 1993; Reference Barnola, Raynaud, Korotkevich and LoriusBarnola and others, 1987); significant variations of ice texture and fabric are also related to climatic parameters (Thorstcinsson, 1996). Further observations and measurements are important in modeling the behavior of the Greenland and Antarctic ice sheets during a climatic cycle (Reference HuybrechtsHuybrechts, 1992). With the introduction of new and more efficient analytical methods during the last decade, the number of parameters, as well as the amount of data obtained, has increased by an order of magnitude.
There is a considerable number of so-called “information systems” that still use standard file systems to maintain large datasets. Although these datasets are physically accessible from a technical point of view, the logical availability of the data is rapidly degrading due to a lack of structural knowledge about the data and a lack of information describing the data (metadata). The emergence of an integrated Earth-systems science calls for a much fuller knowledge of the past, in both space and time, and for datasets that are composites of different methods and techniques.
The Initiative for a Paleo-Information System
The only way to obtain a useful system for integrated interpretation of collected datasets is to store all data in a consistent formal and make them easily accessible. Tools for retrieving the dala and for their visualization have to be closely linked to the collection. This collection, as a network between working groups, can then be used as a data source as well as a common interpretation tool. in the future, it could be used as a publishing and reference system for data related to new publications, to ensure that all the relevant data are stored in the same system. The concept of dataset publishing might also motivate individual scientists to contribute their data to a common system, including full metadata documentation (personal communication from Callahan and others, 1996; http://www.computer.org/conferen/mcta96/callahan/callahan.html).
In 1993, scientists from various German institutes working on paleoclimate initialed a project responding to the needs described above. The goal was an information system capable of giving an overview of the sampling material available, storing paleoclimatic data of any kind in a consistent form, providing all metadata necessary for understanding the data and making these data easily accessible to the scientific community. Tools for import/export, graphical presentation and complex retrievals had to be related closely to the data collection. Based on the discussion and recommendations of this group, the PANGAEA (PaleoNetwork for Geological and Environmental Data) information system was developed at the Alfred Wegener Institute for Polar and Marine Research (AWI). The first sub-system was operational from 1996-98 and was used for data from the marine environment.
System Description
The most important generic aspects of PANGAEA are the quality and availability of the data as well as the high adaptability and effective use of the system. Data quality can be described in terms of the validity of methods and the precision and objectivity of the measurements. While it is not essential only to have excellent quality datasets, it is important that the quality can be estimated. The completeness of the metadata, including the analytical method and the reference to where the data were first published, is crucial in understanding the analytical data. The user of a specific dataset must be able to verify it by reading the reference and thus assess its quality and usefulness.
The manual quality check is supplemented by an evolving system of generic and parameter-specific validation routines. These routines are based on the definition of analytical methods and parameters, which requires a given standard unit, possible minimum and maximum values and the possible precision of the data. This information is used by validation routines during the import to filter out suspect values, e.g. outliers.
To improve the data consistency, datasets can be stored at different processing levels. Τhe primary data, e.g. counts or weights, are the raw data for calculations and interpretation. Archiving the raw data allows future recalibration or new interpretation of the datasets. The secondary data are values calculated from the raw data; in many cases percentages or other units of concentration. The secondary data will usually be proxy data for evaluating parameters describing past environmental conditions. Parameters evaluated from the secondary data (e.g. paleotcmperatures) are defined as tertiary data. With the definition of a tertiary-parameter obtained from the proxy data, a method and reference can be given as to where the formula or method is published.
When dealing with publishing and archiving data, copyright has to be considered (Diepenbroek and Reinke, 1995). If an information system stores unpublished data, it is crucial for the acceptance and the trust of the database that
The PANGAEA data model follows a path from the collection of samples to the final analytical or (paleo) environmental data. Within a PROJECT, different CAMPAIGNS are carried out to drill cores, collect samples or measure environmental parameters at distinct SITEs through different OPERATIONS to obtain DATA. The model is universal and can be used for any scientific data which are time dependent and/or related to a geographical site.

the data are protected by a hierarchical system which can be organized and controlled by the user. The owner of a specific dataset is the “principal investigator”, who must be able to give copyright to individual users/groups or to open data-sets across the whole system. When using foreign data, a reference must be cited recognizing the data producers. For unpublished data, the principal investigator has to be asked for permission to use the data.
The Data Model
The great variety of parameters, methods, calibrations and interpretations used in paleoenvironmental reconstruction, as well as the modification of established methods, are major obstacles to the integrative use of datasets in a common system. The chai lengc of managing these heterogeneous and dynamic data was met in PANGAEA through a highly flexible data model consisting of a relational data structure combined with middle-ware server software and user-friendly client software. PANGAEA is designed to manage site-oriented datasets of small or medium size. It should not be used to handle large datasets, e.g. from modeling results, remote sensing, geophysical profiles or bathymetry.
The simplified data structure of PANGAEA is shown as a figure on the opening screen of the client software (Fig. 1).The graphic allows users to enter all levels, tables and tools by selecting the required field. The structure reflects the standard processing steps for paleodata. Lists, including standardized metadata, are connected to the main data fields (e.g. gear (samplers and equipment), method). Different institutes/projects (PROJECT) working in the field of glaciology, for example, carry out expeditions (CAMPAIGN) forcoring or sampling. During a campaign at a number of locations (STATION) different samples may be taken or measure-
The PANGAEA DATA level provides users with analytical data from a specific site in combination with all related metadata necessary for understanding those data (a, parameter with unit; b, method; c, principal investigator (PI); and d, reference). The “doubleface” button enables the PI to define access rights, if data are not published. The data (e) can be plotted by calling one of the visualization tools (f) or be exported as textfiles (g).

ments made (SITE). At distinct points/intervals the medium to be investigated (e.g. ice, sediment, water) is sub-sampled or measured for different requirements. Information about the sampling procedure is stored at the CURATOR level. Down to this level, all data are considered to be metadata. From each sample, one or more analytical data points will be produced which can be found at the DATA level, with the related metadata (Fig. 2). From this field, data can be exported as a table or plotted graphically. Τ he parameters are gathered into parameter groups for a better overview and data are grouped as primary, secondary and tertiary data as described above. Data types can be numerical, textual or images. The combination of the DATA, “parameter” and “method” fields is the essential part of the model, allowing the definition and storage of new, unique parameters by the user at any time. The middle-ware allows the user to retrieve complex data matrices, e.g. time slices.
The available metadata comprise related information about expeditions, sampling sites/sets and storage facilities. in addition to the sampling/investigation site label, the most important metadata are the location (latitude/longitude) and the elevation. For archiving profiles, the definition of two locations/elevations, including the date/time, is allowed. All scientists and institutes related to the data in the system are stored with their full addresses. Other related items, such as the name of the gear, sample types or parameters, are defined in lists which are regularly updated, analytical methods can be defined with all the necessary information, references, for cruise reports or published data, can be typed in or imported from professional bibliographical software.
Network, Hardware, and Software
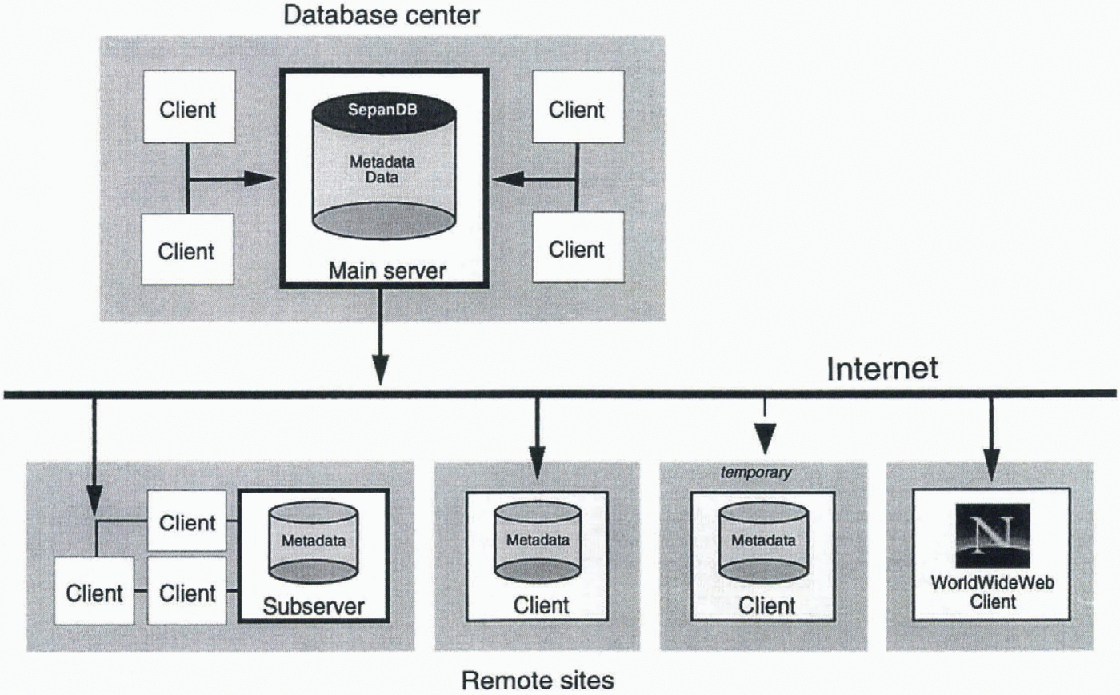
Pangaea uses client/server technology through local networks and the Internet to communicate between working groups (Fig. 3). The main server, located in the computer center of the AWI, is connected through the Internet with sub-servers at various external institutes (remote sites).The clients, which are the personal computers of the scientists involved, are connected through the Intranet to the sub-server of their related institute. To increase the speed of access, all metadata are mirrored on each local sub-server. The mutual update of newly imported metadata is made in the background through the network. Clients may also connect directly to the main server. in this case the metadata lile is mirrored on the client.
In the future, the system will supply read only access for metadata and published analytical data via the World Wide Web (WWW). The homepage of the system (http://www.pangaea.de; available in 1998) will provide information about the system with user manuals/tutorials; enable the user to download visualization software; give an introduction and links to the projects managed by PANGAEA;
The network concept of PANGAEA uses client/server technology through the Intranet/Internet to communicate between institutes. A remote site can be a group of clients using a sub-server where all metadata are mirrored or a single client directly connected with the main server. Any client will have access to the full functionality of the system. For retrieving published data, a WWW interface is provided (www.pangaea.de).
and provide a Java applet with retrieval functionality to extract and download data.
The main server is a DEC Alpha 8200 (four processors, 2 GB internal memory, 50 GB hard disk capacity) running SYBASE Version 11 under DEC/UNIX as the database management software. The client software for access to the server was written in 4th Dimension (4D, ACI); the WWW-client software is written in JAVA. 4D provides tools for the design of a graphical user interface and allows optional compilation of the front-end software code for the different operating systems found in personal computers (MacOS, Windows).
The client software was modularized into a database front-end together with tools developed individually for processing specific datasets. The modularization and the open environment facilitate the future adaptation of the system. The entry requirements for handling the software are low because the functionality is uniform for all tables and tools. Updates of the 4D front-end software only have to be made on the sub-servers, so the PCs are not affected by update procedures.
The system requirements for running PANGAEA are an Internet connection and a fast Macintosh or Windows computer with at least 80 MB of RAM, for storing the mirrored metadata. For sub-server systems, additional licenses for the 4D-server software are needed depending on the number of clients.
Pangaea Tools
The import of metadata is organized through predefined form tables for references, cruises, stations/sites and curatorial information. Analytical data are imported via text files with the name, or the PANGAEA-ID, of a specific parameter in the header. Metadata related to the data (method, owner, comments) have to be defined before the import and are also updated during the import procedure.
The retrieval tool for finding and extracting data from the system is designed uniformly for all levels and allows the use of complex, combinable, search criteria relevant to the desired data. Data can be exported as tables or plotted with one of the graphics tools. Tables can be sorted and configured individually. Multiple datasets can be displayed with identical parameters and locations in one column, or the data can be split by datasets and located in separate columns, thus allowing the comparison of datasets from different investigators or multiple versions of a single dataset.
PanMap was developed for geographical presentation; this is either connected directly to the database front-end or used as a stand-alone application (Fig. 4). PanMap can be called directly by the user to draw sampling sites in a geographical context after selecting the required dataset using the retrieval tool. Sites can be labeled with metadata as well as analytical data. Maps can be configured with different projections, the styles of map elements can be changed, additional vector data or site information can be imported and maps exported. The General Bathymetrie Chart of the Oceans (GEBCO; IOC, 1994) can be used as the data source for ocean maps, special files are provided for drawing elevation lines for Greenland and for the Antarctic.
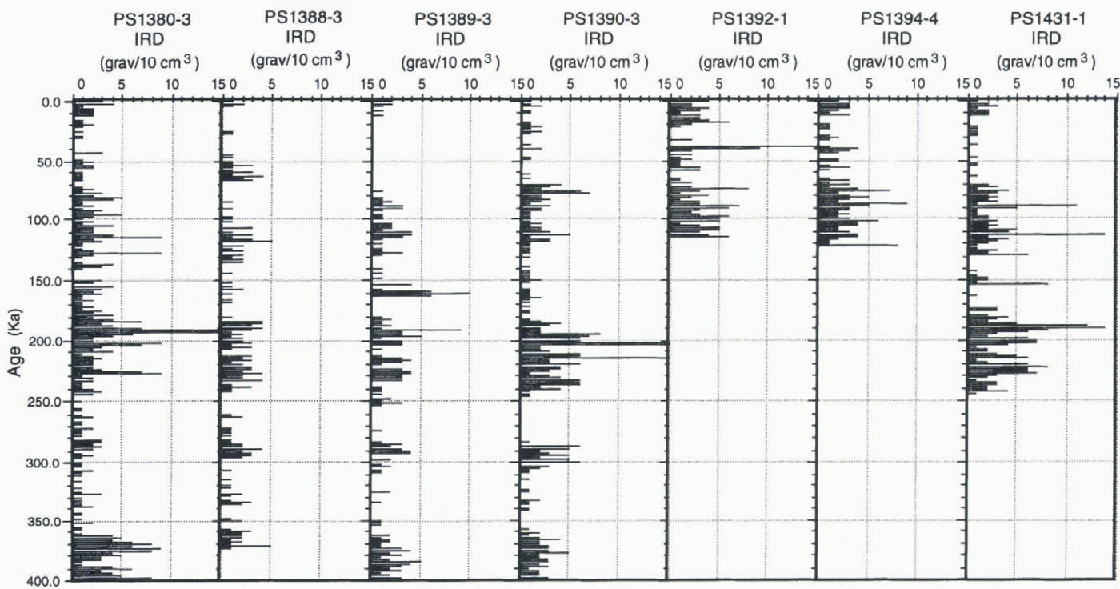
PanPlot has a similar link to the database as PanMap and allows the user to plot data vs depth/altitude or time
For map presentation of data, the PanMap tool is connected to the database front-end directly or used as a standalone application. PanMap can be called by PANGAEA to draw sampling sites labeled with metadata or analytical data. The sample map shows core locations in Greenland with some labeled sites. The contour tines are calculated from digital elevation data (Reference EkholmEkholm, 1996) and ocean bathymetry is provided by GEBCO (IOC, 1994).

(Fig. 5). Scales and graphic features can be modified by the user and distinct parameters can be selected from the data matrix, which has to be retrieved before the transfer. Pan-Plot graphs can be exported in platform-specific interchange formats.
A problem when importing metadata is the inconsistency in site labels and the different formats used when reporting positions. A PANGAEA toolbox routine allows the conversion of any latitude/longitude format to that used by PANGAEA. After conversion of the position, the new sites can be compared with the contents of the database to determine if duplicates exist or find alias labels. Another tool, including statistical routines (PanStat), can also be used in close combination with data in the information system.
Conclusions
The PANGAEA data model is universal in that it can collect different site- or time-oriented data of a specific scientific field and store them in a consistent format. Access to published data is enabled via an Internet browser and via specific clients with high functionality. The PANGAEA structure and data model provide comprehensive retrievals for specific requirements. PANGAEA combines information about sampling with the resulting analytical data and allows the access and export of all combinations of metadata, analytical or measured data and their references. Exported data can be transferred into visualization tools or into spreadsheet software.
PanPlot enables the user to plot analytical data vs time or depth/altitude. It is stand-alone software but can be called by the database after a set of data is retrieved. Scales and graphic features can be modified individually and distinct parameters selected from the data matrix. The sample plot shows ice-rafted debris in sediment cores from the Antarctic continental margin. The data cover the last two climatic cycles and are plotted vs time (Grobe and Mackensen, 1992).
Acknowledgements
This paper was improved by L. Belbin's review. The development and implementation of the system was financed by the German Ministry of Education, Science, Research and Technology (BMBF), Fund No: 03F0131B (Paläoklima-Daten-zentrum). Detailed information about PANGAEA can be obtained on request through “info@pangaea.de". PanPlot and PanMap are available from the PANGAEA web site as well. Access to the system will be provided in 1998 through the PANGAEA homepage (http://www.pangaea.de).This is publication No. 1349 of the Alfred Wegener Institute for Polar and Marine Research.



