

1. Introduction
Understanding language and the production and perception of speech have been important goals of linguistic research from the beginning. The ability to synthesize speech artificially in various ways has been an essential tool for many research programs directed at this goal. Linguists, phoneticians, psychologists, and communications engineers have been primarily involved. However, Taylor (Reference Taylor2009: 534), in his epic book, suggests that engineers have found linguistic theories to be of little help in implementing real systems. In support of this view he quotes Fred Jelinek: “whenever I fire a linguist our system performance improves.” The reason for this sad state of affairs, he says, lies in the inattention to experimental linguistics, where “traditional scientific methods of experimentation are rigorously used [to elucidate the nature of language and speech]” and further suggests that although “the focus of this field is often on different issues, we do find that many studies are conducted in just the areas that would be of benefit in speech synthesis. So why, then, are these studies ignored?” The difficulty, he maintains, lies in the combinatorial explosion involved in the many factors that make up speech. I might go further and suggest that the engineers have not, for a variety of reasons, provided all the desirable tools for such linguistic experimentation. Attention has focussed on military and financial benefit, specifically vocoders (for both secrecy and bandwidth compression); and on the removal of redundancy (again for bandwidth compression in connection with lowering the cost of communication and storage). Other motivation was provided by the needs of blind veterans. Such work has led directly to our current knowledge. Experimental work, though often not the rigorous kind Taylor refers to, began a long time ago. As Taylor says, making machines talk is also most enjoyable and instructive (Taylor Reference Taylor2009: 539). His book provides a comprehensive and up-to-date description of text-to-speech (TTS) systems, and it is pointless to repeat his excellent account, though some important comments appear below.Footnote 2
This paper, then, has three themes. It summarizes some history of the work leading to our current state of knowledge and puts it in context; it describes and discusses the authors’ experimental, complete TTS system based on articulatory controls,Footnote 3 as a test of Carré’s Distinctive Region Model (DRM) of articulation, and it provides references to relevant experimental linguistic work in support of the project carried out in the author's laboratory as well as elsewhere. Space limitations preclude a thesis-style treatment, but there are plenty of signposts for readers wishing to dig deeper.
As long ago as 1779 Kratzenstein (Reference Kratzenstein1782) demonstrated an acousto-mechanical apparatus to the Imperial Academy of St. Petersburg, winning a prize. His machine was limited to the production of vowels. A few years later, a contemporary of his, von Kempelen (Reference von Kempelen1791), demonstrated a more comprehensive machine that was able to attempt all speech sounds (Flanagan Reference Flanagan1972: 205). Some of the earliest electronic synthesizers included the Vocoder (Dudley Reference Dudley1939), designed as part of a low-bandwidth telephone system, and subsequently also used as the basis of a secure communication system; and Franklin Cooper, who developed Pattern Playback (Cooper et al. Reference Cooper, Liberman, Borst and Gerstman1952) at the Haskins Laboratories in New York. The Haskins Laboratory work was sparked by the US Office of Scientific Research and Development requirement in the 1940s to develop and evaluate assistive technologies for WWII veterans who had been blinded, but the work provided the foundation for understanding speech structure for the linguistics/speech-research community for decades to come, right up to the present. PAT, the Parametric Artificial Talker formant synthesizer, was invented by Walter Lawrence (Reference Lawrence and Jackson1953) at the Signals Research and Development Establishment in England in the early 1950s. Contemporary with Lawrence, Fant (Reference Fant1962) developed rather similar machines, the OVE II, at the Speech Technology Laboratory of the Kungliga Tekniska Högskolan (Royal Institute of Technology, or KTH), in Sweden; and John Holmes and colleagues at the British Post Office Joint Speech Research Unit at Dollis Hill in the UK developed a computer-controlled parallel version (Holmes et al. Reference Holmes, Mattingly and Shearme1965). Such formant synthesizers produce speech by mimicking the movements of the vocal tract resonances (formants in the spectrographic domain) using variable filters, as opposed to emulating the vocal tract and its naturally constrained resonances.Footnote 4
The ability to use what was learned as a basis for communication between people and machines took off with the advent of the computer, which allowed arbitrary utterances to be synthesized based on a knowledge of the relation between synthesizer parameters, acoustic cues, and speech perception, discovered by researchers such as those at the Haskins Laboratories.
The first complete speech-synthesis-by-rules system using a computer was created by Holmes et al. at the JSRU in Britain using a formant synthesizer that, like the Haskins experiments, was still essentially operating in the acoustic domain. The desirable alternative of synthesising speech based on a low-level articulatory model of the human vocal apparatus Footnote 5 presented a number of problems that even now are not completely solved.
For the authors of this paper, the motivation for speech synthesis has been to seek a better understanding of the speech production process at the articulatory level – both natural and machine speech production, recognizing the need to have a better model of speech for purposes of automatic speech recognition, language learning, linguistics, phonetic teaching, and speech therapy, among other activities. Much recent work on speech synthesis, with honourable exceptions (for example, see section 3.1.) has focussed on efficient engineering approaches to reproducing speech sounds for purposes of voice response, rather than on serious advances in understanding speech structure. The concatenated segment synthesis approach (so-called Unit Selection), currently in almost universal use for interactive computer voice output, is in essence a sophisticated form of recording that comes with problems of its own. Any understanding of speech production processes involved, per se, is minimal (Taylor Reference Taylor2009: Chapter 16).
This article describes an approach to speech synthesis by machine that is based on articulatory events, including: (1) an articulatory-level vocal tract model; (2) a solution to the tract control problem; (3) mapping from the phonetically useful (but perceptually questionable) segmental analysis to specify a parallel stream of desynchronised articulatory events; (4) specifying rhythm and intonation models; and (5) creating the databases needed to drive the system to produce English speech – a necessary requirement for testing the validity of the structural modelling. The work has involved a wide repertoire of techniques, data, and research by many labs over six decades. The approach produces good quality speech in real time, justifying the view that it is a valid model of speech production at the articulatory level. In the course of the exposition, we revisit a variety of areas of instrumental phonetics. Sound files provide samples of the speech produced. What may seem most remarkable is that an articulatory model that depends on continuous manipulation of just eight vocal tract regions produces good quality speech. It is less remarkable once it is realised that the regions are responsible for the independent movement of the speech resonances important to speech intelligibility, and also correspond to major anatomical features of the human vocal tract.
2. Background
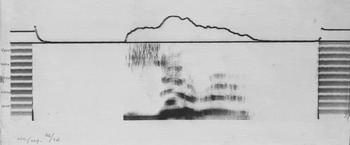
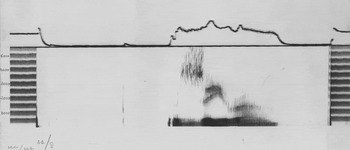
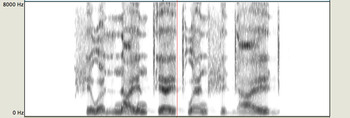
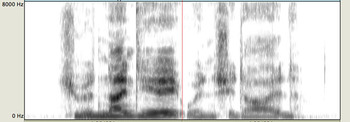
Techniques of spectral (acoustic) reconstruction have dominated the practice of speech synthesis by machine for more than 60 years, based on the early success of the Vocoder (Dudley Reference Dudley1939), the Voder (Dudley et al. Reference Dudley, Riesz and Watkins1939) and the sound spectrograph (Koenig et al. Reference Koenig, Dunn and Lacy1946), all of which represented speech as a frequency spectrum varying with time – a pixel-like representation of speech, analogous to pixel images of faces. The Voder, demonstrated at the New York World's Fair in 1939, and at the San Francisco World's Fair in 1940, could be manipulated by trained operators to produce human-sounding speech. The sound spectrograph was hailed as a way of allowing deaf persons to see speech instead of hearing it, because the movements of the vocal tract resonances and the occurrence of noises were usually clearly visible in the spectrograms that were generated, as seen in Figures 1 and 2. Problems of both speech recognition and speech synthesis by machine were therefore thought to be close to being solved. That they were not solved soon after this was a big disappointment!
Historic Kay Sonagraph spectrographic representation of “zero”, speaker 1

Historic Kay Sonagraph spectrographic representation of “zero”, speaker 2

The preferred approach to computer speech synthesis was for a long time the provision of some kind of filtering, either to match the time-varying spectral output of the vocal tract directly (pixel by pixel), or to match the main resonances (formants 1, 2, and 3) and then to manipulate these to create the formant tracks observed in real speech – the dark bars seen in spectrograms. The former is exemplified by the early Haskins approach, using PBII to reproduce speech from hand-painted spectrograms directly. The second was achieved using data tables that associated particular resonance configurations with particular speech sounds, together with simple transition rules for combining these configurations into a continuum, to drive formant filters corresponding to formants 1, 2, and 3, perhaps with formant 4, as well as various noise sources, and supplying suitable excitation. As noted, these were called resonance or formant synthesizers (Lawrence Reference Lawrence and Jackson1953, Holmes et al. Reference Holmes, Mattingly and Shearme1965, Allen et al. Reference Allen, Hunnicutt and Klatt1987). This approach is, of course, compatible with the dominant approach to analysing speech signals into phone/phoneme segments based on spectrograms. Spectrographic analysis places boundaries of the segments at the edges of regions in the spectrogram that are related to constrictions formed in the vocal tract due to the articulation of contoids (roughly speaking, consonants). These are usually fairly visible. The analysis then assigns the regions between such boundaries to vocoids (sounds produced in a relatively open vocal tract, usually identified as vowels). However, the first problem that this raises is that the cues for contoid identification are actually carried, at least in part, by the transitional regions that get assigned to the vocoid segments and can affect the perceived duration of the contoid. For stop sounds such as /b, k/ these transitions are major cues, pointing to loci that characterize the place of articulation during the stop closure (Delattre et al. Reference Delattre, Liberman and Cooper1955; Delattre Reference Delattre1969). This means that the durations assigned to either vocoids or contoids are arbitrary. Early work used to refer to “the building blocks of speech”, or “invariant properties of speech sounds” – concepts that are readily seen to be dubious by comparing the utterance of the word ‘zero’ in Figure 2 by speaker 2 with the same word in Figure 1 by speaker 1, especially for the /r/ sound.
To the human eye, there are obvious similarities, but also obvious differences. For example, the two fricative noise portions associated with the /z/ differ, with a noticeable peak for speaker 2; the transitions from the constriction for /z/ sound to the vowel /i/, from there to the constriction for the /r/ sound, and thence to the diphthong /ʌʊ/ are recognisably similar to the human eye, but significantly different in detail for both timing and trajectory. Additionally, the speech intensity on the top trace follows a rather different course. These observations are neither new nor surprising to those involved in speech analysis. The point is that in order to recognise or synthesize speech by machine, it is not reasonable to suppose there are templates of some sort in the energy-frequency-time domain that can be matched for recognition or reproduced for synthesis. The idea of building blocks was in fact discarded many years ago, yet the echoes continue – the spectrographic/template description of speech has continued to affect thinking, at least amongst those concerned with machine recognition and synthesis of speech. Statistical state-transition networks known as Hidden Markov Models (HMMs) are used as a more sophisticated approach (Yamagishi et al. Reference Yamagishi, Richmond and King2007, Taylor Reference Taylor2009: Chapter 15). Speech is divided into short spectral slices (typically 10 milliseconds long), and HMMs are used to make statistical decisions based on the state-transition probabilities to determine which output slice should next be produced to create a required utterance (or what speech slices were spoken – for recognition). The advantages and defects of these processes are outside the scope of this article.
Linear Predictive Coding (LPC) (Taylor Reference Taylor2009: 357), is often used for spectral description and processing these days, but, regardless of the precise analysis mechanisms involved in either recognition or synthesis, a spectral approach, which is purely descriptive, lacks explanatory power in the same way that the Ptolemaic description of the solar system with its complex epicycles lacks explanatory power. Articulation explains speech rather like the way that gravitation explains the movements of the heavenly bodies in the solar system. Articulation is the basis for phonetic identification of speech sounds, and articulatory gestures are not synchronised at traditional phonetic boundaries.
Describing speech in terms of phones (or phonemes) is convenient for phonetics, and for relating the speech to orthography and language, but the boundaries between phones assigned in the spectrographic representation are just that – convenient and useful perceptual fictions that are agreed to by convention. The dynamic aspects of neighbouring sounds interpenetrate. If a boundary must be invoked, it would be most useful and justifiable at the centre of phone segments, creating diphones or n-phones. This is very much what is done in the current dominant approach to speech synthesis – unit selection or concatenative synthesis – but the boundaries are still arbitrary and not necessarily spectrally exact, though they are more justifiable in the sense of fitting different spectral segments together and reducing (but not eliminating) neighbouring effects. Unit selection is based on recorded speech segments that are usually longer than the phonetic elements of conventional analysis, starting at the diphone level, but employing even words and phrases. The size of the databases can become very large, involving significant problems of labelling and selection, and the process still may use less than satisfactory segments – increasing problems as new speakers or varied emotional states are used for synthesis (for example, Taylor Reference Taylor2009: 531). Additionally, the reassembly of the segments requires processing of the retrieved data to blend items for joining, and to impose suitably aligned rhythm and intonation patterns, which is possible with LPC speech representation, though that process is subject to its own problems.
Linguistics, as well as related disciplines and applications, should benefit if articulatory descriptions – the real phonetic building blocks rather than spectral descriptions – can be used as the basis for their experimental investigations, because there will be a much closer relation between what is controlled or recognised and the speech sounds involved. The work would reflect the true basis of speech – the equivalent of understanding the role of gravity rather than relying on the artificial, fictional epicycles of the Ptolemaic model to describe and understand the solar system. This is an important part of the motivation for this ongoing work on an articulatory approach to speech synthesis. The objective is to gain important new knowledge, not simply to improve the voice response industry, though that should happen too, as understanding increases, allowing TTS control and variations to become more natural.
3. A method for real-time articulatory synthesis
There are some obvious challenges to a researcher wishing to carry out speech research based on articulatory descriptions – the area is still new. However, progress has been made. We confine our attention here to a particular research project for achieving articulatory speech synthesis by machine. The current low-level articulatory speech synthesizer and associated databases form the basis of a complete, unrestricted text-to-speech system for English. It also provides facilities for creating similar systems for languages other than English, as well as a tool for experimental linguistics. We first take a brief look at the basis for low-level articulatory speech synthesis.
3.1 Vocal tract simulation as a basis for articulatory synthesis
The advent of faster computers has allowed the implementation of vocal tract simulations – waveguides or transmission lines – that can be controlled very flexibly in real time. This advance has been coupled with a better understanding of the resonant properties of the human vocal and nasal tracts as a result of long-standing research, particularly at the Speech Technology Laboratory (KTH) in Stockholm under the direction of Gunnar Fant. His doctoral thesis in the area appeared as a book (Fant Reference Fant1960).Footnote 6 Waveguide models are also called tube models because they represent an acoustic tube of varying radius that can be excited by a suitable energy input. The shortest length of tube that can be simulated depends on what speed the computer's CPU can achieve, because shorter tube sections require higher computing speeds.
Articulatory synthesis has always been of interest, but the recent surge of interest in the topic, as well as in the use of such equipment for linguistic research – for example, Praat at the University of Amsterdam (Boersma Reference Boersma2001, Boersma and van Heuven Reference Boersma and van Heuvenn.d., van Lieshout Reference van Lieshout2003) – has been dramatic. Though Praat will produce synthetic speech, it is specifically noted as not being a text-to-speech system.Footnote 7
An interesting articulatory speech project is in progress at the University of British Columbia (van den Doel et al. Reference van den Doel, Vogt, English and Fels2006, Fels et al. Reference Fels, Vogt, van den Doel, Lloyd, Stavness and Vatikiotis-Bateson2006) – a very detailed anatomical model and related acoustic model, complete with muscles, that has produced two vowel sounds. On their current (2016) website they state: “We have created an integrated biomechanical model of the jaw, tongue, and hyoid complex to study chewing, swallowing, and speech production, and help in the design and planning of medical treatments for the oro-facial region.” The model is based on Computer Tomography data from a single subject, and is combined with a previously created jaw and hyoid model which provides muscle structure, as well as with a previously created tongue model. The researchers are currently integrating these components with a facial model of the same subject. Obviously there are serious challenges for those who would use such a model for unrestricted speech synthesis. Since dynamic control of the anatomical model is computing-intensive, the time needed to make it produce speech is inordinately long, so a separate model is used in parallel to produce speech, if speech is also required.
The work by Birkholz (Reference Birkholz2013) on another physiological model is also very interesting. He has a working physiological analog that has produced recordings combining seven consonants with eight vowels in syllables, as well as a sentence, for German speech. He used 3-D MRI tract data as a basis for defining vocal tract shapes. In a formal 20-listener experiment, vowel recognition was comparable to natural vowels (95.4% versus 96%). Consonant recognition varied between 65.7% and 100% with a mean of 82.4% compared to 98% for the same natural consonants. He comments at the start of his abstract that “[a] central challenge for articulatory speech synthesis is the simulation of realistic articulatory movements, which is critical for the generation of highly natural and intelligible speech. This includes modeling coarticulation, the context-dependent variation of the articulatory and acoustic realization of phonemes, especially of consonants.”
In the present authors’ system, there are explicit graphs that specify these movements – graphs that may be created, edited, and deleted as needed, but which provide a record of the movements found necessary – equivalent to the articulatory gestures necessary in Birkholz's physiological analog approach.
A project closer to our articulatory synthesis project is TubeTalker by Brad Story and his colleagues, currently at the University of Arizona. The focus of his work has been a wave-reflection representation of the vocal tract and the use of three-dimensional imaging to obtain the varying area data needed to control the tube (Story Reference Story2005). Similarly to our tube model, Story's tube model includes yielding walls and radiation from them as well as frequency-dependent losses and side-branch resonators, with detailed control of the vocal tract shape and waveform output. Control of the tube is, however, very different, since the aim of the work has been to simulate real speech sounds based on measured data from subjects that is reproduced in the configuration of the tube. There are 44 tubelets for which areas have to be provided. The quality of the output for the sounds/phrases chosen is excellent (e.g., Story and Bunton Reference Story and Bunton2011; Story Reference Story2013), but they have no stated plans for incorporating their tube resonator in a text-to-speech system (however, see section 5 for our project development possibilities).
3.2 The Tube Resonance Model (TRM) of the human vocal tract
The simple acoustic tube model – the Tube Resonance Model (TRM) – in our work drew important inspiration from the work on articulatory synthesis of the singing voice by Perry Cook at the Stanford Center for Computer Research on Music and Acoustics (Cook Reference Cook1990).
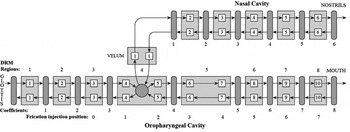
The TRM is a waveguide model of the human vocal tract and nasal passage, implemented as a computer program. The original version ran in real time on the NeXT computer DSP coprocessor, with a second version – written in “C” – that can run on any computer.Footnote 8 The TRM directly emulates the propagation of sound waves through a tube using waveguide techniques (Cook Reference Cook1990). Like the vocal tract being modeled, the cross-sectional areas of particular tube sections can be varied independently over time. Any relative differences in area (or, equivalently, radii) between tube sections give rise to differences in acoustic impedance, which are modeled in the TRM using two-way scattering junctions. This affects the resonant behaviour of the overall tube.
The topology of the TRM is shown in Figure 3. The oropharyngeal cavity is simulated using 10 discrete tube sections of equal length, which are connected via a three-way scattering junction to a six-section-long tube that models the nasal tract.
The Tube Resonance Model (TRM) waveguide model of the human vocal tract

The 10 sections of the oropharyngeal cavity are divided into eight regions of unequal length in order to approximate the proportions of the DRM (Carré and Mrayati Reference Carré and Mrayati1992), as described in section 3.3 below. The radii of all these regions, plus the radius of the velum, can be varied over time by sending tables of parameters (classified as control-rate parameters) to the synthesizer at a rate of 250 Hz. The radii of the nasal cavity sections of the oropharyngeal tract are also settable, but are fixed for the duration of an utterance (they are classified as utterance-rate parameters). The oropharyngeal region 1 is also usually treated as utterance rate.
To help model male, female, and juvenile voices, the length of the tube can be set anywhere from 10 to 20 cm; this requirement is effected in the TRM using a variable internal sample rate – the higher the sample rate, the shorter the effective tube. The vibration of the glottis is represented by using a wavetable oscillator, whose output is injected into the tube at region 1, allowing arbitrary glottal waveforms to be used by changing the wavetable data. The waveform generation parameters may also be varied, and the shape changes with vocal effort. Aspiration is simulated using low-pass filtered noise, which is also injected into the tube at the glottis end. Frication is modeled using bandpass-filtered noise, which may be injected into the tube anywhere along the tract, corresponding to the possible places of constriction. Realistic multiple-peak transitions comparable to the published data cited occur in the noise as the vocal tract shape changes.
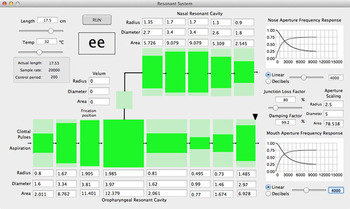
A more complete technical description of the TRM can be found in Manzara (Reference Manzara2005). Figure 4 shows the Graphical User Interface (GUI) – TRAcT, the Tube Resonance Access Tool that was developed to allow hands-on experimental work with the TRM.
Graphical interface to the TRM vocal tract model

For such a tube model, which does not exactly represent the anatomy of the human vocal tract in any case, there are still significant problems in achieving text-to-speech synthesis, including a need for:
-
a. a simple enough control method for the tube;
-
b. data on the tube radii, as related to speech sounds that reflect articulation;
-
c. a computational framework that understands the concept of segments, but uses them without being restricted to their boundaries for parameter construction;
-
d. an adequate model of salience and rhythm to assign event timing;
-
e. an adequate model of intonation in order to determine overall glottal frequency (F0) variation;
-
f. a comprehensive strategy for automatically creating the phonetic representation of text from normal orthography, which must automatically generate annotations for driving the rhythm and intonation models used.
3.3 The control model
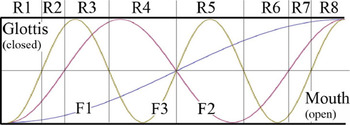
Fant and Pauli (Reference Fant and Pauli1974) carried out a study of how formant frequencies change as changes are made in the vocal tract diameter at different places along its length (a so-called formant sensitivity analysis). Their study was predicated on small perturbations, but works well for larger ones. The sensitivity functions represent the effect of constriction in the tube on each formant frequency. The functions, shown in Figure 5, are tied to the formant nodes and anti-nodes along the length of the tube.
Formant sensitivity functions for F1, F2, and F3, in a uniform tube

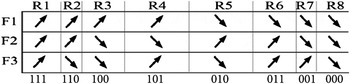
The analysis shows that the vocal tract – treated as a uniform cylindrical tube (roughly the configuration for the neutral vowel /Λ/) – is divided into eight distinct regions (R1 to R8). These are shown in Figures 5 and 6. In each region constriction affects the frequency values of the formants differently. If a rise in a formant value is represented as a binary ‘1’, and a fall as a binary ‘0’, the eight regions can be regarded as each having a unique binary code, as shown beneath each section in Figure 6, which shows the direction of the rise-fall effects of constriction by each region.
The DRM regions, showing the rise/fall effects of constriction of F1, F2, and F3

The eight sensitivity regions with their distinct effects can form the basis for controlling a tube that simulates the vocal tract, an idea initially developed by Carré and Mrayati (Reference Carré and Mrayati1992) as the Distinctive Region Model or DRM. It should be noted that although Figure 6 indicates rising or falling formant values corresponding to constriction anywhere in the region, the effect on a given formant frequency is actually greater where the sensitivity function has the larger value, as is obvious from the Figure 5 sensitivity functions.
The DRM is only an approximation to the ideal control method since the regions are each changed as a uniform segment of the tube. There is no continuity at the boundaries of the regions, and the regions are cylindrical. In the current implementation, a further approximation is made by using 10 equal-length sections to represent the eight DRM regions. This was done to adapt the DRM arrangement to the computing speeds available at the time the project was initiated. A control system using only 10 sections in the tube provided a good enough approximation to the desired control model, and allowed computations down to a 16 centimetre-long tract in real time. With today's computers, a 10 centimetre length is easy, and is the new minimum.
The 10 tube section boundaries generally lie on the DRM boundaries as determined by the sensitivity analysis, with the four centre sections combined to form the two central DRM regions, as seen in Figure 7, giving eight independent controls.
Various Distinctive Region Model approximations

There are slightly misplaced boundaries between R2 and R3, and between R6 and R7. These occur at places having a relatively small sensitivity effect on the relevant formants, either because the magnitude of the sensitivity effect is large, but the resulting change in magnitude is small; or the effect is small despite the greater absolute magnitude change. Note that dividing the tube directly into eight equal divisions – the tick marks at the top of Figure 7 – provides a far worse approximation to the DRM regions.
The ten-section approximation has proved sufficiently close to the ideal that the synthesized speech is of good quality. If the control model is represented by 30 sections, suitably combined into eight regions, the model provides exactly the lengths required for all DRM regions – the regions required to model the formant sensitivity analysis, as also shown in Figure 7.
If the 30-section version is used there is an additional benefit. There will still only be eight DRM regions to control, as before, keeping the control problem as simple as possible, but algorithmic continuity constraints can be applied automatically to the subsections, within and between each DRM region, to make a far better approximation to the actual shape of the vocal tract without adding much complexity. However, the computational load will be three times higher because the sections are now only one third of the length used for the ten-section version (shorter sections require higher sample rates). Today's CPU speeds can easily manage this increased computational load. As suggested in section 5 another tube model, such as Tubetalker, could be used to gain additional advantages.
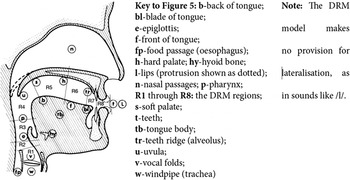
Not surprisingly to the authors, the DRM regions are closely related to the anatomical landmarks associated with human articulation, as shown diagrammatically in Figure 8. This strongly suggests that these regions are basic to natural articulation, which also suggests that natural articulation provides the necessary and sufficient mechanism for easy control of the speech features that we see in natural speech – in particular, of the three lowest formants that are known to provide the basic cues for intelligibility of speech – with the higher formants occurring at frequencies naturally determined by the tube acoustics. This enhances intelligibility, but it is important to realise that the higher formants are not independent of the three lowest formants.
DRM regions in relation to the anatomical landmarks associated with articulation

3.4 Acquiring databases and rules to relate speech sounds to vocal tract dynamics
Having identified a potentially viable real-time control system for low-level articulatory speech synthesis, the next problem was that the necessary data (the association between speech sounds and vocal tract radii/configurations for the individual DRM regions) and rules for using the data (how to manage the timing and shape of the transitions for the individual DRM regions) did not exist. It is very clear to those who have studied and used the spectrographic representation of speech that, although a segmental analysis does provide a viable framework for phonetic description of speech that can be related to both speech sounds and conventional orthography – a description that has been successfully used in linguistic analysis for decades – the boundaries between such segments are questionable, as already noted, for at least two reasons.
First, neighbouring sounds have strong interactions and mutual dependencies (coarticulation and more) that may extend farther than the immediate neighbours. This complicates the application of Unit Selection to the problem of text-to-speech synthesis.
For example, stop sounds cannot be perceived without at least one adjacent sound because the cues for the place of articulation, in fact the very existence of stop sounds, are carried by the formant transitions flanking the stops, the speech intensity, and associated noises, as is readily apparent by trying to say the sounds /k/, /æ/, and /t/, that represent the spoken word ‘cat’ in isolation. Even cues such as Voice Onset Time (VOT) and aspirated release depend on a following sound (if only a schwa vowel). Though such noise cues (or their absence) are part of the complex used in perceiving stop sounds, placing a boundary at the point where the full contoidal constriction starts, or ends, cuts off the formant transition cues for the contoid (in this case /k/ and /t/), and also eliminates the stop gap and release noises. Equally, an attempt to utter a /w/, /j/, /r/ or /l/ in isolation simply results in what sounds like a muffled vocoid. (Note that lateralisation for /l/ is not currently implemented.)
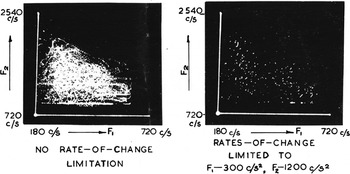
Secondly, vowels in continuous speech cannot be reliably identified outside the context in which they occur, since in context they have only a relative identity rather than an absolute identity. Shearme and Holmes (Reference Shearme and Holmes1962) showed that there was no clustering of points corresponding to different vowels in a plot of formant 1 against formant 2 for a selection of natural vowels in continuous speech as shown in Figure 9, even though they found that clustering was evident with isolated vowels.
Distribution of formant 1 and formant 2 during vowels and vowel-like sounds for one speaker in continuous speech (Shearme and Holmes Reference Shearme and Holmes1962)Footnote 9

Ladefoged and Broadbent (Reference Ladefoged and Broadbent1957) used Lawrence's Parametric Artificial Talker – PAT (Lawrence Reference Lawrence and Jackson1953) – to generate six different versions of the carrier sentence “Please say what this word is” using the same parameter tracks to drive PAT for each, but changing the range over which the formants varied. All six versions were readily identifiable as the same sentence. A set of four /b–t/ words was also synthesized in which the middle ‘–’ represented a vowel. When the words were presented to 60 subjects, following the introductory carrier sentence, identification of the vowel varied, depending on the formant range of the carrier sentence, from ‘bit’ through ‘bet’ and ‘bat’ to ‘but’.
Clearly, when synthesizing speech, one is on shifting ground. The identification conveyed by a particular set of vowel formants is not determined by the vowel formants alone, but depends on the whole context of sounds produced by the speaker – just as the visual perception of colour and contrast depends on the visual context (a huge subject on its own that is outside the scope of this paper). Perception is not a template process, but is an active organising process that builds percepts from fragments of sensory evidence on the basis of experience, expectation, and context. We see the moon as increasing in size the nearer it is to the horizon because we are increasingly compelled to see it as increasingly far away. The fusion of the McGurk effect – hearing /b/, seeing /g/ and perceiving /d/, for example (McGurk and MacDonald Reference McGurk and MacDonald1976; McCullough Reference McCullough2014) – arises because we have to reconcile the sound we hear with the conflicting appearance of the speakers’ lips and jaw. Close the eyes, and we perceive the sound that was actually produced. This is not the place to be diverted into a treatise on perception, but its active, organising nature is well documented in the psychological literature even at the Psychology 101 level (e.g., Alleydog 2016), though it has occupied philosophers in arguments for millennia. The speech signal conveys just such fragments of evidence – often quite noisy, approximate, and with omissions – together with information about the identity and sociolinguistic background of the speaker. However, the formant data for isolated vowels provided a good starting point for initial target postures and, in practice, effects such as coarticulation, vowel reduction, and so on can be achieved by creating and applying suitable articulatory modifiers (see section 3.4.2). Wells (Reference Wells1963) provided the starting point for our specification of vowels. But the dynamics of articulatory parameters requires a non-segmental approach to construction – an “event-based” approach (Hill Reference Hill1978).
It is important to realise that the identity of speech sounds (segments) is only part of the story anyway, since rhythm and intonation are also crucial to production, comprehension, and meaning. Problems faced by those learning to speak a language (English, say) are not restricted to learning the sounds of the language and gaining a vocabulary, but also arise in mastering the rhythms and ellipses, as well as the intonation (F0 inflections) and control of intensity. In order to speak the right words in the right way to convey the intended meaning intelligibly, all these attributes have to be mastered, along with idiomatic expressions, and an ability to understand the real world in terms of the language, plus other matters of language use. Failure in any of these attributes compromises fluency. Consider two possible answers to the question: ‘Shall we meet at five o'clock?’ The respondent might say: ‘No, later’ or ‘No later’ – the same words, but the first version of the response with the pause states that five o'clock is too early, whereas the second, with significant changes in intonation and rhythmic structure as well as the elimination of the pause after ‘No’, makes it clear that five o'clock is the very latest the proposed meeting should be scheduled.
In a different language (say Chinese) F0 also indicates tone, affecting meaning at the lexical level (distinguishing words) in addition to other information. This is very difficult for a speaker whose native language is a non-tone language to master because, as Kuhl and others have determined, up to the end of the first year of life, mapping potential phonetic features that all humans seem to possess focusses on the ones important to the ambient language and essentially eliminates those from non-ambient languages (Kuhl Reference Kuhl2000; Kuhl et al. Reference Kuhl, Conboy, Padden, Nelson and Pruitt2005).
Given these realities, a general approach – a complete solution – to either speech recognition or speech synthesis by machine is a very difficult problem. It includes the problem of serious understanding of the world and of dialogue. Such a solution is not yet available. In the simple English example discussed above, an algorithm can be defined that uses the comma as the basis for choosing different rhythm and intonation in the two cases, but solutions along those lines put the onus for understanding on the person who writes the text to be spoken, rather than on the machine's understanding of the situation. Beyond punctuation, it becomes a matter of annotated text – hardly a general solution, unless done algorithmically by a machine that “understands” what is going on.
Some issues of rhythm and intonation have been addressed and some other problems avoided in the current articulatory system by insisting that text be properly punctuated, something that is all too frequently absent these days. The problems of understanding will eventually have to be solved if speech recognition and synthesis are ever to approximate human performance.
What follows describes an initial framework and its use, one that allows a very flexible basis for creating parameters to represent speech articulation, with significant flexibility in timing and targets, as well as allowing models of rhythm and intonation to be evaluated. Creating the databases needed for these various aspects has been very labour-intensive. As our knowledge increases, the work could be taken over by learning components (as has happened with other approaches and is suggested as part of future work below). The current project has resulted in a model for a single speaker's articulatory habits (perhaps best thought of as part of accent), but with the ability to vary over a range of child, female, and male qualities that depend on such characteristics as F0 range, degree of breathy voice,Footnote 10 and vocal tract length. That is not to suggest that child and female voices differ from male voices only in these terms. However, the framework is a start on the problem of using a computer to investigate a number of interesting questions in linguistics, including understanding what are the characteristics of an accent; how male, female, and child voices differ; what characterises some gay men's speech; and so on. The system also provides a basis (which needs to be refined to make it even more convenient than it is at present) for creating stimuli for psycholinguistic experiments (such as varying VOT). A digest of these areas is beyond the scope of this paper.
3.4.1 Obtaining data on the tube radii, rhythm, and intonation needed for producing synthetic speech
The most accurate way to obtain data on the equivalent tube radii associated with speech sounds would involve three-dimensional imaging and measurement of the vocal tract areas at reasonable sampling intervals, along the tract as well as in time, for the speech sounds of a target language, followed by their conversion to equivalent tube radii variations. Actually, it would be more accurate to speak of vocal tract dynamics rather than sounds. Casting the varying spectrum in terms of a succession of specific sounds is highly misleading, since the apparent succession of discrete phones that are transcribed by phoneticians are – as noted – actually perceptual constructs, rather than the assumed identifiable discrete building blocks to which reference is so commonly made. The underlying mechanism of speech production is a succession of gestures made with the component articulators of the vocal apparatus in which target vocal tract postures (from now on referred to as ‘postures’ or ‘targets’) are only more or less achieved, asynchronously, one after the other, with intermediate articulatory gestures starting and ending at different times. It is important to emphasize that posture targets are only more or less achieved. Stevens (Reference Stevens1968) looked at the perception of isolated vowels compared to vowels in context, and found that vowels in context tend to be perceived in a categorical fashion, with discrimination boundaries that are characterised by peaks at the phoneme boundaries, whereas isolated vowels formed a perceptual continuum. (See also the text above related to Figure 9).
As is evident from the difference between, say, ‘bow’, ‘now’ and ‘wow’, the form of the transitional movements, together with other cues like nasalisation or the voice bar, are crucial to creating the correct phonetically identifiable percept. Perception is an active organising process based on fragments of evidence, as already pointed out.
Thus it is necessary to derive a set of nominal postures (targets) for articulator components, along with rules for determining how closely they are achieved, and how they should be joined to neighbouring postures in a given phonetic context, along with a specification of the relative timing and shape of transitions for the various tube radii representing the articulatory components, and other elements of the articulatory process (such as voicing onset/offset, noise bursts and velar opening/closing). Resource limitations precluded setting up the necessary laboratory, team of speakers, equipment, and staff to obtain three-dimensional data from MRI imaging, as Birkholz (Reference Birkholz2013) has done for his physiological analog.
Instead, what was done was to infer the data needed indirectly. There is a wealth of data about how the spectrum of speech changes (the transitional cues) for particular utterances and sound combinations dating from the 1940s, 1950s, and 1960s (for example: Delattre et al. Reference Delattre, Liberman and Cooper1955; O'Connor et al. Reference O'Connor, Gerstman, Liberman, Delattre and Cooper1957; Lisker Reference Lisker1957; Green Reference Green1958; Liberman et al. Reference Liberman, Ingemann, Lisker, Delattre and Cooper1959; Potter et al. Reference Potter, Kopp and Kopp1966; and Delattre Reference Delattre1969). An important part of this early work was carried out at the Haskins Laboratories, originally located in Schenectady, NY and now in New Haven, Connecticut (Haskins n.d.). There were many other labs involved – too many to list here, but they include work at University College, London, as well as Gunnar Fant's KTH Speech Technology Laboratory, noted above. The Wells (Reference Wells1963) vowel formant data was appropriate, as the aim was a mid-Atlantic accent.
Apart from information available from such spectrographic studies, utterances were recorded and examined for their acoustical characteristics, including formant transitions, noise bursts, voicing onset and offset, and relative intensity, as well as the relative timing of visible events and the duration of the segments according to traditional phonetic analysis made to provide a nominal framework. As a basis for rhythm and intonation models, in addition to subjective experiments with artificial stimuli (for example, Hill and Reid Reference Hill and Reid1977), the whole of Halliday's study units 30 and 39 (Halliday Reference Halliday1970) were subjected to conventional phonetic analysis twice, initially by the first author and then by the distinguished phonetician Wiktor Jassem, based on spectrograms. The results were used to derive the durations of individual phones and identify the stresses.Footnote 11 The study units had all been published with information showing the rhythmic structure, in terms of Abercrombie's system of describing British English stress (Abercrombie Reference Abercrombie1967: 96–98). The duration of the rhythmic units (Abercrombie and Halliday refer to them as feet) could be calculated from individual phone durations. The individual phone durations were also statistically analysed according to various criteria to provide insight into the sources of phone duration variance as a basis for building the necessary rhythm model. The only independent sources of phone duration affecting rhythm were found to be: (1) phone identity; (2) whether the phone was in a marked (stressed, salient, final) or an unmarked foot; and (3) a correction related to the number of phones in the foot concerned (Hill et al. Reference Hill, Witten and Jassem1977, Reference Hill, Jassem, Witten, Hollien and Hollien1979; Jassem et al. Reference Jassem, Hill, Witten and Gibbon1984).
A number of English intonation modelling systems were considered, including those of Pike (Reference Pike1945), Halliday (Reference Halliday1970), Crystal (Reference Crystal and Bolinger1972), Witten (Reference Witten1977) (which is strongly based on Halliday's model), O'Shaughnessey (Reference O'Shaughnessey1977) (as cited in Allen et al. Reference Allen, Hunnicutt and Klatt1987), and the Institute for Perception Research (IPO) group in the Netherlands (e.g., Cohen and ‘t Hart Reference Cohen and ‘t Hart1968; de Pijper Reference de Pijper1983; ‘t Hart et al. Reference ‘t Hart, Collier and Cohen1990; Willems et al. Reference Willems, Collier and ‘t Hart1988). Two of these – Witten's Halliday-based scheme and the IPO scheme – were selected as complete enough, relevant enough, and suitable enough for computer implementation to be chosen as the basis for intonation evaluation studies. Both required slight adaptation. Fifteen subjects listened to 90 sentences in subjective tests partially replicating those of Willems et al. (Reference Willems, Collier and ‘t Hart1988) and de Pijper (Reference de Pijper1983). The results were statistically analysed. No significant difference in naturalness was found between the scheme based on Witten's adaptation of Halliday's approach and the more complex IPO scheme. Both were judged significantly less natural than natural contours – all contours being applied to the same 10 synthetic carrier sentences. In addition, although some utterances based on the IPO scheme were judged more natural than those using the Witten scheme, some were judged less natural. Since the naturalness ratings for Witten's Halliday-based scheme were more consistent, it was chosen. It seemed better to have consistency than to have a scheme where some utterances are noticeably more natural, whilst some are less natural (Taube-Schock Reference Taube-Schock1993).
Software was also written so that as data, rules, and models were developed, they could be used to send parameters to the articulatory synthesis system, in real time, allowing the results to be assessed by informal – but informed – listening and spectrographic comparison.
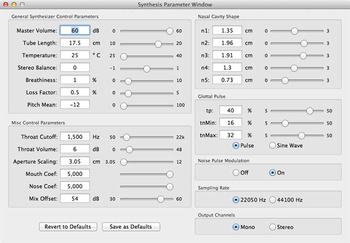
One component of the software tools used was TRAcT (see section 3.2 and Figure 4). TRAcT allowed static TRM configurations to be set up and auditioned. The parameters include the control-rate parameters that determine the shape of the vocal tract by varying the DRM regions and introduce energy, as well as utterance-rate parameters that remain fixed as an utterance is synthesized (this includes parameters such as tube length, temperature, nasal tract shape, among others). The control panel for utterance-rate parameter settings in the text-to-speech module is shown as Figure 10. They can also be changed under program control (for example, to alternate between different speakers).
Utterance-rate controls for the TRM-based articulatory speech synthesizer

3.4.2 The computational framework and data model for driving the articulatory synthesis
The core software, originally built on a NeXT computer, but now essentially ported to Apple Macintosh and GNU/Linux, and partially to other systems, includes a complex, special-purpose editing tool – MONET – that allows posture parameter and duration data, parameter transition shapes and timing (transition profiles), F0 contours, and a few other elements to be observed, created, or edited. A speech server uses the information and rules to convert phonetic descriptions into control-rate parameters, and then uses these to drive the tube model to produce speech. The utterance-rate parameters can be set up prior to synthesizing an utterance to distinguish different speakers.
A 70,000+ word pronouncing dictionary that includes word stress and parts of speech information was also created. The dictionary is also capable of determining derivative words (plurals, participles and so on), backed up by a set of letter-to-sound rules that are used if the dictionary search fails to find a pronunciation. In the latter case, defaults are used to determine word stress. A parser pre-processes such items as numbers, dates, and acronyms into conventional pronounceable form. This information allows a string of text in standard English orthography to be converted to a phonetic description in terms of postures, as well as the generation of markers for assigning intonation and rhythm according to the models developed on the basis of our experimental work, according to the punctuation in the text (for the moment, but see section 5).
Initial defaults are provided for posture targets and the various composition rules so that even before any working data have been defined, the system can run and produce output without error messages being generated. With this infrastructure in place, a largely manual, iterative process of creating, testing, and editing the language database data elements was carried out. The process included building the posture data, and creating a myriad of regular parameter transition shapes, potentially distinct for each control-rate parameter, for each posture-to-posture transition, using the various GUI tools. Parameter transition shapes and compositional rules – currently 47 compositional rules – were developed and used to decide in real time which parameter transitions should be applied to which parameter for each posture transition. Special transition profiles were created, to be combined by linear superposition with the regular transitions, to composite different effects such as noise bursts. There are also rewrite rules that decide how to handle particular posture combinations that can arise, such as vowel-to-vowel transitions at word junctures – whether an /r/ sound should be inserted, or whether to change the schwa to /i/ at the end of ‘the’ if a word beginning with a vocoid follows, and so on. These rewrite rules can control other changes as needed.
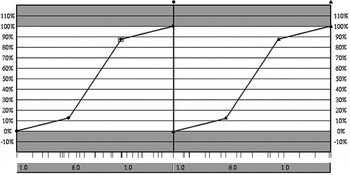
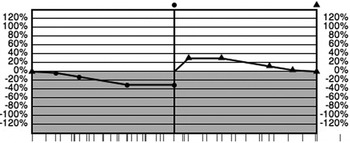
Provision is made for the transitions needed in the context of diphones, triphones, and tetraphones – sequences in which two, three, or four postures respectively need to be treated together. It should be noted that every transition profile created can be – and was – displayed, edited, and immediately tested in a variety of contexts to compare the speech entities produced, to check the intelligibility, and to compare the spectrograms of test utterances to those produced from real speech. It is an iterative process. The named transition profiles can be specific to a single parameter for a single composition rule, can be used for classes of transitions that need the same profile, or both. Figure 11 shows an example of a simple, general-purpose triphone transition profile that has been created for use in phone-to-voiced-stop-to-phone situations.
Default triphone transition profile for stop closure

Note that the value of the transition profile graph at a particular time indicates the percentage of the change from one set of targets to the next that should have taken place at that stage in the transition. Thus, in the representation of the first transition of the triphone from the first posture to the second, at zero time, 0% change has occurred. As time passes, the next target is 100% achieved with the specified trajectory. Then for the second half of the triphone, the change again starts at 0% beginning at the second posture target and progresses to 100%, achieving the target for the third posture. A diphone profile looks like one half of the Figure 11 profile, whereas a tetraphone has three transition segments of similar form. A stop sound would involve much sharper transitions plus special parameter profiles (see below, this section).
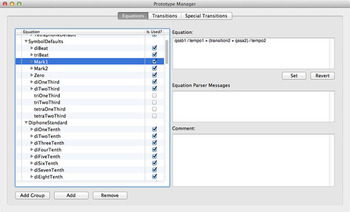
The short line segments projecting beneath the Figure 11 graph are the various formula-determined timing points. Such timing points can be determined from the main posture framework and duration information by equations, and accessed by symbols. The equations relate the actual timing to the nominal segmental time framework. Figure 12 shows the simple timing equation for setting the value of the Mark1 symbol, one of the major time points computed for any posture sequence construction. The symbol qss refers to the quasi-steady state of a posture –“quasi” because, in practice, some change in value normally occurs. The symbols “a” and “b” are the first and second parts, and “1” and “2” refer to the first posture and the second posture respectively. Tempo reflects the rate of speech for the posture. Other symbol names are displayed on the left, and checked boxes show which ones are actually used. Timing symbols and values are created and specified as needed for fidelity. The numbers below the short line segments in Figure 11 are the slope ratios for the graph segments, which are used to provide a means of allocating the total change in value between the posture targets in a way that avoids specifying absolute value changes – a requirement for generality.
Mark1 defining equation in the Prototype Manager ‘Equations’ database

The original posture target configurations were created by using published data plus the spectrographic analyses previously noted, and were statically checked for precision and perceptual effect by using TRAcT to determine the tube configurations and the spectra of the resulting postures, then checked again, in dynamic context, using the MONET real-time synthesis facility. These initial estimates for the postures and transition profiles were checked by using them in short utterances, also synthesized within the editor, as the rules, postures, profiles, and tools were iteratively developed.
Stop sounds do not show a full spectrum during closure, though voiced stops have a low frequency voice bar. However, stop sound postures were created using published knowledge concerning the loci of stop consonants and noise bursts on release – those frequencies discovered and investigated by a number of researchers associated with the Haskins Laboratories and others (e.g., Delattre et al. Reference Delattre, Liberman and Cooper1955; Hoffman Reference Hoffman1958). The data were varied to test for the correct perceptual and spectral effects.
The spectra of the noise bursts are, like the loci, associated with the place of articulation of the stop, and result from the release of closure allowing a rush of air through the initially small gap following closure. Especially in the case of voiceless stops, aspiration noise may also occur. Fricative articulations are associated with similar places of severe, but not complete constriction, and data is available for the spectra of these fricatives (e.g., Strevens Reference Strevens1960, Reference Strevens1961; Jassem Reference Jassem1962, Reference Jassem1965). Such data is useful for zeroing in on suitable noise-burst spectra for convincing stop releases, both perceptually, and by making spectrograms of the synthesized data for comparison with the published data of various sorts, as well as our own real speech recordings.
The turbulence associated with fricatives and stop bursts is not simulated aerodynamically, but is approximated using three parameters to control the centre frequency, bandwidth, and place of injection of noise into the tube. This is an approximation. However, the noise is significantly affected by the tube resonances. Thus, as the tube configuration varies to and from fricatives, the noise shows appropriate transitions comparable to natural speech, correctly related to the neighbouring postures, and includes multiple peaks during the constriction and the characteristics of the tube segment(s) involved, as reported by Uldall (Reference Uldall1964).
For the noise bursts associated with unvoiced stop releases, a slightly more complicated procedure is involved. For a voiceless stop there is not only turbulence at the point of release, but also often a rush of air through the wide-open glottis, so both fricative noise and aspiration noise are required. A further broad spectrum noise source and control parameter are therefore provided. The noise is injected at the glottis to provide the aspiration noise. Again, changes in the tube shape cause transitions in the spectrum of the aspiration noise. Aspiration is also required for whispered speech.
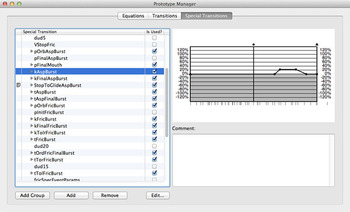
The timing of the noise bursts and aspiration is critical, just as for VOT, and may differ significantly from the timing of other tube configuration changes (the basic posture-to-posture timing). They are distinct from the basic posture targets. A second set of parameter transition prototypes is therefore provided (special transition profiles, see above, this section) so that the two effects may be dealt with independently and then composited. Special transition prototypes are provided for all control rate parameters. Thus aspiration may be used for whispered speech with appropriate increases in aspiration, as needed (for example, for sounds such as [p h , k h ]). Figure 13 shows the complete prototype manager window, including the tabs that allow the equations determining the time points to be examined, as well as the regular Transition Prototypes. Figure 11 was cut from a similar window. The special transition prototype illustrated produces the burst of aspiration following the release of a [k h ]. Note that slope ratios are not necessary here. Instead the change is specified as an absolute percentage of the value stored with a given posture.
Triphone special transition providing an aspiration burst following /k/

There are also F0 cues specific to some postures, independent of the intonation contour, called microintonation – implemented by both regular and special control rate parameters. The perturbations of F0 arise because, when the vocal tract is restricted or completely occluded, there are pressure changes across the glottis. Because both the tension in the vocal folds and the pressure difference across them determine the frequency of vibration, F0 will fall when the pressure across the glottis decreases, as when the vocal tract is significantly constricted (e.g., a voiced stop), the amount of fall depending on the rise in pressure above the glottis. When the constriction is released, the F0 will rise again. After a voiceless stop it will start at a higher value and fall to the intonation contour again as normal glottal flow resumes. Microintonation thus affects relevant postures as required, based on the various target values (normal and special) stored for the postures.
These and other facilities provide the tools – amongst other possibilities – for psycholinguistic experiments that may help elucidate the structure and character of articulation in relation to the acoustic output that is human speech.
Figure 14 provides an example of a Special Transition Profile to produce micro-intonation for voiceless stops in general (other possibilities may also be created and invoked, of course). For the voiceless stop, the percentage change is zero, falling to negative, going into the posture, producing a fall; and positive, falling to zero, coming out of the posture producing an F0 that starts higher than the basic intonation value before falling to zero, thus restoring F0 to its expected value.
Triphone special transition, vlessStopMicroInt, (voiceless stops microintonation)

Since the final output from the tube is determined by all the parameter changes, the output is computed based on linear superposition (compositing) of the transition profiles and the special transition profiles, using the posture parameter targets individually. F0 is computed separately, according to the intonation contour and the posture timing, and the micro-intonation is composited with the basic contour, as described above, providing additional cues for the postures involved.
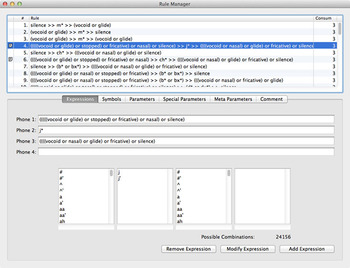
Choosing which transition profiles are used, for which parameters and for which posture combinations, is the job of the composition rules, which are managed by the Rule Manager. We have so far developed 47 generation rules, running from the most specific to the most general (rule 47 is the default – phone>> phone). They are examined in that order, from specific to general, so that special cases are caught before reaching a more general rule that might otherwise be applicable.
Figure 15 shows the first nine rules. The number of postures consumed by the rule is shown on the right-hand side. The tabs below the rules panel allow Expressions (shown), Symbols, Parameters and Special Parameters (which show the applicable named transition profiles or special transition profiles used for each of the control-rate parameters to be used as a result of that rule), Meta Parameters,Footnote 12 and Comments.
Some composition rules shown in the Rule Manager

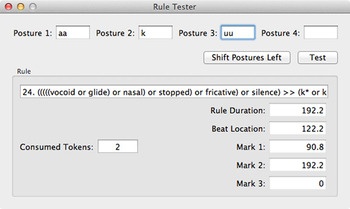
Note that the timing and course of events in the articulatory gestures is determined independently for each by the transition profiles and special transition profiles – hence “event-based” synthesis. Figure 16 shows the Rule Tester panel that allows up to four postures to be entered, and tested to see which rule will apply. The rule determines the basic framework durations/timings in the database to which timing symbol values are applied, leading to variable event placement during composition. The example shows that three postures were entered and that the matching rule consumed only the first two of those. The rule duration is the stored value for the diphone, triphone, or tetraphone involved, and the Marks 1, 2, and 3 are the positions for the nominal beginning of the transitions to the following posture; they are computed from the relevant tempos acting on the quasi-steady-state durations and transitions of the postures involved. The equation for the default Mark1 symbol is seen in Figure 12. Derivative timing placements such as ‘VlessStopVolOnset1’ (Voiceless Stop Glottal Volume Onset 1) are similarly computed from equations. The terms qssa and qssb relate to the first and second parts of a given posture's quasi-steady state respectively, so the voice onset time in this case is computed as [(qssb1 + 0.30 * transition1) / tempo1] (not shown).
Rule testing panel

The beat location specifies the time at which subjects perceive the location of the rhythmic beat in spontaneous conversation, calculated from the posture framework, based on the results obtained by Allen (Reference Allen1972a,Reference Allenb). Allen showed that the tapping point, or beat, of a stressed syllable seems to precede the release of the nuclear vowel by an amount positively correlated with the length of the syllable-initial consonant cluster, often amounting to several tens of milliseconds. Hill and Reid (Reference Hill and Reid1977) cautiously concluded that the subjective difference between pairs of 3-syllable nonsense words, each having a rise in the intonation contour that varied in position, was perceived categorically, based on whether the rise occurred early or late in the medial syllable. Such facts are relevant to placing intonation contour features relative to the postures. Exact timing is clearly important.
The timing marks visible underneath the transition profile shown in Figures 11 and 13 appear as black dots on the parameters in Figures 17 and 18. They all correspond to named symbols at the computed times determined by the equations. They are all created interactively, as needed, using mnemonic names. They can be used in whatever posture parameter computations are appropriate.Footnote 13
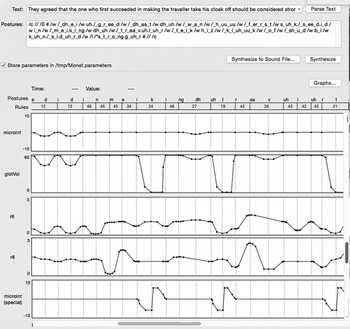
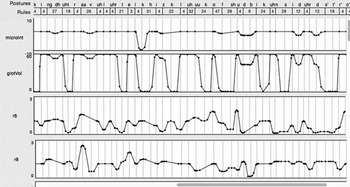
Selected control-rate parameters from a rendition of The North Wind & the Sun

Microintonation, glottal volume, R6, and R7 for part of the North Wind & the Sun

The ability to define specific times according to the rules used for generation, the tempo, and the characteristics of specific postures, and then use those times selectively for individual parameter timing, gives very precise control over the relative timing of the events that control the synthesis parameter trajectories – our event-based approach to synthesis. It captures the dynamics of the simulated vocal tract in terms of the low-level articulatory changes. It also represents a fundamental departure from the purely segmental approach to synthesis while preserving the segmental analysis framework as a bridge to phonetic analysis. It is also a potentially powerful approach to speech recognition, though the application of the idea is different in the actual methods used, since analysis – rather than synthesis – is involved (Hill Reference Hill1972). For both recognition and synthesis, an event-based approach allows significant, relevant activity to be identified or produced, independently of the artificial boundaries implied by a phone-as-building-block approach. It might appear that what Hill calls the salami approach, in which successive speech spectral slices are recognised or produced in strings (as in HMMs), does the same thing. However, such sequences are mechanical acoustic templates that have no easy connection to speech structure specifically as related to articulation, or to the relative timing of the underlying articulatory events, though the artificial speech quality is good. Concatenation/Unit Selection also works in the acoustic domain. The databases created for a language using our system provide a complete record of the low-level articulatory event structure (tube shapes and so on) required to generate speech in that language. Future work should raise the descriptive level to meta-parameters such as lip opening and jaw rotation, as suggested above.
4. Results obtained with the current development system
Figure 17 shows the synthesis window displaying a section of the posture parameter tracks, derived only using the normally punctuated standard orthography of the fable The North Wind and the Sun, as produced by our articulatory synthesis system. The right-hand scroll bar allows access to all the parameter tracks. The Text field in the window shows the orthographic text, but the Postures window shows the conversion to a posture string with automatically added annotations to control the rhythm and intonation. The full orthographic text is provided in Appendix B. Other controls are self-evident. The phonetic transcription, including the annotations for rhythm and intonation, as well as the intonation contour (but not any other parameter tracks) can be edited, if so desired.
Abercrombie (Reference Abercrombie1964: 120) states the requirements of a model phonetic text, based on Palmer and Palmer (Reference Palmer and Palmer1959).Footnote 14 He promoted the fable as a model phonetic text. PAT (Lawrence Reference Lawrence and Jackson1953) was used fifty-two years ago to make a synthetic speech version of the fable by copying parameters from an analysis of a reading by Abercrombie himself. It is therefore appropriate to use it to demonstrate the speech resulting from our articulatory system. For the sound-file location, see footnote 16.
The underlying segmental framework, including identities and durations, appears just above the parameter tracks area in Figures 17 and 18.Footnote 15 The slight microintonation (fall-rise) resulting from vocal tract occlusion that is applied to the voiced stops can be seen in the regular microintonation track at the top. The other tracks are glottal volume, DRM region parameter r6 (the front part of the mouth cavity), and DRM region r8 (the area between the lips and the teeth), and the “special” microintonation parameter. The latter can be seen producing the fall into the voiceless stop constriction, jumping to another fall after the constriction, from a higher F0 – as needed for the /k/ and the two /t/s.
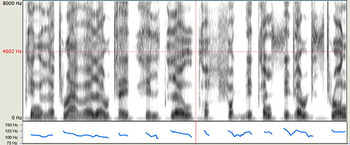
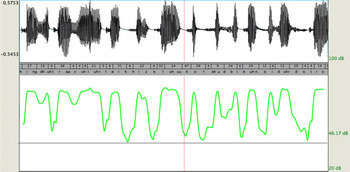
Figure 18 shows a more time-compressed portion, covering the words: ‘king the traveller take his cloak off should be considered stro’. Again, the choice of parameters viewed is made because they are each illustrative in their own way. Glottal volume, being vocal effort, is different from output intensity. The two DRM parameters, r6 and r8, give useful information about what the front of the tongue and the lips are doing – in future they would relate to the meta-parameters lip and jaw opening. For comparison, Figures 19 and 20 provide Praat analyses of the articulatory synthesis segment for the same segment of speech as is presented in Figure 18, and on the same time scale. Note that in Figure 19 the higher formants are clearly present and vary naturally. Also the resulting F0 variation is natural-looking (and sounding). Figure 20 shows the waveform and intensity plots of the segment, again to the same time scale. The intensity plot is not the same as the glottal volume parameter variation, though they are related. The intensity reflects the energy supplied by the glottal volume, with the addition of the various noises, the effects of any relevant special parameters, and also the effects of the tract resonances. The waveform plot is typical of normal speech.
Praat spectrogram and F0 graph resulting from the segment parameters shown in Figure 18

Praat waveform and intensity for spectrogram segment shown in Figure 18

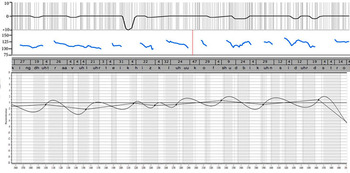
Figure 21 shows the micro-intonation parameter, the F0 track, and the intonation plot from the synthesis system, for the same segment, with the posture labels, again for comparison at the same time scale. The intonation contour can have a spline-fit smoothing function, as shown. The various intonation components can be selectively enabled and disabled, allowing, for example, monotone speech or removing the effect of microintonation.
Praat pitch track (centre) compared to micro-intonation (top) and F0 contour from system (bottom) for segment shown in Figure 18

Sound files of the articulatory synthesis of “The North Wind and the Sun” are available, as well as a synthetic utterance example taken from Halliday's (Reference Halliday1970) Study Unit 30 with an accompanying natural speech version of the same utterance to allow comparison.Footnote 16 Figures 22 and 23 provide Praat spectrograms of the Study Unit 30 utterances. Other examples are available by request.
Spectrogram of synthetic speech: “She was ninety-eight when she died.”

Spectrogram of natural speech: “She was ninety-eight when she died.”

5. Future work
We know of no other example of a complete, working, real-time articulatory text-to-speech synthesis system. Informal listening trials indicate that the speech is of very acceptable quality and is thus a reasonable emulation of natural speech. The system is a valuable research and teaching system for linguistics and phonetics, and it is available, with manuals, under a GPL licence. Despite a number of successes, however, there are shortcomings in the present system.
-
• Apart from the absence of lateralization, there is no provision for the effects of changing glottal impedance or height, and the length remains fixed. Laryngeal height changes as well as lip protrusion could be handled in a manner similar to microintonation. (Thanks to an anonymous referee for these observations, and also for the comment that there was too much high-frequency emphasis in the example – requiring a change in the relevant TRM setting). An airflow model of the glottal source and subglottal tube could be substituted for the wavetable source, and this should remove the need for a separate microintonation control, as natural microintonation would result from the interaction between glottis and airflow. However, the computation requirements would increase.
-
• The current synthesis system runs on the Apple Macintosh under OS X, having been ported from the earlier incarnation, but the code needed to save modified data files, or to save the files when creating new databases for additional languages, or to execute some of the interesting experimental possibilities (e.g., systematically varying voice onset time), requires completion. However, the interface modules to do the editing work are in place.
-
• The current system infers what it can from punctuation and dictionary in order to apply the rhythm and intonation models, and does a surprisingly good job, but to carry out the task accurately really requires the ability to understand what is being said, as well as the real-world context in which it is being said, including response understanding, as noted. These are hard and largely unsolved problems.
-
• The human-computer interface for some facilities could be improved.
-
• The databases for English should be further refined. Ideally, database creation components could be automated in the form of a learning machine that could learn to mimic speech sounds that were fed to it. That would make an interesting linguistic project.
-
• The intonation model should be modularised to allow different intonation models to be used with the basic articulatory synthesis system (e.g., Dusterhoff Reference Dusterhoff2000).
-
• One could experiment with HMMs to control articulatory event sequences.
-
• One could envisage using TubeTalker in place of the TRM. In TubeTalker the tubelets could be grouped according to the DRM model, applying continuity constraints to the shapes within and between the regions. It could then be used in place of the TRM and the system could be developed as a better articulatory-based TTS system, but based on our existing system. It should be remembered that the DRM regions match the disposition of articulatory landmarks fairly closely so that meta-parameter control – tongue height and position, jaw opening and so on – could be applied. It would be a worthwhile project. One minor problem could be the fact that TubeTalker alone currently only manages to produce its output at half the real-time rate on a 3.48 GigaHerz processor – a problem that should not persist as faster computers become available. In such work, the effect of non-uniform constriction of individual DRM regions (forced by the continuity constraints, but also controllable to reflect more detailed articulation features) could be used to form a more accurate articulatory speech emulation.
6. Conclusions
This article has outlined a unique articulatory synthesis system for linguistic research and teaching that has been validated by using it to form the basis of an English text-to-speech system producing speech that bears comparison with other contemporary systems. The problems that had to be solved were fundamental linguistic problems, bringing together work in significant areas of research in acoustic phonetics, speech articulation, rhythm, and intonation, covering a period of more than six decades, with a significant portion of the work performed in the first author's lab. These problems were quite distinct from the technical problems of implementing a working system on a computer, problems which were also successfully solved as a means of validating the DRM approach and the database that was created. The shortcomings of traditional phonetic analysis for articulatory synthesis have been outlined, and their solution, as embodied in the system, discussed. Of particular interest have been the application of Fant and Pauli's (Reference Fant and Pauli1974) work as a basis for implementing control of an acoustic tube in order to synthesize speech, using the control approach due to Carré and Mrayati (Reference Carré and Mrayati1992); the use of Abercrombie's (Reference Abercrombie1967) model of British English rhythm, based on research in the first author's lab; and applying a simplified version of Halliday's (Reference Halliday1970) model of British English intonation. We have examined speech generation at a level that has not previously been fully investigated.
Pronunciation Guide
Font comparison: Webster, Gnuspeech (Trillium), and IPA
The posture symbols used in this article to represent sounds are Trillium font symbols, except where they are enclosed in pairs (for example /a t a k/), representing a broad transcription of the English word attack, using IPA symbols. Trillium symbols are the same as Gnuspeech symbols, and follow IPA and Webster's forms fairly closely, but are closer to normal English orthography. The table below provides equivalences, and some pronunciation help in the context of Gnuspeech. The pronunciation examples use Educated Southern English (RP) pronunciation. The special case of the /r/ sound is discussed in Note 4 to the equivalence table below.

In the Gnuspeech standard dictionary and spoken output, the pronunciation of all words assumes a rhotic accent: that is, an “r” appearing in the orthographic form before a consonant, or a place where a pause will occur when spoken, is pronounced, as in General American, and unlike the Educated Southern English (RP) accent from Britain. Another systematic characteristic of General American compared to the RP accent is the use of short /æ/ rather than long /ɑ:/ in words like “command” and “dance”. In fact the Educated Southern English accent seems to be changing in that direction. Otherwise the Gnuspeech dictionary broadly follows the RP accent as specified by the new Oxford English Dictionary, and as informed by native speakers with British RP accents (typically heard on al Jazeera these days!). It is considered that this gives an acceptable, if slightly strange mid-Atlantic accent. Later versions should allow selection between more precisely defined, better approximated accents by switching dictionaries.
Note 1: Same as schwa in many US dialects.
Note 2: Frequently rhotacised in General American, not in “RP” English.
Note 3: General American really doesn't use this “RP” English vowel, and the Webster's pronunciation guide doesn't represent the more rounded “RP” version. This is a typical pitfall of the “mid-Atlantic” accent created. Similarly, diphthongs, common in “RP” English, only occur in certain regions of the US. For more information, consult some of the many books on the pronunciation of English.
Note 4: This symbol is not strict IPA. In “RP” English, the “r” sound is pronounced much the same as in General American in words like “zero” and “ground”. However, in a word like “flower the “r” is not pronounced as an “r”. A schwa vowel is used instead, unless unless the word is followed by another beginning with a vowel. In the word “herd” the “r” is omitted altogether. These are typical features of “r” in British accents generally.
Note 5: English has “clear l” and “dark l” (or “velarised l”). Synthesizers may account for the difference by a rewrite rule or composition rule since in English these sounds do not distinguish words. The “dark l” occurs in post-vocalic positions (loosely, following vowels, diphthongs and triphthongs). “Clear l” occurs elsewhere.
Note 6: In English, “h” is usually at least partially voiced in intervocalic position. Although there is a distinct IPA symbol for this (ɦ), the effect may be taken care of by a rewrite rule, as is appropriate for the clear-l / dark-l distinction of Note 2. Many such allophonic distinctions should be taken care of by rewrite rules and the composition rules.
The text of the fable “The North Wind and the Sun”
The first text below represents the fable of The North Wind and the Sun as spoken by David Abercrombie and used as the source of an early synthesis-by-copying of the fable on Walter Lawrence's PAT. The fable featured in Abercrombie's (1964) published collected set of transcribed phonetic texts that he provided for his students’ use. It was used for the main demonstration in this paper. He listed the ideal requirements for a specimen test (Abercrombie 1964: 120). … that it should:
-
• contain all the symbols;
-
• exemplify the chief phenomena of weakening, shortening, stress, word linking, etc.
-
• make sense;
-
• be as short as possible
Thus there were several reasons – technical, historical, and pedigree – for choosing the short fable, as presented by Abercrombie, to test the articulatory synthesizer. The second (short) text item is provided to allow comparison of the synthesized speech with natural speech. Sound files are available for all three utterances, as noted in footnote 16.
The North Wind and the Sun
The North Wind and the Sun were disputing which was the stronger, when a traveller came along, wrapped in a warm cloak. They agreed that the one who first succeeded in making the traveller take his cloak off should be considered stronger than the other. Then the North Wind blew as hard as he could, but the more he blew, the more closely did the traveller fold his cloak around him; and at last the North Wind gave up the attempt. Then the Sun shone out warmly, and immediately the traveller took off his cloak. And so the North Wind was obliged to confess that the Sun was the stronger of the two.
Synthetic versus natural speech comparison
She was ninety-eight when she died.