1. Introduction
Laminar separation bubbles (LSBs) often develop on airfoils operating at low Reynolds numbers (
 $\mathit{Re}_{c}=u_{\infty }c/{\it\nu}<5\times 10^{5}$
) (Carmichael Reference Carmichael1981; Lissaman Reference Lissaman1983; Mueller & DeLaurier Reference Mueller and DeLaurier2003; Boutilier & Yarusevych Reference Boutilier and Yarusevych2012b
). At these operating conditions, laminar boundary layer separation may occur on the airfoil due to an adverse pressure gradient. The resulting separated shear layer is inherently unstable and undergoes laminar-to-turbulent transition downstream of the separation location. The transition process enhances the exchange of momentum between the inner and outer parts of the wall-bounded shear layer, which can lead to flow reattachment. A dividing streamline between separation and reattachment points separates the recirculating flow region from the separated flow. This flow topology is commonly referred to as the LSB. At large angles of attack or low Reynolds numbers, the separated shear layer fails to reattach, thus stalling the airfoil. Since laminar boundary layer separation can have a profound effect on airfoil performance, the associated key aspects of flow development, including separated shear layer transition and separation bubble topology, have been investigated in a large number of previous studies (e.g. Dovgal, Kozlov & Michalke Reference Dovgal, Kozlov and Michalke1994; Burgmann & Schröder Reference Burgmann and Schröder2008; Hain, Kähler & Radespiel Reference Hain, Kähler and Radespiel2009; Jones, Sandberg & Sandham Reference Jones, Sandberg and Sandham2010; Brinkerhoff & Yaras Reference Brinkerhoff and Yaras2011). A detailed overview of the relevant studies on LSBs can be found, for example, in Marxen & Henningson (Reference Marxen and Henningson2011) and Boutilier & Yarusevych (Reference Boutilier and Yarusevych2012c
).
The results of previous investigations show that the transition process in the separated shear layer is initiated by the amplification of disturbances within a band of frequencies (e.g. Dovgal et al. Reference Dovgal, Kozlov and Michalke1994; Watmuff Reference Watmuff1999; Yarusevych, Sullivan & Kawall Reference Yarusevych, Sullivan and Kawall2009). The initial growth of disturbances agrees well with linear stability theory (e.g. Jones, Sandberg & Sandham Reference Jones, Sandberg and Sandham2008; Marxen & Rist Reference Marxen and Rist2010), and the primary amplification mechanism is attributed primarily to an inviscid Kelvin–Helmholtz instability (Boutilier & Yarusevych Reference Boutilier and Yarusevych2012c ). However, as disturbance amplitude grows, non-linear interactions ensue during the later stages of transition (Alam & Sandham Reference Alam and Sandham2000; Lang, Rist & Wagner Reference Lang, Rist and Wagner2004). The growing disturbances can cause the transitioning shear layer to roll up into periodically shed vortices. The formation of shear layer roll-up vortices in an LSB has been observed in flows over airfoils (e.g. Burgmann, Brücker & Schröder Reference Burgmann, Brücker and Schröder2006; Burgmann & Schröder Reference Burgmann and Schröder2008; Jones et al. Reference Jones, Sandberg and Sandham2010; Wolf et al. Reference Wolf, Kähler, Troolin, Kykal and Lai2010) and flat plates (e.g. Watmuff Reference Watmuff1999; Alam & Sandham Reference Alam and Sandham2000; Lang et al. Reference Lang, Rist and Wagner2004; Marxen, Lang & Rist Reference Marxen, Lang and Rist2013). The initial two-dimensional shear layer roll-up is followed by significant three-dimensional deformations of the roll-up vortices, which then break down into smaller structures. The dynamics of these structures in LSBs as well as the underlying instability mechanisms responsible for their development are still not fully understood, and are the subject of active research (Marxen et al. Reference Marxen, Lang and Rist2013).
The formation of shear layer roll-up vortices can also lead to undesirable unsteady loading and tonal noise emission. Strong tones are commonly observed on airfoils operating in the same domain of low Reynolds numbers where LSBs are observed (Paterson et al.
Reference Paterson, Vogt, Fink and Munch1973; Arbey & Bataille Reference Arbey and Bataille1983; Plogmann, Herrig & Würz Reference Plogmann, Herrig and Würz2013; Pröbsting, Serpieri & Scarano Reference Pröbsting, Serpieri and Scarano2014). In most cases, multiple tones at frequencies
 $f_{n}$
, where the positive integer subscript
 $n$
identifies the tone, have been observed (Arbey & Bataille Reference Arbey and Bataille1983; Chong & Joseph Reference Chong and Joseph2012). The dominating or primary tone, associated with the largest fluctuations in acoustic pressure, is identified by
 $n_{max}$
at frequency
 $f_{n_{max}}$
. These tones have been ascribed to the scattering of instability waves, originating upstream and amplified through the separated shear layer, at the trailing edge (Arbey & Bataille Reference Arbey and Bataille1983). Nash, Lowson & McAlpine (Reference Nash, Lowson and McAlpine1999) pointed out that a separation bubble or separated shear layer sufficiently close to the trailing edge is a necessary condition for the occurrence of tones. Due to the change in separation location, tonal noise emission at low Reynolds numbers is related to events on the suction side, while emission at high Reynolds numbers is dominated by pressure side events (Inasawa, Kamijo & Asai Reference Inasawa, Kamijo and Asai2010; Pröbsting et al.
Reference Pröbsting, Serpieri and Scarano2014).
Arbey & Bataille (Reference Arbey and Bataille1983) described the noise generation process by the scattering of Tollmien–Schlichting instability waves at the trailing edge. However, while these structures probably originate from small amplitude instability waves in the boundary layer upstream of the trailing edge (Pröbsting et al.
Reference Pröbsting, Serpieri and Scarano2014), they produce flow field fluctuations substantially exceeding those admissible for the classification of instability wave packets (Schlichting & Gersten Reference Schlichting and Gersten2000). Later, Atassi (Reference Atassi1984) pointed out that the presence of boundary layer separation upstream of the trailing edge suggests the Kelvin–Helmholtz instability as the cause for amplification. The resulting strong vortical structures convect past the trailing edge at a shedding frequency
 $f_{sh}$
, equal to that of the primary tone
 $f_{n_{max}}$
(Desquesnes, Terracol & Sagaut Reference Desquesnes, Terracol and Sagaut2007; Jones & Sandberg Reference Jones and Sandberg2011; Pröbsting et al.
Reference Pröbsting, Serpieri and Scarano2014). These vortical structures are similar to roll-up vortices observed in separation bubbles and separated shear layers. They induce unsteady surface pressure fluctuations, which scatter at the discontinuity posed by the trailing edge, leading to the radiation of sound waves as described by classical theory on trailing edge noise (Amiet Reference Amiet1976).
The frequency selection for the multiple tones (
 $f_{n}$
) has been ascribed to an acoustic feedback loop between the trailing edge emission and the upstream receptivity region. It has been formalized by a phase condition, i.e. the total phase change due to the instability waves propagating from the receptivity region of the boundary layer to the trailing edge and the upstream propagation of acoustic waves is required to be
 $2{\rm\pi}(n+1/2)$
(Tam Reference Tam1974; Arbey & Bataille Reference Arbey and Bataille1983; Kingan & Pearse Reference Kingan and Pearse2009). Compelling evidence has been produced for the existence of such acoustic feedback in experiments (Arbey & Bataille Reference Arbey and Bataille1983; Takagi & Konishi Reference Takagi and Konishi2010; Plogmann et al.
Reference Plogmann, Herrig and Würz2013; Schumacher, Doolan & Kelso Reference Schumacher, Doolan and Kelso2014) as well as simulations (Jones et al.
Reference Jones, Sandberg and Sandham2008; Fosas de Pando, Schmid & Sipp Reference Fosas de Pando, Schmid and Sipp2014). Some controversy, however, exists on the location of the receptivity region in the upstream boundary layer and, thus, the length of the feedback loop. While Arbey & Bataille (Reference Arbey and Bataille1983) associated the receptivity region with that of the maximum edge velocity, later studies place it where the first instability occurs (Kingan & Pearse Reference Kingan and Pearse2009; Chong & Joseph Reference Chong and Joseph2012).
A notable feature of the tones in the acoustic spectrum is the variation of
 $f_{n}$
with free-stream velocity
 $u_{\infty }$
. The frequency of individual tones
 $f_{n}$
is proportional to
 $u_{\infty }^{m}$
, with
 $0.8\leqslant m\leqslant 0.85$
for a NACA 0012 airfoil (Paterson et al.
Reference Paterson, Vogt, Fink and Munch1973; Arbey & Bataille Reference Arbey and Bataille1983; Arcondoulis, Doolan & Zander Reference Arcondoulis, Doolan and Zander2009; Chong & Joseph Reference Chong and Joseph2012). The value of the exponent relates to the aforementioned phase condition for the feedback loop and depends on feedback loop length as well as the convective velocity of the instability waves. Within a relatively narrow range of free-stream velocities the frequency of the primary tone
 $f_{n_{max}}$
also varies with
 $u_{\infty }^{m}$
,
 $0.8\leqslant m\leqslant 0.85$
. However, an increase or decrease in free-stream velocity eventually results in a sudden change in
 $f_{n_{max}}$
to that of a secondary tone (change of
 $n_{max}$
). Such sudden changes occur multiple times over a range of free-stream velocities, with the maximum tone frequency
 $f_{n_{max}}$
varying as
 $u_{\infty }^{1.5}$
, and these distinct discontinuous steps are commonly referred to as the ladder structure (Paterson et al.
Reference Paterson, Vogt, Fink and Munch1973; Arbey & Bataille Reference Arbey and Bataille1983; Arcondoulis et al.
Reference Arcondoulis, Doolan and Zander2009; Chong & Joseph Reference Chong and Joseph2012). Paterson et al. (Reference Paterson, Vogt, Fink and Munch1973) explains the dependence
 $f_{n_{max}}\sim u_{\infty }^{1.5}$
in terms of a non-dimensional frequency based on the airfoil chord as
 $fc/u_{\infty }\sim \mathit{Re}_{c}^{0.5}$
. The latter resembles the dependence of laminar boundary layer thickness on Reynolds number (Schlichting & Gersten Reference Schlichting and Gersten2000). Thus, Paterson et al. (Reference Paterson, Vogt, Fink and Munch1973) suggests that
 $f_{n_{max}}\sim u_{\infty }^{1.5}$
may, to the first order, be related to the decreasing thickness of boundary layer and increasing convective velocity with increasing free-stream velocity.
Within the framework of hydrodynamic stability, the development and amplification of fluctuations over the separated shear layer can be seen as convective or local instability. In contrast, the feedback of acoustic disturbances to the boundary layer at an upstream receptivity location suggests global instability (Jones & Sandberg Reference Jones and Sandberg2011). Kingan & Pearse (Reference Kingan and Pearse2009) employed linear stability theory to model the phase change over the convection part of the feedback loop and found good agreement between predicted and measured tonal frequencies. Chong & Joseph (Reference Chong and Joseph2012) followed the analysis of Kingan & Pearse (Reference Kingan and Pearse2009) and noted that the variation of the most amplified frequency as predicted by linear stability theory follows the same variation as
 $f_{n_{max}}$
. Recently, Fosas de Pando et al. (Reference Fosas de Pando, Schmid and Sipp2014) assessed the global eigenvalue spectrum and modes of the linearized operator describing the dynamics of the flow around an airfoil generating tonal noise. They found that the frequency associated with the leading global modes (least stable) was in good agreement with tonal frequencies. Furthermore, the leading global mode represented the shear layer instabilities in the aft portion of the suction side separation bubble and upstream propagation of acoustic waves.
The effect of tonal excitation may also be significant for experimental studies focused on separation bubble dynamics due to the well-documented sensitivity of LSBs to test section environment (Mueller Reference Mueller1985; Ol et al.
Reference Ol, McAuliffe, Hanff, Scholz and Kähler2005). Previous works show variation of the shedding peak frequency
 $f_{sh}$
from separation bubbles with
 $u_{\infty }^{m}$
, where the exponents
 $m$
are in the range
 $m=0.9$
–1.92 (Yarusevych et al.
Reference Yarusevych, Sullivan and Kawall2009). This range remarkably resembles the variation of
 $f_{n}$
and
 $f_{n_{max}}$
found in studies on laminar boundary layer instability noise discussed above. Several studies that investigated flow control over airfoils at low Reynolds numbers with acoustic excitation suggest that acoustic forcing can produce significant changes in separated shear layer development, specifically on the suction side (Collins & Zelenevitz Reference Collins and Zelenevitz1975; Nishioka, Asai & Yoshida Reference Nishioka, Asai and Yoshida1990; Zaman & McKinzie Reference Zaman and McKinzie1991; Yarusevych, Sullivan & Kawall Reference Yarusevych, Sullivan and Kawall2007). Thus, it is possible that tonal emissions can have a notable upstream effect on flow development on the suction side of an airfoil in low Reynolds number flows, which may lead to substantial changes in separation bubble dynamics and, consequently, airfoil performance.
The present study is set to investigate the upstream influence of tonal noise, generated by the scattering of vortical structures at the trailing edge, on the LSB development on the suction side of an airfoil. By systematically altering the characteristics of trailing edge noise emission, a significant upstream effect on flow development is observed for a range of low Reynolds numbers. An assessment of this effect is carried out using a combination of time-resolved particle image velocimetry (PIV), unsteady surface pressure measurements, and far-field acoustic measurements.
2. Experimental set-up
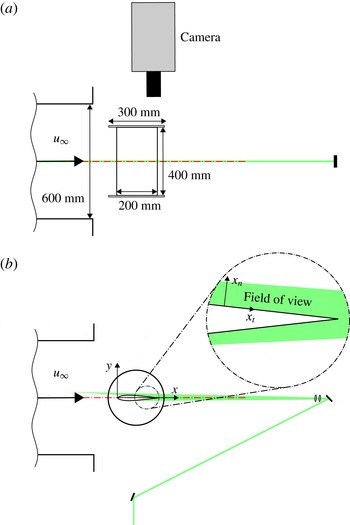
Experiments were performed at Delft University of Technology in the low-speed vertical wind tunnel facility (V-Tunnel). This closed-loop wind tunnel has an open, circular test section
 $0.6~\text{m}$
in diameter. The operating velocity range is between 5 and
 $45~\text{m}~\text{s}^{-1}$
. The free-stream velocity was set using a Pitot-static tube installed in the test section, with the associated uncertainty estimated to be less than 2 %.
A NACA 0012 airfoil model is manufactured from acrylic glass and has a chord length of
 $c=200~\text{mm}$
. The airfoil was installed approximately
 $0.15~\text{m}$
downstream of the test section nozzle (figure 1) between two circular end plates spaced by two chord lengths, complying with the recommendations for end-plate spacing of Boutilier & Yarusevych (Reference Boutilier and Yarusevych2012a
). The model was positioned at geometric angle of attack
 ${\it\alpha}=2^{\circ }$
with the associated uncertainty of approximately
 $0.1^{\circ }$
. For a lift-generating airfoil placed in an open jet of given width
 $H$
, the effective angle of attack
 ${\it\alpha}_{eff}$
is generally lower than the geometric angle of attack
 ${\it\alpha}$
due to deflection of the jet flow (Brooks, Marcolini & Pope Reference Brooks, Marcolini and Pope1986). For the flow conditions investigated here, the effective angle of attack has been estimated to be
 ${\it\alpha}_{eff}\approx 1.2^{\circ }$
.
Experimental set-up for PIV measurements. Some elements are not drawn to scale. The wall tangential (
 $x_{t}$
) and normal (
 $x_{n}$
) coordinates are defined in a surface-attached coordinate system. The origin for both the
 $x$
and
 $x_{t}$
coordinates is located at the leading edge.

The model was equipped with five microphones installed below pinholes (
 $0.2~\text{mm}$
diameter) on the suction side. The embedded microphones were used to characterize the development of dominant disturbances in the separated shear layer, as discussed by Gerakopulos & Yarusevych (Reference Gerakopulos and Yarusevych2012). The output of the microphones was equalized using an external acoustic reference signal. To characterize trailing edge emissions, a LinearX M51 microphone was positioned outside the flow in the mid-span plane at a distance of approximately
 $1~\text{m}$
from the trailing edge. The microphone was calibrated using a GRAS piston phone. All acoustic signals were sampled at
 $100~\text{kHz}$
and low-pass filtered at
 $20~\text{kHz}$
. Acoustic data were acquired simultaneously with PIV measurements to enable comparative analysis. Separately, longer duration signals were recorded for spectral analysis. The auto-spectral density for microphone signals was computed using an ensemble averaging method (Welch Reference Welch1967), with a 50 % overlap of consecutive signal windows. The resulting frequency resolution of the microphone spectra is approximately
 ${\it\delta}_{f}=6~\text{Hz}$
, sufficient for resolving the dominant instability frequencies in the flow, which vary between approximately
 $100~\text{Hz}$
and
 $1.5~\text{kHz}$
.
In addition, dedicated acoustic measurements were performed in a separate experiment. The microphone was positioned in the same location as in the PIV experiments. Acoustic measurements were performed for a range of velocities between 5 and
 $35~\text{m}~\text{s}^{-1}$
in steps of
 $1~\text{m}~\text{s}^{-1}$
. For each free-stream velocity considered, data were acquired at an acquisition frequency of
 $51.2~\text{kHz}$
for a measurement period of
 $30~\text{s}$
. Spectral analysis resulted in a frequency resolution of
 ${\it\delta}_{f}=10~\text{Hz}$
. In the discussion of the results, the auto-spectral density of acoustic pressure is denoted by
 ${\it\Phi}_{aa}(f)$
and the narrowband sound pressure levels are denoted by
 ${\it\delta}_{f}{\it\Phi}_{aa}(f)$
and presented in
 $\text{dB}$
(reference
 $20~{\rm\mu}\text{Pa}$
).
Time-resolved, two-component PIV was employed to characterize spatio-temporal flow development. The flow was seeded with water–glycol-based fog particles with a mean diameter of approximately
 $1~{\rm\mu}\text{m}$
. The particles were illuminated using a Quantronix Darwin Duo Nd:YLF laser, with a laser sheet positioned such that flow development over the suction side and around the trailing edge could be investigated (figure 1). Two high-speed cameras, a LaVision Imager Pro HS (
 $4~\text{Mpx}$
,
 $11~{\rm\mu}\text{m}$
pixel pitch) and a Photron FastCam SA 1.1 (
 $1~\text{Mpx}$
,
 $20~{\rm\mu}\text{m}$
pixel pitch), were used to capture double-frame particle images. The synchronization of image acquisition and flow illumination was performed using a LaVision Highspeed Controller and DaVis 8 software. The same software was employed for image analysis. The Imager Pro camera was equipped with a Nikon Micro-Nikkor
 $150~\text{mm}$
lens and was used for imaging the boundary layer upstream of the trailing edge. It captured a field of view of
 $90~\text{mm}\times 19~\text{mm}$
(
 $2016~\text{px}\times 428~\text{px}$
), covering the flow region of interest over the suction side. Double-frame image sequences were captured at
 $3~\text{kHz}$
, with 6000 image pairs acquired per sequence. The second camera, equipped with a Nikon Micro-Nikkor
 $200~\text{mm}$
lens, was used to capture a field of view of
 $23~\text{mm}\times 23~\text{mm}$
(
 $1024~\text{px}\times 1024~\text{px}$
) around the trailing edge. In this arrangement, the sequences of double-frame images were acquired at
 $1.5~\text{kHz}$
, with 2728 image pairs per sequence. In both experiments, the laser pulse separation was adjusted to achieve displacements of approximately
 $15~\text{px}$
in the image plane. The position of the focus plane was adjusted to obtain particle images of approximately
 $2{-}3~\text{px}$
and avoid peak locking effects.
An iterative multi-grid, multi-pass technique with window deformation was used for image processing. For the final pass, a
 $16~\text{px}\times 16~\text{px}$
window and overlap factor of 75 % were used. A Gaussian window weighting, with an aspect ratio of 2:1, was applied during the correlation process to reduce processing errors arising due to the local surface curvature and/or velocity gradients (Scarano Reference Scarano2003). The resulting vector pitch was approximately
 $0.18~\text{mm}$
and
 $0.09~\text{mm}$
for the first and second camera arrangement, respectively. Based on a typical random error of
 $0.1~\text{px}$
reported for two-component, planar PIV (Raffel et al.
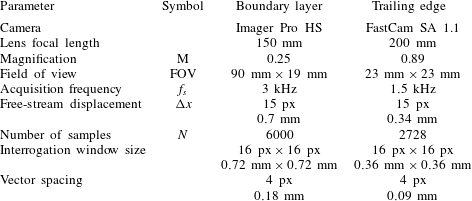
Reference Raffel, Willert, Wereley and Kompenhans2007), the random error in velocity measurements is estimated to be less than 0.7 % of the edge velocity, consistent with statistical variations in velocity data measured within the outer flow. Table 1 provides an overview of the parameters for the PIV experiments.
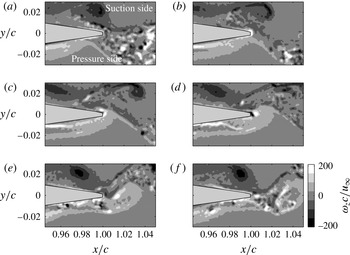
Spanwise vorticity field
 ${\it\omega}_{z}$
around the trailing edge for
 $\mathit{Re}_{c}=1.3\times 10^{5}$
: (a)
 $tu_{\infty }/c=0$
, (b) 0.03, (c) 0.07, (d) 0.1, (e) 0.13, (f) 0.17.

Parameters for PIV experiments.

3. Results and discussion
3.1. Overview of flow development and tone generation
All results presented in this section pertain to a range of Reynolds numbers
 $0.65\times 10^{5}\leqslant \mathit{Re}_{c}\leqslant 4.5\times 10^{5}$
and a fixed angle of attack
 ${\it\alpha}=2^{\circ }$
. These conditions were selected as they produce distinct tonal noise emissions in presence of laminar boundary layer separation, typical of airfoil operation in low Reynolds number flows. To illustrate key elements of flow development and the associated tonal noise production, figure 2 depicts a sequence of instantaneous vorticity fields around the trailing edge for
 $\mathit{Re}_{c}=1.3\times 10^{5}$
. The coordinate system is chosen such that the
 $x$
-axis aligns with the chord line of the airfoil and is measured from the leading edge, while the
 $y$
-axis has the origin at the trailing edge (figure 1). The results show separated shear layers rolling up into vortices on both the suction and pressure side of the airfoil. On the suction side, the roll-up occurs in the aft portion of a separation bubble upstream of the field of view. The roll-up on the pressure side occurs further downstream, just upstream of the trailing edge. The sequence shows approximately one shedding cycle, with shedding periods on the suction and pressure side closely matching. The depicted unsteady flow development around the trailing edge is accompanied by pronounced tonal noise emissions.
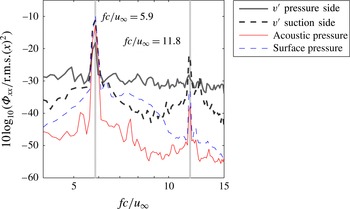
Figure 3 shows such tonal noise in the spectrum of acoustic pressure, namely a strong tone at
 $f_{n_{max}}=295~\text{Hz}$
(
 $f_{n_{max}}c/u_{\infty }=5.9$
) and its upper harmonics. Also presented in figure 3 are the spectra of vertical velocity fluctuations measured in the separated shear layers on the suction and pressure sides, and the spectrum of surface pressure fluctuations from an embedded microphone on the suction side, with all the corresponding measurements acquired at the locations where shear layer roll-up vortices are observed. Comparison shows that velocity fluctuations on both sides of the airfoil are associated with the roll-up vortices, which occur at the same frequency as the tonal noise. This implies that tonal noise is produced due to the passage of the roll-up vortices over the trailing edge, agreeing with the results of Pröbsting et al. (Reference Pröbsting, Serpieri and Scarano2014). Moreover, the results suggest that vortices originating from the suction and pressure side lock on the same frequency. Considering notable differences in flow development on the two sides of the airfoil, such close agreement between the dominant frequencies indicates a likely upstream influence of the tonal noise on the separated shear layer development.
Comparison of auto-spectral density of transverse velocity fluctuations
 $v^{\prime }$
on pressure and suction side with acoustic and surface pressure fluctuations,
 $\mathit{Re}_{c}=1.3\times 10^{5}$
.

To investigate the nature of tonal emissions and their interaction with separated shear layer development, measurements were conducted in the following four configurations:
-
(i) smooth airfoil;
-
(ii) tripped boundary layer on the pressure side;
-
(iii) tripped boundary layer on the suction side;
-
(iv) tripped boundary layer on both sides.
For boundary layer tripping, a
 $1~\text{cm}$
wide strip of randomly distributed roughness elements (carborundum, nominal grain size
 $0.58~\text{mm}$
) was placed upstream of the location of laminar boundary layer separation. The effectiveness of the trip was assessed via microphone measurements and PIV measurements around the trailing edge. Tripping the boundary layer on the pressure side (case ii) eliminates laminar separation and, consequently, shear layer roll-up on this side. Vice versa, tripping the boundary layer on the suction side (case iii) eliminates shear layer roll-up on that side. A similar methodology has been used to control boundary layer development in previous experimental studies (Paterson et al.
Reference Paterson, Vogt, Fink and Munch1973; Inasawa et al.
Reference Inasawa, Kamijo and Asai2010; Plogmann et al.
Reference Plogmann, Herrig and Würz2013; Golubev et al.
Reference Golubev, Nguyen, Mankbadi, Roger and Visbal2014; Pröbsting et al.
Reference Pröbsting, Serpieri and Scarano2014).
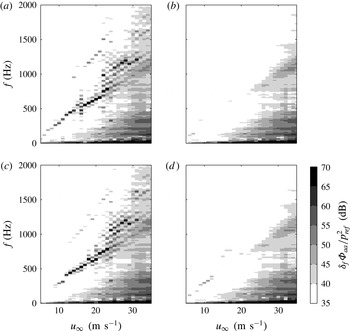
Figure 4 shows the variation of the spectral energy content of acoustic pressure fluctuations with free-stream velocity for the four configurations studied. For the smooth airfoil (case i), multiple tones (distinguished by index
 $n$
) with continuously increasing frequency
 $f_{n}$
are present. Over the entire range of velocities, sudden changes of the primary tone frequency
 $f_{n_{max}}$
(change in
 $n_{max}$
) occur, and a ladder structure similar to that reported in previous studies on trailing edge noise emerges (e.g. Paterson et al.
Reference Paterson, Vogt, Fink and Munch1973).
Narrowband sound pressure level
 ${\it\delta}_{f}{\it\Phi}_{aa}$
in
 $\text{dB}$
(reference pressure
 $20~{\rm\mu}\text{Pa}$
) for airfoil in smooth and tripped configurations: (a) smooth, (b) both tripped, (c) suction side tripped, (d) pressure side tripped.

In contrast, when the boundary layer on both sides of the airfoil is tripped, tonal noise is suppressed except for the free-stream velocities below approximately
 $7~\text{m}~\text{s}^{-1}$
, where the boundary layer trip eventually fails to suppress separation. A comparison of the results pertaining to the tripped pressure side (case ii) and tripped suction side (case iii) with those for the smooth airfoil (case i) suggests that the separated shear layer development on the pressure side dominates the overall tone generation, particularly at higher velocities. The onset of tonal noise generation on the pressure side (case iii) occurs at approximately
 $10~\text{m}~\text{s}^{-1}$
. The shedding of shear layer vortices on the suction side (case ii) can sustain tonal noise generation at speeds below approximately
 $15~\text{m}~\text{s}^{-1}$
and contributes to the overall emission produced on the smooth airfoil only within that velocity range. From their onset at
 $10~\text{m}~\text{s}^{-1}$
, shear layer vortices on the pressure side are the dominant contributors. These trends agree with those reported for acoustic measurements in an anechoic wind tunnel on a half-scale NACA 0012 model at the same angle of attack (Pröbsting, Scarano & Morris Reference Pröbsting, Scarano and Morris2015).
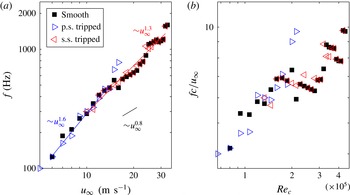
A comparison of the primary tone frequency variation for the configurations discussed is shown in figure 5(a). At free-stream velocities below
 $10~\text{m}~\text{s}^{-1}$
,
 $f_{n_{max}}$
for the smooth airfoil (case i) agrees with the one for the tripped pressure side (case ii) and thus is probably due to suction side events. At these velocities, the primary tone frequency follows a power law relation
 $f_{n_{max}}\sim u_{\infty }^{1.6}$
. For
 $u_{\infty }\geqslant 10~\text{m}~\text{s}^{-1}$
, the close agreement between
 $f_{n_{max}}$
for the smooth airfoil (case i) and that for the tripped suction side (case iii) demonstrates that the tone generation is governed by the development of separated shear layer vortices on the pressure side. Within this range, the trend of the primary tone frequency follows a power law relation
 $f_{n_{max}}\sim u_{\infty }^{1.3}$
for cases (i) and (iii). A significant change is encountered when the pressure side is tripped for
 $u_{\infty }>10~\text{m}~\text{s}^{-1}$
(case ii). In this case,
 $f_{n_{max}}$
changes significantly to higher frequency. For the smooth airfoil (case i), the overall trend of the primary tone frequency variation with velocity is close to
 $f_{n_{max}}\sim u_{\infty }^{1.5}$
. In contrast, the variation of the frequency of the individual tones
 $f_{n}$
follows a power law relation with a different exponent, close to
 $f_{n}\sim u_{\infty }^{0.8}$
(figure 5
a). Both trends have been reported in and are in agreement with previous studies (e.g. Paterson et al.
Reference Paterson, Vogt, Fink and Munch1973; Arbey & Bataille Reference Arbey and Bataille1983; Chong & Joseph Reference Chong and Joseph2012).
(a) Variation of primary tone frequency
 $f_{n_{max}}$
with free-stream velocity; (b) non-dimensional representation.

The results presented thus far illustrate that tonal noise emissions are due to the periodic shedding of shear layer roll-up vortices over the trailing edge. When present, such shedding on the pressure side dominates tonal noise generation at higher Reynolds numbers. Under such conditions, boundary layer separation on the pressure side occurs closer to the trailing edge compared to that on the suction side. As a result, shear layer vortices forming on the pressure side maintain higher strength and correlation across the span as they pass over the trailing edge (Pröbsting et al. Reference Pröbsting, Scarano and Morris2015), a condition for which classical edge noise theory predicts stronger noise emission (Amiet Reference Amiet1976). At low velocity, when shear layer separation on the pressure side does not occur upstream of the trailing edge, weaker tonal emissions can also be produced by roll-up vortices forming on the suction side. It is of interest to examine how the tonal noise emissions affect the frequency of the roll-up vortices on the suction side. To achieve this, embedded microphone measurements were conducted on a smooth airfoil (case i) and with tripped pressure side (case ii). The measured surface pressure fluctuations were verified to reflect the passage of shear layer vortices using PIV data. Similar embedded arrays were used to study unsteady separated shear layer development in previous studies (Gerakopulos & Yarusevych Reference Gerakopulos and Yarusevych2012; Boutilier & Yarusevych Reference Boutilier and Yarusevych2012b ).
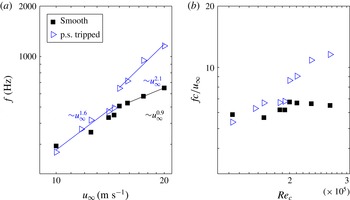
Figure 6 presents the shedding frequency
 $f_{sh}$
of shear layer vortices on the suction side for cases (i) and (ii). The frequency was identified as that corresponding to the maximum auto-spectral density of the unsteady surface pressure, which was obtained through the suction side embedded microphone measurements. Comparing the data for the smooth airfoil (case i) and that with tripped pressure side (case ii) shows notable differences in
 $f_{sh}$
, which implies that strong tonal emissions present for case (i) affect the dominant separated shear layer frequency on the suction side via a global instability mechanism (Jones & Sandberg Reference Jones and Sandberg2011; Fosas de Pando et al.
Reference Fosas de Pando, Schmid and Sipp2014). For the smooth airfoil (case i), the shedding frequency
 $f_{sh}$
on the suction side follows a similar ladder-type structure and closely matches the corresponding tonal frequency
 $f_{n_{max}}$
(figure 5). With the pressure side tripped (case ii), the shedding frequency
 $f_{sh}$
also follows a power law relation, but with an exponent significantly higher than that for the smooth airfoil (case i, figure 6), and no particular ladder structure can be identified. For
 $\mathit{Re}_{c}<2\times 10^{5}$
, the shedding frequency follows
 $f_{sh}\sim u_{\infty }^{1.6}$
, similar to the trend of the primary tone frequency
 $f_{n_{max}}$
due to suction side shedding at lower Reynolds number (figure 6). The trend changes markedly at about
 $\mathit{Re}_{c}=2\times 10^{5}$
, where the shedding frequency experiences a large increase to values
 $f_{sh}c/u_{\infty }\approx 10$
.
(a) Variation of shedding frequency
 $f_{sh}$
on the suction side with free-stream velocity; (b) non-dimensional representation.

The sudden change in the shear layer shedding frequency observed in the present study is attributed to changes in the separated shear layer development on the suction side due to acoustic excitation that can be explained as follows. As expected from previous investigations on low Reynolds number airfoils (Carmichael Reference Carmichael1981; Boutilier & Yarusevych Reference Boutilier and Yarusevych2012b ), the separation point and roll-up location move upstream with increasing Reynolds number. Thus, at lower Reynolds numbers, coherent vortices periodically pass the trailing edge on the suction side, generating tones. The scattered acoustic pressure waves propagate upstream and excite instability waves, which are amplified in the separated shear layer and lead to vortex shedding. Thus, a feedback loop is established, which influences the frequency selection mechanism (Arbey & Bataille Reference Arbey and Bataille1983) and can be viewed as a global instability (Jones & Sandberg Reference Jones and Sandberg2011; Fosas de Pando et al. Reference Fosas de Pando, Schmid and Sipp2014). Increasing the Reynolds number eventually disrupts this feedback loop due to a loss in coherence of the convecting vortical structures and lower amplitude of the scattered acoustic waves. As a result, a sudden change in shedding frequency is observed, and the frequency selection follows that expected for the natural transition process in the separated shear layer, which can be viewed as a local convective instability mechanism.
3.2. Effect of acoustic excitation on separation bubble
Following up on the analysis of the results in figure 3, it is of interest to examine in more detail the upstream effect of tonal noise on the separation bubble development on the suction side. This is achieved by a comparative analysis of PIV measurements pertaining to the smooth airfoil (case i) and tripped pressure side (case ii) configurations at two different Reynolds numbers,
 $\mathit{Re}_{c}=1.3\times 10^{5}$
and
 $\mathit{Re}_{c}=2.05\times 10^{5}$
. The results in this section are presented in a surface-attached, curvilinear coordinate system. Here
 $x_{t}$
denotes the wall-tangential and
 $x_{n}$
the wall-normal coordinate direction, while the arc length
 $L_{s}$
over one side of the airfoil is used for normalization. The origin is located at the leading edge.
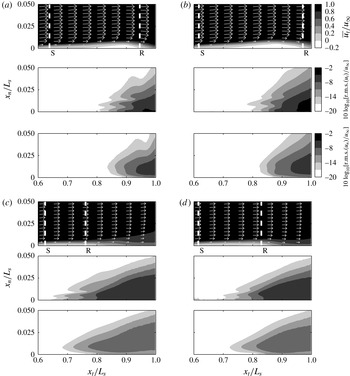
The time-averaged wall-tangential velocity component
 $\overline{u_{t}}$
and root-mean-square (r.m.s.) fluctuations of both velocity components,
 $\text{r.m.s.}(u_{t})$
and
 $\text{r.m.s.}(u_{n})$
, are compared in figure 7. Figures 7(a,b) and 7(c,d) show the results for
 $\mathit{Re}_{c}=1.3\times 10^{5}$
and
 $\mathit{Re}_{c}=2.05\times 10^{5}$
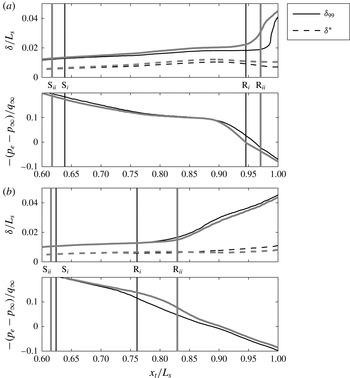
, respectively. The data for the smooth airfoil (case i) in figure 7(a,c) are contrasted with those for the pressure side tripped case (case ii) in figure 7(b,d). Additionally, the estimated separation (S) and reattachment point (R) locations are indicated. For the same cases, figure 8 shows the time-averaged boundary layer parameters: boundary layer thickness
 ${\it\delta}_{99}$
based on 99 % of the edge velocity
 $u_{e}$
, displacement thickness
 ${\it\delta}^{\star }$
, and the pressure coefficient based on the edge velocity velocity
 $c_{p}=(p_{e}-p_{\infty })/q_{\infty }$
, where
 $p_{e}=p_{\infty }-1/2{\it\rho}u_{e}^{2}$
,
 $q_{\infty }=1/2{\it\rho}u_{\infty }^{2}$
, and
 $p_{\infty }$
is the static pressure in the free stream.
Time-averaged
 $\overline{u_{t}}$
and r.m.s. of velocity components
 $\text{r.m.s.}(u_{t})$
,
 $\text{r.m.s.}(u_{n})$
on the suction side. (a,c) Smooth airfoil, and (b,d) with pressure side tripped; (a,b)
 $\mathit{Re}_{c}=1.3\times 10^{5}$
, (c,d)
 $\mathit{Re}_{c}=2.05\times 10^{5}$
.

Boundary layer parameters and pressure coefficient based on edge velocity
 $u_{e}$
for the suction side for the smooth (grey lines) and tripped conditions (black) and for (a)
 $\mathit{Re}_{c}=1.3\times 10^{5}$
and (b)
 $\mathit{Re}_{c}=2.05\times 10^{5}$
.

At the lower Reynolds number (figure 7
a,b), where tonal emissions are produced in both configurations, the position of the separation bubble and its extent do not change significantly between the two cases. The boundary layer separates at
 $x_{t}/L_{s}=0.64$
(case i) and 0.62 (case ii). Reattachment occurs just upstream of the trailing edge at
 $x_{t}/L_{s}=0.95$
(case i) and 0.97 (case ii). In agreement with these results, Arcondoulis et al. (Reference Arcondoulis, Doolan, Zander and Brooks2013) found separation to occur at 65 % chord for a NACA 0012 airfoil and similar flow conditions (
 ${\it\alpha}_{eff}=1.58^{\circ }$
,
 $\mathit{Re}_{c}=1.5\times 10^{5}$
). Similarly to the separation bubble location, the pressure coefficient (figure 8
a) is virtually identical over approximately 80 % of the separation bubble length. These similarities indicate that acoustic excitation has a similar effect for both cases on the locations of separation and transition. A steep increase in velocity fluctuations is found near
 $x_{t}/L_{s}=0.85$
. This point is located at about two-thirds of the path length between separation and reattachment. Minor changes in the growth of disturbance amplitude can be deduced from the r.m.s. fluctuations and are attributed primarily to the slight reduction in the sound pressure level of acoustic excitation for case (ii) (figure 4).
Time sequences of spanwise vorticity fields
 ${\it\omega}_{z}$
on the suction side. The temporal separation between two consecutive images is
 $0.33~\text{ms}$
. (a,c) Smooth airfoil, and (b,d) with pressure side tripped; (a,b)
 $\mathit{Re}_{c}=1.3\times 10^{5}$
, (c,d)
 $\mathit{Re}_{c}=2.05\times 10^{5}$
.

In contrast, significant changes are observed in the results for the higher Reynolds number case,
 $\mathit{Re}_{c}=2.05\times 10^{5}$
(figure 7
c,d). The boundary layer separates near
 $x_{t}/L_{s}=0.62$
(cases i and ii), but reattaches at
 $x_{t}/L_{s}=0.76$
for the smooth case (case i) and significantly further downstream (
 $x_{t}/L_{s}=0.83$
) if the pressure side is tripped (case ii). Thus, with respect to the lower Reynolds number case (figure 7
a,b), the overall separation bubble shrinks significantly, a trend that is reported in previous studies (Boutilier & Yarusevych Reference Boutilier and Yarusevych2012b
). The extent of the separation bubble increases significantly with the pressure side tripped (case ii). This is attributed to an earlier onset of transition, marked by a steep increase of the amplitude of velocity fluctuations near
 $x_{t}/L_{s}=0.7$
(case i) and
 $x_{t}/L_{s}=0.75$
(case ii), which indicates that transition occurs further downstream with the pressure side tripped (case ii). Figure 4 showed that tripping the pressure side boundary layer (case ii) effectively eliminates strong tonal noise at this Reynolds number (
 $\mathit{Re}_{c}=2.05\times 10^{5}$
). The absence of acoustic excitation delays transition and consequently reattachment in case (ii) (figure 7
c,d), causing the significant increase in the shedding frequency
 $f_{sh}$
of the roll-up vortices on the suction side (figure 6). The difference in the structure of the separation bubble is supported by the boundary layer parameters presented in figure 8(b), which shows that pressure recovery is delayed and the pressure gradient remains moderate farther downstream with the tripping device applied (case ii). In summary, the results illustrate that the acoustic excitation induces notable changes to the time-averaged parameters of the separation bubble. The effect of the natural tonal excitation observed here is similar to that seen in experiments involving control of flow development on an airfoil in low Reynolds number flows with acoustic forcing (Yarusevych et al.
Reference Yarusevych, Sullivan and Kawall2007).
3.3. Temporal evolution of unstable disturbances
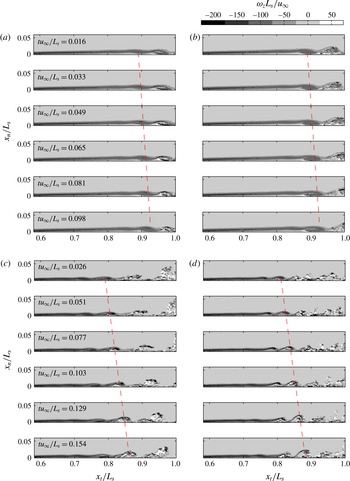
Figure 9 shows time sequences of spanwise vorticity fields
 ${\it\omega}_{z}L_{s}/u_{\infty }$
, depicting the temporal evolution, amplification, and turbulent breakdown of the roll-up vortices in the aft portion of the separation bubble. Figures 9(a,b) and 9(c,d) show the data for the low (
 $\mathit{Re}_{c}=1.3\times 10^{5}$
) and high (
 $\mathit{Re}_{c}=2.05\times 10^{5}$
) Reynolds number cases, respectively. Roll-up of the shear layer becomes clearly visible in figure 9 at the respective location of steep increase in velocity fluctuations seen in figure 7. The dashed lines indicate locations of the constant phase of the fluctuations induced by the convecting vortical structures. Their slopes thus give an indication of the convective velocity
 $u_{c}$
.
For
 $\mathit{Re}_{c}=1.3\times 10^{5}$
(figure 9
a,b), the roll-up occurs at approximately
 $x_{t}/L_{s}=0.85$
. Due to the close agreement between the shedding frequencies
 $f_{sh}$
(figure 6) and similar convective velocity for the two cases at this Reynolds number, the characteristic size of these structures is similar. While an earlier break-up of the roll-up vortices is observed when the pressure side boundary layer is tripped (case ii), coherent vortical structures are swept periodically past the trailing edge in both cases, leading to tonal noise emissions.
As anticipated from the time-averaged results, more significant changes are observed for
 $\mathit{Re}_{c}=2.05\times 10^{5}$
(figure 9
c,d). The presence of strong tonal excitation for the smooth airfoil (case i) leads to earlier shear layer roll-up. The characteristic wavelength of the structures is notably larger for the smooth airfoil (case i) compared to the tripped case (case ii). This condition complies with the frequency of the structures for case (i) being lower than that attained with the pressure side boundary layer tripped (figure 6), given similar convective velocities for the two cases (figure 9). Roll-up vortices become less coherent upstream of the trailing edge than those for the lower Reynolds number, which is a manifestation of three-dimensional turbulent break-up and supported by positive vorticity
 ${\it\omega}_{z}$
within vortex cores for
 $x_{t}/L_{s}>0.85$
. As a result of this process, in both cases, only weakly coherent structures convect past the trailing edge on the suction side. Therefore, suction side events have negligible influence on tonal noise generation at this Reynolds number, as seen in acoustic measurements for the corresponding cases presented in figure 4.
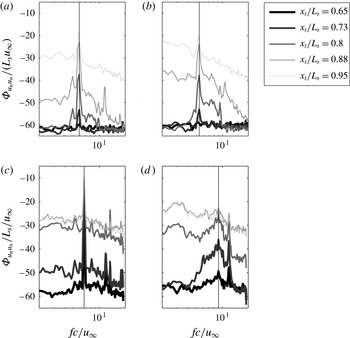
Figure 10 depicts the auto-spectral density of the wall-normal velocity component sampled along the line described by the maximum fluctuations of the wall-tangential velocity component
 $\text{r.m.s.}(u_{t})$
in the separated shear layer. For
 $\mathit{Re}_{c}=1.3\times 10^{5}$
(figure 10
a,b), the spectra show clearly defined peaks at frequency
 $f_{sh}c/u_{\infty }=5.9$
and
 $f_{sh}c/u_{\infty }=5.4$
(indicated by vertical lines) for the smooth and tripped cases (cases i and ii), respectively. In both cases, the auto-spectral density at the shedding frequency increases towards the trailing edge due to amplification of disturbances within the separated shear layer. The spectral energy content becomes distributed over a broader range of frequencies downstream of the shear layer roll-up location (
 $x_{t}/L_{s}>0.85$
, figure 9
a,b), which signifies later stages of transition to turbulence. For the smooth airfoil (case i), the growth of instabilities in the separated shear layer is associated with a narrower frequency band centred on the shedding frequency
 $f_{sh}$
. This indicates a stronger upstream influence due to acoustic excitation (figure 9
a,b). Nevertheless, since the differences in the amplitude of tonal emissions are not substantial for this Reynolds number (figure 4), the shedding frequency does not vary substantially between the two cases. The relatively minor changes in the shedding frequency are attributed to the minor changes in the feedback loop characteristics as well as the effect of mean flow deformation on the stability characteristics of the separated shear layers discussed by Marxen & Rist (Reference Marxen and Rist2010) and Marxen et al. (Reference Marxen, Kotapati, Mittal and Zaki2015).
Auto-spectral density of wall-normal velocity component
 ${\it\Phi}_{u_{n}u_{n}}$
on the suction side. (a,c) Smooth airfoil, and (b,d) with pressure side tripped; (a,b)
 $\mathit{Re}_{c}=1.3\times 10^{5}$
, (c,d)
 $\mathit{Re}_{c}=2.05\times 10^{5}$
.

Consistent with the previously discussed results, the spectra pertaining to
 $\mathit{Re}_{c}=2.05\times 10^{5}$
(figure 10
c,d) show a significant difference in the development of the shear layer disturbances. For the smooth airfoil (case i), the presence of the strong tone causes the growth of shear layer disturbances to lock onto a narrow frequency band centred at the tone frequency (
 $f_{sh}c/u_{\infty }=6.7$
). In contrast, when acoustic excitation due to shedding from the pressure side is suppressed (case ii), shear layer transition is associated with a significantly broader frequency range centred at a higher frequency (
 $f_{sh}c/u_{\infty }=9.1$
). The marked difference in the spectra are reminiscent of those encountered in experiments with forced and unforced transition (Dovgal et al.
Reference Dovgal, Kozlov and Michalke1994), where disturbances lock onto the forcing frequency rather than occurring within a broader wave packet. Thus, unlike the lower Reynolds number case, the suppression of tonal noise production (case ii) leads to significant differences in shear layer transition for this Reynolds number, and, hence, significantly changes bubble characteristics on the suction side.
The dominant velocity perturbations along the centre of the shear layer (maximum
 $\text{r.m.s.}(u_{t})$
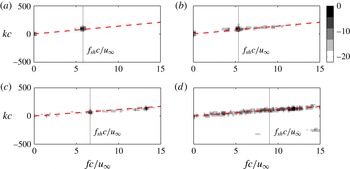
) are induced by the convection of amplified disturbances in the shear layer (figure 9). Figures 11(a,b) and 11(c,d) show the wavenumber–frequency spectrum of the wall-normal velocity component along the line of maximum
 $\text{r.m.s.}(u_{t})$
for
 $\mathit{Re}_{c}=1.3\times 10^{5}$
and
 $\mathit{Re}_{c}=2.05\times 10^{5}$
, respectively. The wavenumber–frequency spectrum was computed by averaging the square modulus of the windowed two-dimensional fast Fourier transform (FFT). In all cases, the energy is concentrated along a line, commonly referred to as the convective ridge (Howe Reference Howe1998) (indicated by the dashed line in figure 11). The convective velocity is related to the slope of the convective ridge as
 $u_{c}=2{\rm\pi}f/k$
. Then, the wavenumber and wavelength associated with the vortical structures shed at
 $f_{sh}$
(see figure 10, marked by the solid line in figure 11) are found as
 $k_{sh}=2{\rm\pi}f_{sh}/u_{c}$
(at the intersection of the dashed and solid lines in figure 11) and
 ${\it\lambda}_{sh}=2{\rm\pi}/k_{sh}$
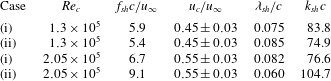
, respectively. Table 2 summarizes the convective velocity, frequency, wavelength, and wavenumber related to the roll-up vortices. For similar flow conditions (
 ${\it\alpha}_{eff}=1.58^{\circ },\mathit{Re}_{c}=1.5\times 10^{5}$
), Arcondoulis et al. (Reference Arcondoulis, Doolan, Zander and Brooks2013) report a convective velocity of
 $u_{c}/u_{\infty }=0.4$
, and similar values are found in other studies (Yarusevych et al.
Reference Yarusevych, Sullivan and Kawall2009; Boutilier & Yarusevych Reference Boutilier and Yarusevych2012c
).
Wavenumber–frequency spectra of wall-normal velocity component
 $u_{n}$
on the suction side (
 $\text{dB}$
scale with respect to maximum value) along the line of maximum
 $\text{r.m.s.}(u_{t})$
on the suction side. (a,c) Smooth airfoil, and (b,d) with pressure side tripped; (a,b)
 $\mathit{Re}_{c}=1.3\times 10^{5}$
, (c,d)
 $\mathit{Re}_{c}=2.05\times 10^{5}$
.

Characteristics of shear layer vortices.

For the high Reynolds number case (
 $\mathit{Re}_{c}=2.05\times 10^{5}$
), a significant change in wavelength was observed with acoustic excitation (figure 9
c,d). The data in table 2 confirm that the change in wavelength is due to the difference in frequency only, while the convective velocity remains constant. It should be noted that a second convective ridge associated with negative wavenumbers in figure 9(c,d) is due to temporal aliasing.
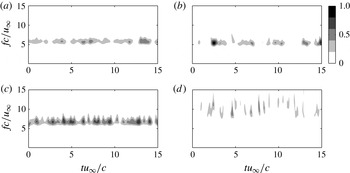
A wavelet analysis employing the Morlet wavelet is used to investigate temporal variations in the energy content and frequency of fluctuations in the shear layer (Torrence & Compo Reference Torrence and Compo1998). Here, the analysis is applied to the wall-normal velocity fluctuations
 $u_{n}$
along the line of maximum wall-tangent velocity fluctuations
 $\text{r.m.s.}(u_{t})$
(i.e. the same data as used for wavenumber–frequency analysis, figure 11). The modulus of the normalized wavelet coefficients is depicted in figures 12(a,b) and 12(c,d) for
 $\mathit{Re}_{c}=1.3\times 10^{5}$
and
 $\mathit{Re}_{c}=2.05\times 10^{5}$
, respectively. At the lower Reynolds number (figure 12
a,b), the frequency and energy content associated with the roll-up vortices exhibit comparatively small temporal variations. Larger variations in both of these characteristics are observed when the boundary layer on the pressure side is tripped (case ii). A similar trend is observed for
 $\mathit{Re}_{c}=2.05\times 10^{5}$
(figure 12
c,d). However, while the variations in frequency for the smooth airfoil (case i) are comparable to those observed for the lower Reynolds number (figure 12
a,b), the absence of acoustic excitation (case ii) leads to significantly larger variations in both the frequency and energy content associated with the dominant flow structures on the suction side. This is consistent with the broader spectral peaks observed in figure 10(c,d) for this case, implying that the strength and frequency of the roll-up vortices undergo significantly more substantial temporal variations in the absence of tonal emissions.
Temporal variation of the modulus of wavelet coefficients for the wall-normal velocity component
 $u_{n}$
(normalized with respect to maximum) along the line of maximum
 $\text{r.m.s.}(u_{t})$
on the suction side. (a,c) Smooth airfoil, and (b,d) with pressure side tripped; (a,b)
 $\mathit{Re}_{c}=1.3\times 10^{5}$
, (c,d)
 $\mathit{Re}_{c}=2.05\times 10^{5}$
.

3.4. Summary of feedback effect
The presented results and analysis indicate that strong mutual interaction can occur between separation bubble development on an airfoil at low Reynolds numbers and trailing edge tonal noise emissions. When a separation bubble is located sufficiently close to the trailing edge, shear layer roll-up vortices can retain sufficient strength and coherence at the trailing edge. Periodic passage of these structures over the trailing edge induces tonal noise emission. The resulting acoustic pressure waves travel upstream and promote separated shear layer transition. As a consequence, the transition process locks onto a narrow frequency band, and a feedback loop is established between the separation bubble and the tonal emissions produced by the shear layer vortices at the trailing edge.
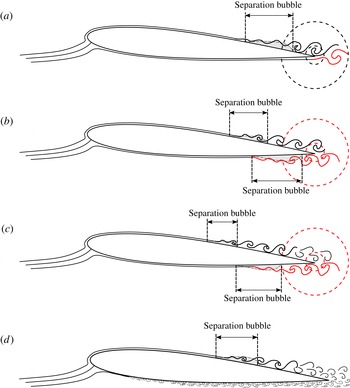
The distinct types of flow development identified in the present study are summarized schematically in figure 13. At lower Reynolds numbers, when the separation bubble does not form on the pressure side, a separation bubble on the suction side is located relatively close to the trailing edge (figure 13
a). The produced shear layer vortices retain sufficient strength and coherence at the trailing edge, generating tonal emission. Upstream propagation of the acoustic pressure waves establishes a feedback loop with the separation bubble. As the Reynolds number is increased, the separation bubble moves upstream. The trend for the shedding frequency on the suction side follows approximately
 $f_{sh}\sim u_{\infty }^{1.6}$
, which matches
 $f_{n_{max}}$
. A similar regime can be obtained, and extended to higher Reynolds numbers, by tripping the boundary layer on the pressure side. With the boundary layer being turbulent on the pressure side, only suction side events can cause tonal noise emission.
Schematics of flow regimes related to separation bubble development on the suction side: (a) suction side dominated trailing edge tone; (b) pressure side dominated trailing edge tone, with contribution from the suction side feedback loop; (c) pressure side dominated trailing edge tone; (d) suction side separation bubble in the absence of significant tonal emissions. Some elements are not drawn to scale.

In the absence of the boundary layer trip, an increase of the Reynolds number eventually leads to separation bubble formation and shear layer roll-up on the pressure side (figure 13
b). Being formed closer to the trailing edge, more coherent roll-up vortices reach the trailing edge on the pressure side. As a result, separated shear layer development on the pressure side takes over tonal noise generation and dominates the frequency selection. Here, a feedback loop is established between the pressure side separation bubble and tonal emission. Moreover, the tonal noise emission also affects the separation bubble development on the suction side, locking the amplification of disturbances and, hence, the shedding frequency
 $f_{sh}$
to that of the primary tone
 $f_{n_{max}}$
. When the separation bubble on the suction side is located sufficiently close to the trailing edge, a second feedback loop is established, as the suction side rollers continue to contribute to the tone generation.
Further increase in Reynolds number causes the separation bubbles to move upstream and shrink further (figure 13
c). The second feedback loop with the suction side separation bubble eventually breaks up, as the suction side roll-up vortices experience turbulent breakdown upstream of the trailing edge and their contribution to tonal noise generation becomes negligible. However, the upstream propagation of acoustic pressure waves, induced by pressure side events, continues to govern the frequency selection for the dominant shear layer disturbances on the suction side. The trend for the shedding frequency on the suction side follows approximately
 $f_{sh}\sim u_{\infty }^{1.3}$
, with minor deviations from that observed for the regime depicted in figure 13(b).
However, if at high Reynolds numbers tonal noise emission is suppressed by the application of a tripping device on the pressure side, flow development on the suction side changes markedly (figure 13
d). Specifically, the shear layer transition process now involves amplification of disturbances in a significantly broader range of frequencies, as expected for unforced transition (figure 10
c,d). The size of the separation bubble and the shedding frequency increase compared to that in the presence of the tone. The shedding frequency increases with increasing free-stream velocity as
 $f_{sh}\sim u_{\infty }^{2.1}$
(figure 6), with the value of the exponent being significantly higher than that observed in the presence of pressure side (figure 13
b,c) or suction side (figure 13
a) acoustic feedback.
The transition between the regimes depicted in figure 13 is probably accompanied by transients. In particular, the analysis of the present results suggests the presence of transient flow development between suction and pressure side dominated regimes (figures 13 a and 13 b) and when the feedback loop breaks on the suction side (figure 13 b,c).
It should be noted that the distinct flow regimes depicted in figure 13 and, more importantly, the progression from one regime to another are defined based on the data obtained in the present investigation specific to a given airfoil model and angle of attack. While some variations in flow development can be expected for different airfoil profiles and angles of incidence, the fundamental physical mechanisms and the associated types of flow development depicted in figure 13 are certainly not unique to the present investigation. The suction side dominated regime (figure 13 a) is expected to occur at relatively low angles of attack, as it requires the formation of a separation bubble close to the trailing edge, which is known to move upstream with increasing angle of attack (Boutilier & Yarusevych Reference Boutilier and Yarusevych2012b ). This is supported by recent acoustic measurements conducted in an anechoic facility by Pröbsting et al. (Reference Pröbsting, Scarano and Morris2015). Finally, the development of a separation bubble on the suction side, which was of particular interest in the present investigation, has been shown to be influenced significantly by tonal emissions. The observed effect of the trailing edge tone on separation bubble development is similar to that reported in flow control investigations involving periodic forcing (Collins & Zelenevitz Reference Collins and Zelenevitz1975; Nishioka et al. Reference Nishioka, Asai and Yoshida1990; Zaman & McKinzie Reference Zaman and McKinzie1991; Yarusevych et al. Reference Yarusevych, Sullivan and Kawall2007), and is thus expected to manifest whenever significant tonal emissions are produced.
The presence of periodic acoustic excitation has been shown to have a significant effect on separation bubble development. Specifically, the tonal forcing of the separated shear layer locks the band of amplified disturbances to the forcing frequency. Similar to external forcing, this promotes transition and leads to the reduction in the size of the separation bubble. The induced changes to the mean flow further cause the separation bubble to move upstream. The trend of the shedding frequency follows
 $f_{sh}\sim \mathit{Re}_{c}^{m}$
, with exponents ranging between
 $m=0.8$
and
 $m=2.1$
, depending on the considered flow regime and Reynolds number range. This range of exponents is similar to that reported for experimental studies of separation bubble dynamics for various profiles by Yarusevych et al. (Reference Yarusevych, Sullivan and Kawall2009). Thus, the possible effect of acoustic feedback on separation bubble development should be considered when conducting experimental studies focused on separation bubble dynamics and comparing data from different investigations.
4. Conclusion
An acoustic feedback due to tonal noise emission on amplified disturbances in a LSB formed on the suction side of an airfoil in low Reynolds number flows was investigated experimentally. The experiments were performed on a NACA 0012 airfoil for a range of chord Reynolds numbers
 $0.65\times 10^{5}\leqslant \mathit{Re}_{c}\leqslant 4.5\times 10^{5}$
and at effective angle of attack
 ${\it\alpha}_{eff}\approx 1.2^{\circ }$
. Time-resolved, two-component PIV measurements were performed simultaneously with surface and far-field microphone measurements to characterize flow development.
For the selected range of experimental conditions, laminar boundary layer separation occurred on both sides of the airfoil. The amplification of disturbances in separated shear layers on either the suction or pressure side (or both) leads to shear layer roll-up and shedding of vortices from separation bubbles. When these structures form sufficiently close to the trailing edge and retain sufficient strength and coherence, their passage over the trailing edge leads to strongly periodic pressure fluctuations. Feedback of acoustic pressure waves, in turn, affects the amplification of unstable disturbances in the separated shear layer. Through the feedback between the acoustic pressure waves and the shear layer transition process, the frequency band of amplified disturbances narrows significantly and the shedding frequency locks to the frequency of the tone. As a result, the transition process is promoted and, consequently, overall separation bubble characteristics are altered. The effect is similar to that due to external periodic forcing observed in previous studies.
At higher Reynolds numbers, when separated shear layer roll-up occurs on both the suction and pressure side, the unsteady flow development on the pressure side defines the characteristic frequency of pressure fluctuations, thereby affecting the disturbance spectrum on the suction side. This is due to the closer proximity of the pressure side separation bubble to the trailing edge, leading to the passage of more coherent vortices over the trailing edge. Under such conditions, the shedding frequency on the suction side locks onto the frequency of the tone, which is imposed by the shedding frequency of pressure side events.
At lower Reynolds numbers, when a separation bubble does not form on the pressure side and roll-up does not occur upstream of the trailing edge, or when it is suppressed by tripping the boundary layer, tonal emissions can be produced due to suction side separated shear layer vortices. In this case, a strong feedback effect is also established between the tonal emissions and the shear layer transition on the suction side. At the intermediate range of Reynolds numbers, when the roll-up occurs on the pressure side and the suction side bubble is located sufficiently close to the trailing edge, strong shedding occurs over the trailing edge from both the suction and pressure side. In this regime, the tone production is influenced by the events on both sides of the airfoil and by their interaction.
The results illustrate that the formation of periodic, coherent structures in the aft portion of a separation bubble not only plays a critical role in the transition process but can also establish acoustic feedback. This is shown to affect the selection of the dominant frequency of the shear layer disturbances and separation bubble characteristics. While the observed effect is expected to occur only at relatively low angles of attack, it can have a profound influence on flow development and, thus, must be considered in studies on low Reynolds number airfoils, in general, and those focused on separation bubble dynamics, in particular.
Acknowledgements
The authors gratefully acknowledge the Natural Sciences and Engineering Research Council of Canada (NSERC) and TU Delft for funding this work. The authors also express gratitude to Professor F. Scarano for his support. This research is supported by the European Community’s Seventh Framework Programme (FP7/2007-2013) under the AFDAR project (Advanced Flow Diagnostics for Aeronautical Research), grant agreement no. 265695.