INTRODUCTION
Earth observation (EO) has become fundamental to achieving sustainable development (Group on Earth Observations 2005). Studies have started to examine the benefits of global earth observation (Pricewaterhouse Coopers 2006; Fritz et al. Reference Fritz, Scholes, Obersteiner, Bouma and Reyers2008; Trapp et al. Reference Trapp, Schneider, McCallum, Fritz, Schill, Borzacchiello, Heumesser and Craglia2012), however, there have been no comprehensive assessments of their economic, social and environmental benefits to date. The development of a high-quality, timely and comprehensive global earth observation system of systems (GEOSS), to include a global biodiversity observation system, would create a mechanism to integrate biodiversity data with other observations more effectively, leverage investments in local to national research and observation projects, and provide networks for global analysis and modelling. To evaluate the status of biodiversity and to determine how current conservation efforts can be improved, biodiversity monitoring is crucial (Balmford et al. Reference Balmford, Bennun, ten Brink, Cooper, Cote, Crane, Dobson, Dudley, Dutton, Green, Gregory, Harrison, Kennedy, Kremen, Leader-Williams, Lovejoy, Mace, May, Mayaux, Morling, Phillips, Redford, Ricketts, Rodriguez, Sanjayan, Schei, van Jaarsveld and Walther2005; Muchoney Reference Muchoney2008). For example, there are proposals to establish global biodiversity monitoring systems (Pereira & Cooper Reference Pereira and Cooper2006; Scholes et al. Reference Scholes, Mace, Turner, Geller, Jürgens, Larigauderie, Muchoney, Walther and Mooney2008) that include, harmonize and expand on current monitoring activities (Henry et al. Reference Henry, Lengyel, Nowicki, Julliard, Clobert, Celik, Gruber, Schmeller, Babij and Henle2008). Herold et al. (Reference Herold, Woodcock, Loveland, Townshend, Brady, Steenmans and Schmullius2008) and Muchoney and Williams (Reference Muchoney and Williams2010) identified global land-cover observations as being of high importance for biodiversity conservation.
This study contributes to the benefit assessment of EO in the realm of biodiversity and ecosystems. We specifically investigated conservation plans for European freshwater wetlands. Systematic conservation planning provides tools to identify optimally located priority areas for conservation (Margules & Pressey Reference Margules and Pressey2000; Possingham et al. Reference Possingham, Ball, Andelman, Ferson and Burgman2000). However, efficient land allocation is only possible when these tools are used with adequate and reliable data.
An important element of data quality relates to spatial resolution. Several empirical studies have evaluated the effects of the spatial scale of databases on conservation plans (Andelman & Willig Reference Andelman and Willig2002; Warman et al. Reference Warman, Sinclair, Scudder, Klinkenberg and Pressey2004; Arponen et al. Reference Arponen, Lehtomaki, Leppanen, Tomppo and Moilanen2012; Hermoso & Kennard Reference Hermoso and Kennard2012). However, the nature and severity of impacts of data quality on conservation outcomes are still not well understood (Grand et al. Reference Grand, Cummings, Rebelo, Ricketts and Neel2007; Hermoso & Kennard Reference Hermoso and Kennard2012). Arponen et al. (Reference Arponen, Lehtomaki, Leppanen, Tomppo and Moilanen2012) concluded that fine-resolution analyses at large spatial extents were computationally feasible and gave more flexibility to the implementation of reserve networks. In this study, we focused on two data categories that are important for wetland biodiversity conservation planning. These were (1) data on the distribution of existing and potential wetland habitat areas and (2) land rent data. We found there were significant limitations in the available and widely used datasets on these topics. We found that no consistent adequately-resolved records of the geographical distribution of wetland areas in Europe existed. The spatial characteristics of European wetlands were only well known for selected large wetland areas or wetlands of special ecological interest (Merot et al. Reference Merot, Squividant, Aurousseau, Hefting, Burt, Maitr, Kruk, Butturini, Thenail and Viaud2003). Furthermore, country statistics differ in spatial accuracy, reliability, acquisition method and class definition. At present, CORINE (Coordination of Information on the Environment; EEA [European Environment Agency] 2000) is the most detailed land cover database for the European Union. However, wetland areas are not aggregated within a single class, but are integrated within various different classes, such as ‘forests’, ‘moors and heathland’, ‘inland marshes’ or ‘natural grassland’. Identification of wetlands within these classes is only possible with further analyses (see Schleupner Reference Schleupner, Taniar, Gervasi, Murgante, Pardede and Apduhan2010). The digital map of the potential natural vegetation of Europe (Bohn & Neuhäusel et al. Reference Bohn, Neuhäusel, Gollub, Hettwer, Neuhäuslová, Raus, Schlüter and Weber2003) shows a detailed classification and potential distribution of wetland vegetation types across Europe, however this distribution does not account for human influences such as river regulation, peat extraction or urbanization, which may substantially impair wetland restoration. Given these limitations, a necessary step is to develop fine-scale wetland data representing the current situation of Europe's wetlands. Accurate data on land rents are also required to estimate the cost of habitat protection. Spatial aspects of economic data seldom receive the same attention in conservation planning as the spatial scale of biodiversity data. Andelman and Willig (Reference Andelman and Willig2002) analysed the effects of the scale of species occurrence data on reserve selection, however they set all site costs to a value of one. In a similar study on the effect of species’ data resolution on conservation outputs, Hermoso and Kennard (Reference Hermoso and Kennard2012) used constant costs across all planning units. Grantham et al. (Reference Grantham, Moilanen, Wilson, Pressey, Rebelo and Possingham2008) evaluated the benefits of additional biodiversity data by analysing the return on investment. They acknowledged that not only biodiversity, but also economic data were likely to be highly variable across planning units, but yet assumed uniform costs across their study area. Richardson et al. (Reference Richardson, Kaiser, Edwards-Jones and Possingham2006) were the first to explicitly consider the issue of socioeconomic data resolution in reserve design. They showed that the implementation of fine-scale economic data in marine conservation planning substantially reduced the monetary losses of fisherfolk. Bode et al. (Reference Bode, Wilson, Brooks, Turner, Mittermeier, McBride, Underwood and Possingham2008) showed that conservation outcomes were sensitive to uncertainty in land cost data, claiming that better data on conservation costs would lead to rapid improvements in the efficiency of conservation spending. European statistics (such as Eurostat, see epp.eurostat.ec.europa.eu/) and models such as the Global Trade Analysis Project (GTAP) model (Lee et al. Reference Lee, Hertel, Rose, Avetisyan, Hertel, Rose and Tol2009) provide comprehensive data on land rents. However, these data are not spatially explicit. To establish geographically more accurate land rent data, we used productivity differences at homogenous response units (HRU; Skalsky et al. Reference Skalsky, Tarasovičova, Balkovič, Schmid, Fuchs, Moltchanova, Kindermann and Scholtz2008).
Obtaining finer scale EO data is costly, and questions arise over whether conservation planning will benefit from the availability of better data. Fritz et al. (Reference Fritz, Scholes, Obersteiner, Bouma and Reyers2008) introduced the benefit-chain-approach to address this issue. A meta-analysis of the return on investment of EO data by Trapp et al. (Reference Trapp, Schneider, McCallum, Fritz, Schill, Borzacchiello, Heumesser and Craglia2012) concluded that the overall expected financial benefits were about four times larger than the associated increased costs produced by using higher resolution spatial data and their infrastructures.
In this study of European wetlands, we consider the impact of data and methodology on land allocation efficiency for biodiversity conservation. We developed specific high-resolution data on European wetland habitats and land rents to replace the coarse spatial datasets frequently used in conservation planning processes, and employed a conservation planning tool that was able to analyse the impacts of differently resolved datasets; we call this the Habitat model. We discuss the different degrees of errors that may result from employing coarse-scale data, and thereby assess the benefits of EO data. We assessed 72 wetland species present across the entire European continent to model the conservation of European wetland biodiversity. To foster their use and further development by the scientific community, the fine-scale datasets we derived are available for download from the internet (see http://www.wetlandresearch.de).
METHODS
Structure of the study
To analyse possible benefits of a finer resolution of EO data in the context of conservation planning in Europe, we chose a specific study setup. The spatial prioritization tool we used for this analysis was the Habitat model (Jantke & Schneider Reference Jantke and Schneider2011). Data on the geographical distribution and spatial extent of valuable habitat types were one important input parameter. A second major external dataset included information on the costs of land to set aside for conservation purposes.
Both datasets were inserted into the Habitat model in coarse-scale and fine-scale versions. The low-quality coarse-scale dataset on habitat data included all land areas except for urban and other sealed off (artificial surface) areas. The Habitat model may allocate all these land areas to species’ reserves, provided that historical records of the respective species existed. The coarse-scale land rent data were taken from the GTAP model (Lee et al. Reference Lee, Hertel, Rose, Avetisyan, Hertel, Rose and Tol2009). These data differ only between countries, not within them. The fine-scale datasets were developed exclusively for this study. We produced spatially explicit wetland habitat areas at 1-km2 resolution and fine-scale land rent data at a resolution of 5ʹ for the European continent.
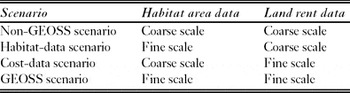
To compare the impacts of these differing datasets, we applied four conservation planning scenarios (Table 1). In the ‘non-GEOSS’ scenario, we used coarse habitat and coarse land rent data, the input data for this setup being available without advances in the field of EO. In the ‘habitat-data’ scenario, we included fine-scale wetland habitat data, but land rents remained uniform within each country. The ‘cost-data’ scenario examined the implementation of fine-scale land rent data alone, with habitat data implemented at the coarse scale. Finally, the ‘GEOSS’ scenario included fine-scale datasets for both land rents and habitat areas.
Quality of habitat and rent data for each model scenario. Coarse-scale habitat data included all land areas (except for urban and other artificial surface areas) without differentiation of habitat types. Coarse-scale land rent data differed only between countries, not within them. Fine-scale habitat data comprised wetland areas at 1-km2 resolution, distinguishing wet forests, wet grasslands, peatlands, water courses and water bodies. Fine-scale land rent data were specific for each country and each HRU at a resolution of 5ʹ.

The Habitat conservation planning model
Model characteristics and input data
Habitat is a deterministic, spatially-explicit mathematical optimization model programmed in general algebraic modelling system (GAMS), solved with a mixed integer programming algorithm from CPLEX version 12.1.
Conceptually, the Habitat model depicts the set-covering problem from systematic conservation planning. Its objective is to minimize total resource expenditure, subject to the constraint that all biodiversity features meet exogenously given conservation targets (Possingham et al. Reference Possingham, Ball, Andelman, Ferson and Burgman2000; McDonnell et al. Reference McDonnell, Possingham, Ball and Cousins2002). In our model, conservation targets account for the two principal conditions of systematic conservation planning: representation and persistence of the biodiversity features (Margules & Pressey Reference Margules and Pressey2000; Sarkar et al. Reference Sarkar, Pressey, Faith, Margules, Fuller, Stoms, Moffett, Wilson, Williams, Williams and Andelman2006). Each representation of a species corresponds to one minimum viable population (MVP) of that species. The land area necessary to sustain a MVP is allocated to habitat types required by that species. In this application of the Habitat model, 10 conservation targets were analysed. Conservation target 10, for example, stands for the cost-effective representation of 10 viable populations of each considered species in a reserve system.
The Habitat model contains many planning units of varying shape and size. The potential habitat area to be selected was specified for each planning unit. There were two possible conservation states indicating whether a planning unit was used as a species’ reserve (1) or not (0). Assigning a planning unit as a species reserve was only possible if this species was historically observed in a planning unit or in its close proximity. Parts of planning units necessary to fulfil conservation targets were selected as reserves. If species’ area requirements could not be fulfilled within a single planning unit, further habitat was selected in adjacent planning units.
Seventy-two wetland vertebrate species of European conservation concern mainly listed in the Birds Directive (79/409/EEC, see URL http://ec.europa.eu/environment/nature/legislation/birdsdirective/index_en.htm) and the Habitats Directive (European Community Directive on the Conservation of Natural Habitats and of Wild Fauna and Flora 92/43/EEC, see URL http://ec.europa.eu/environment/nature/legislation/habitatsdirective/index_en.htm) served as surrogates for biodiversity in our model. The species assemblage included 16 amphibians, four reptiles, 43 breeding birds and nine mammals. Recorded occurrences from species atlases (Gasc et al. Reference Gasc, Cabela, Crnobrnja-Isailovic, Dolmen, Grossenbacher, Haffner, Lescure, Martens, Martínez Rica, Maurin, Oliveira, Sofiandou, Veith and Zuiderwijk1997; Hagemeijer & Blair Reference Hagemeijer and Blair1997; Mitchell-Jones et al. Reference Mitchell-Jones, Amori, Bogdanowicz, Krystufek, Reijnders, Spitzenberger, Stubbe, Thissen, Vohralík and Zima1999) identified their European distributions. The atlas data were provided in the universal transverse mercator (UTM) projection with grid squares of about 50 × 50 km. The non-marine parts of 2725 grid squares encompassing the whole European continent served as planning units in our model. Cyprus, Malta, and the Portuguese and Spanish islands in the Atlantic Ocean were excluded from the analysis due to data deficiencies.
Population density data for all 72 species were equal to the maximum observed densities from a comprehensive literature review. In addition, we used the proposed standards for minimum population sizes from Verboom et al. (Reference Verboom, Foppen, Chardon, Opdam and Luttikhuizen2001) as proxies for MVP size. We distinguished five broad wetland habitat types, namely peatlands, wet forests, wet grasslands, water courses and water bodies. Information on species’ habitat type requirements resulted from literature review (Appendix 1, Table S1, see supplementary material at Journals.cambridge.org/ENC).
Mathematical model structure
The Habitat model, with its sets, variables and exogenous data, used the following notation.
Sets and set mappings: c = {1,. . ., C} is the set of countries, p = {1,. . ., P} is the set of planning units, t = {1,. . ., T} is the set of habitat types, s = {1,. . ., S} is the set of species, u(s, t) identifies the mapping between species and habitat types, and k(s, p, t) represents possible existence of species and habitats in a planning unit.
Variables: O represents total opportunity costs, Zc represents opportunity cost in country c, Yp,t depicts the habitat area for planning unit p and habitat type t in hectares, and Xs,p is a binary variable array, with Xs,p = 1 indicating species s is represented in planning unit p, and Xs,p = 0 otherwise.
Exogenous data: r c,p denotes the annual land rent per hectare in country c and planning unit p, a p,t contains the maximum available area for planning unit p and habitat type t, d s represents species-specific population density data, m s is a species-specific proxy for the MVP size, h t,s determines non-substitutable habitat requirements for habitat type t and species s, t s is the desired representation target for species s, and v s specifies possible deviations from the representation target based on exogenously calculated occurrence maxima.
According to the respective model scenario (Table 1), either the coarse- or the fine-scale datasets were implemented for the parameters r c,p and a p,t.
 \begin{equation}
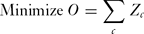
{\rm Minimize}\,O = \sum\limits_c {Z_c }\end{equation}
subject to:
 \begin{equation}
Z_c = \sum\limits_{p,t} {Y_{p,t} } \cdot r_{c,p} \quad {\rm for}\,{\rm all}\,c\end{equation}
 \begin{equation}
Y_{p,t} \le a_{p,t} \quad {\rm for\, all}\,p,t\end{equation}
 \begin{equation}
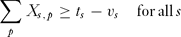
\sum\limits_p {X_{s,p} } \ge t_s - v_s \quad {\rm for}\,{\rm all}\,s\end{equation}
 \begin{equation}
Y_{p,t} \ge h_{t,s} \cdot X_{s,p} \quad {\rm for}\,{\rm all}\,p,t,s\end{equation}
 \begin{equation}
\sum\limits_t {Y_{p,t} } \cdot d_s \left| {_{k(s,p,t) \wedge u(s,t)} } \right. \ge m_s \cdot X_{s,p} \quad {\rm for}\,{\rm all}\,p,s\end{equation}
 \begin{equation}
\sum\limits_{p,t} {Y_{p,t} } \cdot d_s \left| {_{k(s,p,t)} } \right. \ge t_s \cdot m_s \quad {\rm for\, all}\,s.\end{equation}\vskip-3pt
The objective function (Eq. 1) minimizes total costs across all planning units. Equation (2) accounts the total conservation costs in each country as product of habitat area times land rent summed over all planning units. Constraint (3) limits habitat areas in each planning unit to given endowments. Constraint (4) implements representation targets for all species but allows deviations if the number of planning units with occurrence data is below the representation target. Constraint (5) depicts minimum requirements of non-substitutable habitat types for relevant species and planning units. Constraint (6) forces the habitat area for the conservation of a particular species to be large enough to support viable populations of that species. The summation over habitat types depicts the choice between possible habitat alternatives. Constraint (7) ensures that the total population size equals at least the representation target times the MVP size. This constraint was especially relevant for cases where the representation target was higher than the number of available planning units for conservation. For example, a representation target of ten viable populations with possible species occurrences in only nine planning units would thus require one or more planning units to establish enough habitat for more than one viable population. Further versions of this habitat allocation model can be found in Jantke and Schneider (Reference Jantke and Schneider2010), Jantke et al. (Reference Jantke, Schleupner and Schneider2011), and Jantke and Schneider (Reference Jantke and Schneider2011).
Spatially explicit data on European wetlands
This study applied data from the empirical wetland distribution model SWEDI (Spatial Wetland Distribution; Schleupner Reference Schleupner2009, Reference Schleupner, Taniar, Gervasi, Murgante, Pardede and Apduhan2010), which is based on a geographic information system (GIS) and relies on multiple spatial relationships of existing geographical data. Developed as an extraction tool, it denotes wetland allocations in 37 European countries at resolution of 1 km2, distinguishing between existing functional wetlands and sites suitable for wetland restoration by considering recent land use options. The evaluation of existing wetlands relied on a cross-compilation of existing spatial datasets and extraction of spatial wetland information. The determination of potential wetland restoration sites was more complex, involving the integration and interpretation of a variety of GIS datasets by assuming that there is a relationship between environmental gradients (Franklin Reference Franklin1995). Knowledge rules for each biogeographical region were defined based on analysis and observed correlation of independent variables such as climate, hydrology, soil, elevation, and slope to analyse environment-wetland relationships. The information was extracted from spatial data, such as CORINE land cover (EEA 2000), the European Soil Database (Joint Research Centre 2004), BIOCLIM (Busby Reference Busby, Margules and Austin1991), WorldClim (Hijmans et al. Reference Hijmans, Cameron, Parra, Jones and Jarvis2005), Gtopo30 (USGS [United States Geological Survey] 1996), and Potential Natural Vegetation (Bohn & Neuhäusel et al. Reference Bohn, Neuhäusel, Gollub, Hettwer, Neuhäuslová, Raus, Schlüter and Weber2003). Regression parameters that vary across space were estimated with the advantage that they allowed for regional differences in relationships (Miller et al. Reference Miller, Franklin and Aspinall2007). This was especially useful concerning the broad European scale of the model. Urban and other sealed off areas and their direct vicinity were assumed to be unsuitable for wetland restoration. Sites that contained already existing conservation areas like salt marshes or valuable sparsely vegetated areas were also excluded from potential wetland restoration sites. The GIS tool ArcGIS9.3 was used for analysis.
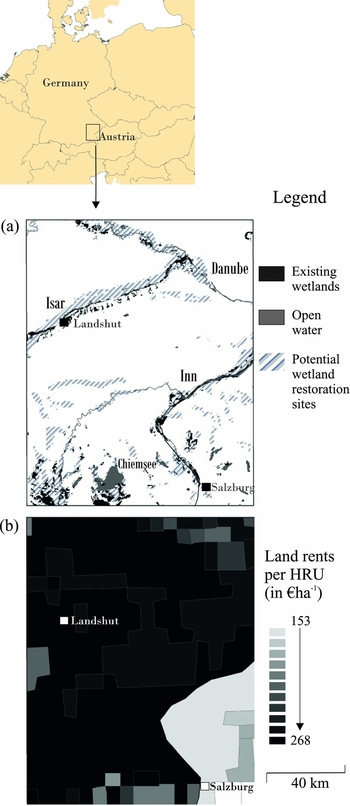
SWEDI distinguished three main wetland types (Fig. 1) that were further sub-divided into five wetland categories: wet forests (alluvial and swamp), wet grasslands (such as reeds and sedges; only one category), and peatlands (bogs and fens). However, most wetland species that were included in the Habitat model also needed open water habitat. Spatial data on the extent of water courses and water bodies were derived from CORINE land cover (EEA 2000) and the Global Lakes and Wetlands Database (GLWD) (Lehner & Döll Reference Lehner and Döll2004).
An example of fine-scale data for south-eastern Germany. (a) Wetland habitats at 1-km2 resolution (source: Schleupner Reference Schleupner2009, Reference Schleupner, Taniar, Gervasi, Murgante, Pardede and Apduhan2010). (b) Land rents at a 5ʹ resolution.

We integrated the fine-scale wetland data in terms of total areas of each wetland habitat type per planning unit. Both existing and wetland areas and sites suitable for restoration were included. The wetland sites were represented by the model parameter a p,t which contains the maximum available area for planning unit p and habitat type t (spatially explicit data on European wetlands are accessible via URL http://www.wetlandresearch.de).
Spatially explicit data on European land rents
Detailed data on land rents covering the entire European continent were estimated at HRU resolution (Fig. 1; Appendix 1, Table S2, see supplementary material at Journals.cambridge.org/ENC for the land rents for all European countries). An HRU is a discrete characterization of land quality with pre-defined ranges on relatively stable attributes at a precision of 5ʹ. We used discrete classifications of altitude, slope and soil texture established through previous research (Skalsky et al. Reference Skalsky, Tarasovičova, Balkovič, Schmid, Fuchs, Moltchanova, Kindermann and Scholtz2008, based on Schmid et al. Reference Schmid, Balkovic, Moltchanova, Skalsky, Poltarska, Müller and Bujnovsky2006; Balkovič et al. Reference Balkovic, Schmid, Bujnovsky, Skalsky and Poltarska2006; Stolbovoy et al. Reference Stolbovoy, Montanarella and Panagos2007). HRUs were delineated on the assumption that within defined ranges of attributes, biophysical processes (such as plant growth or nutrient movement) respond similarly to any set of exogenous impacts (such as rainfall or land management). Available data at HRU level included their spatial extent, biomass yields and environmental impacts on major food and non-food cropping systems. The last data resulted from simulations with the Environmental Policy Integrated Climate (EPIC) model (Izaurralde et al. Reference Izaurralde, Williams, McGill, Rosenberg and Jakas2006; Williams Reference Williams and Singh1995). In addition, we used country specific land rents from the Global Trade Analysis Project (GTAP; Lee et al. Reference Lee, Hertel, Rose, Avetisyan, Hertel, Rose and Tol2009). Based on these data, we approximated detailed land rent data that were unique for each country and HRU.
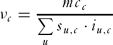
We used the following notation: u = {1,. . .,U) is the set of HRU, c = {1, . . . ,C} is the set of countries, s u,c represents the share of a given HRU u within country c, mr u,c denotes the marginal revenue of land for HRU u in country c, v c is a value parameter representing the difference between the weighted commodity price and all production costs except for the costs of land in country c, i u,c depicts the weighted average yield per hectare for HRU u and country c, mc c represents the marginal costs of land in country c, and mc u,c depicts the marginal costs of land per HRU u in country c.
 \begin{equation}
\sum\limits_u {s_{u,c} \cdot mr_{u,c} } = \sum\limits_u {s_{u,c} \cdot i_{u,c} \cdot \nu _c } = mc_c\end{equation}
 \begin{equation}
\nu _c = \frac{{mc_c }}{{\sum\limits_u {s_{u,c} \cdot i_{u,c} } }}\end{equation}
 \begin{equation}
mc_{u,c} = i_{u,c} \cdot \nu _c\end{equation}\vskip-6pt
Based on classic economic theory for competitive markets, Eq. (8) forced an identity between marginal revenues and marginal costs of land. While the marginal cost of land was given by its rental rate, the marginal revenue per hectare of land equalled yield multiplied by a value parameter, computed via Eq. (9), which depicts the difference between the weighted price of an agricultural or forestry commodity and its production costs. We assumed that this value did not differ within a country. Finally, we used Eq. (10) to compute HRU specific land rents by multiplying HRU specific yields by the value parameter.
In the Habitat model, HRU specific land rents in euro per hectare (Appendix 1, Table S2, see supplementary material at Journals.cambridge.org/ENC) were projected to all planning units. Since the Habitat model did not distinguish different HRU within a planning unit, the land rents in each planning unit were area weighted averages over all contained HRU. The data fed into the model as parameter r c,p, which denotes the annual land rent per hectare in country c and planning unit p (the spatially explicit data on European land rents are accessible via URL http://www.wetlandresearch.de).
Costs of the fine-scale datasets
The fine-scale datasets were generated from the integration of existing and freely available geographical, biophysical and economic data. The rather complex methodology for acquiring the wetland habitat data was originally developed by Schleupner (Reference Schleupner2009) and adjusted to the specific needs of this study. In contrast, the methodology for the estimation of spatially explicit land rent data was exclusively developed for this study. Altogether, the costs of obtaining the new data mainly involved personnel. In particular, the generation of each dataset took approximately one person month. The monthly personnel costs for employing a researcher were c. € 3500 (according to German tariffs for civil service employees TV level 13; see http://oeffentlicher-dienst.info/tv-l/). Thus, the total costs of obtaining the two datasets were estimated at € 7000. We used this information to compare costs and benefits of using EO data for conservation planning.
RESULTS
Costs of habitat protection and area requirements
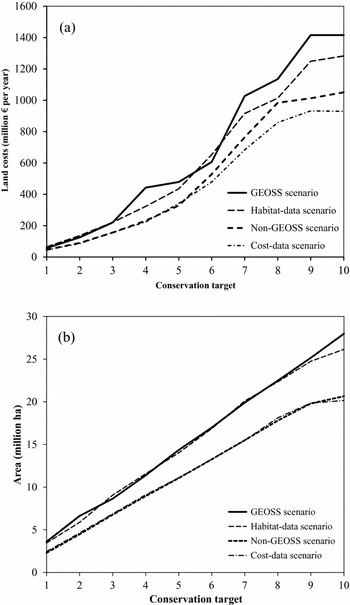
Annual costs for renting the land needed for habitat protection differed substantially between scenarios (Fig. 2a). The implementation of detailed wetland habitat data in the habitat-data scenario incurred a mean increase of 29.8 % in costs of habitat protection compared to the baseline non-GEOSS scenario. Conversely, integrating detailed land rent data in the cost-data scenario led to an average cost reduction of 5.9 %, because heterogeneous land rents within countries provided opportunities to select regions with below-average rents and avoid regions with above-average rents. Considering both factors simultaneously in the GEOSS scenario, total land costs for habitat protection were on average 38.1 % higher than those of the non-GEOSS scenario.
Costs of habitat protection and reserve area requirements for conserving 72 European wetland species. A conservation target stands for the protection of the corresponding number of viable populations of all species. (a) Annual land costs for acquiring reserve areas. (b) Required reserve areas.

Fine-scale land rent data in the cost-data scenario did not notably influence the extent of conservation areas compared to the baseline non-GEOSS scenario (Fig. 2b). However, the implementation of fine-scale wetland data shown in the habitat-data scenario implied higher overall area requirements. The reserve areas of the habitat-data and the GEOSS scenarios were on average approximately one-third higher than the baseline scenario, due to the habitat type specifications that restricted reserve allocation to given endowments. With detailed wetland habitat area data, the model could not exploit habitat synergies (one habitat simultaneously protecting multiple species) as successfully as the coarse datasets.
Initially, it may seem as if better resolved land cover and land rent data (for example in the GEOSS scenario) led to higher costs of habitat protection and higher overall area requirements for achieving the same conservation target (Fig. 2). Thus, an investment in EO data may seem counterproductive. However, closer examination revealed that the displayed costs and area shares could not be compared directly. In all scenarios with coarse-scale datasets, the Habitat model only had limited information on habitat locations and/or land rents due to the coarse input data. These shortcomings led to severe underestimations in conservation costs and area requirements.
Shortcomings of coarse-scale data
The cost estimates (Fig. 2a) for scenarios with coarse-scale data were biased and did not represent the true total costs of habitat protection because incorrect data on habitat endowments and/or incorrect land rents were used. In addition, coarse-data solutions resulted in inefficient land allocations because the conservation planning model could place habitats in unsuitable or expensive locations. The analytical bias in coarse-scale data was obvious when we corrected the results estimated under the non-GEOSS scenario to account for the two different types of fine-scale data (Figs 3 and 4). Technically, we used the sizes and locations of the conservation areas determined under the setup with coarse-scale data. We then recalculated conservation costs and target achievement using the fine-scale data models (cost-data and habitat-data scenarios) to quantify the shortcomings of the coarse datasets.
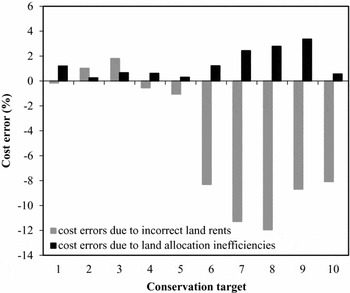
Shortcomings of coarse-scale land rent data: errors in estimating conservation budgets. Shown are cost errors of the non-GEOSS scenario in relation to the cost-data scenario.

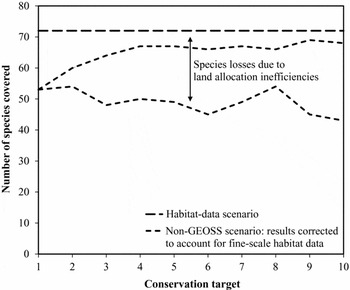
Shortcomings of coarse-scale habitat data: losses of species coverage. The upper line shows the number of species (n = 72) that should be covered under all scenarios. The middle dashed line shows species actually covered under the non-GEOSS scenario when analysed with the fine-scale habitat data. The lower dashed line shows species that are covered for each conservation target in the non-GEOSS scenario.

In the case of land rent data, shortcomings of coarse-scale data implied errors in the estimation of conservation budgets (Fig. 3). There were two types of errors in the estimations based on coarse data and the cost errors were partly opposed (Fig. 3). First, misspecification of conservation costs in the non-GEOSS scenario due to incorrect land rents ranged from –11.9 to +1.8 % (Fig. 3), depicting the relative differences between the habitat costs of the non-GEOSS and the cost-data scenarios (Fig. 2a). For eight out of 10 conservation targets, the cost error was negative. Thus, the costs of habitat protection in the non-GEOSS scenario were overestimated by up to 11.9 % because the coarse land rent data masked the heterogeneity of land costs within countries. Second, cost errors due to land allocation inefficiencies ranged from +0.3 to +3.4 % (Fig. 3). Thus, the costs of habitat protection were continuously underestimated in the non-GEOSS scenario due to land allocation inefficiencies. With the coarse data on land rents, the model could place reserves in expensive regions of a country.
For habitat data, shortcomings of coarse-scale data in the non-GEOSS scenario implied losses in species coverage (Fig. 4). Analysing sizes and locations of reserves from the non-GEOSS scenario with the help of the fine-scale wetland data revealed that several species were not able to meet the respective conservation targets. The species losses due to incorrect habitat data were substantial. In the non-GEOSS scenario, only 43–53 species out of 72 were covered according to the respective conservation target. Several species (3–19) were not covered at all throughout the targets, the reason being that with coarse-scale habitat data, the model exploited more habitat synergies (one habitat simultaneously protecting multiple species) than were actually possible.
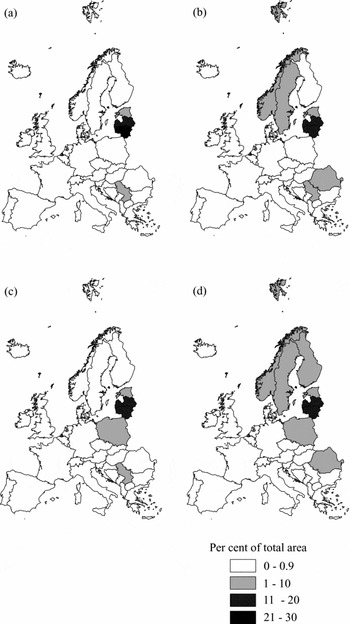
Regional allocation of conservation areas
Application of fine-scale data also affected regional reserve allocation between European countries. For example, for conservation target 5, five viable populations of each of the 72 wetland species were protected (Fig. 5). The required wetland area was largely distributed between 4–8 countries out of 37 in all four scenarios. In the non-GEOSS scenario, with coarse data on both wetland habitats and land rents, reserves were allocated mainly to Serbia and the Baltic states of Estonia, Latvia and Lithuania. These countries are rich in wetland-dependent species and provide comparably low land rents. The more realistic fine-scale wetland data in the habitat-data scenario implied a spreading of the total required area across more countries. Three countries, namely Norway, Sweden and Romania, were allocated more species reserves than in the non-GEOSS scenario. The application of spatially explicit data on land rents in the cost-data scenario did not have such a notable impact on the country scope but led to changes in reserve shares between regions. For instance, in Poland, more wetland reserves were established than before.
Allocation of habitat area to European countries using conservation target 5 as an example. (a) Non-GEOSS scenario. (b) Habitat-data scenario. (c) Cost-data scenario. (d) GEOSS scenario.

DISCUSSION
This study corroborates that the value of conservation planning tools (Margules & Pressey Reference Margules and Pressey2000; Possingham et al. Reference Possingham, Ball, Andelman, Ferson and Burgman2000) depends on the availability and spatial resolution of required data. Coarse or incomplete data on biodiversity and socioeconomic aspects may hinder the effective allocation of conservation resources (Grand et al. Reference Grand, Cummings, Rebelo, Ricketts and Neel2007; Bode et al. Reference Bode, Wilson, Brooks, Turner, Mittermeier, McBride, Underwood and Possingham2008; Reside et al. Reference Reside, Watson, VanDerWal and Kutt2011).
However, the benefits of improved data come at the costs of acquiring them. The real question of importance is whether the benefits from improved conservation plans outweigh the expenditure on better data. For instance, the costs of habitat protection for conserving only one viable population of each of the 72 included wetland species is estimated at € 45 million per year for the non-GEOSS scenario with coarse-scale datasets (Fig. 2a). The analysis of this solution with the fine-scale data reveals that 19 species were erroneously omitted from the proposed reserve system (Fig. 4) and that costs and habitat area requirement were inaccurately estimated (Fig. 3). Conversely, the cost of acquiring the fine-scale data on land rent and wetland habitats was € 7000. While the land rent has to be paid yearly, the investment on better data is made only once. Taking into consideration the magnitude of errors related to the coarse-scale data (Fig. 3) and the shortcomings of target achievement (Fig. 4), the benefits to conservation do essentially exceed the costs of acquiring better data. Trapp et al. (Reference Trapp, Schneider, McCallum, Fritz, Schill, Borzacchiello, Heumesser and Craglia2012) showed that the financial benefits achieved by using EO data from a range of studies were on average four times larger than the costs.
A specific aspect of the Habitat model in this context is the endogenous representation of reserve sizes (see also Jantke et al. Reference Jantke, Schleupner and Schneider2011). Common reserve selection tools apply the basic formulation of the set-covering problem from operations research, where planning units are only selectable in their entirety as priority areas for conservation (see Early & Thomas Reference Early and Thomas2007; Tognelli et al. Reference Tognelli, de Arellano and Marquet2008; Nhancale & Smith Reference Nhancale and Smith2011). However, there is a considerable gap between the resolution of European-wide species occurrence data and the land area available for conservation purposes in Europe. Therefore, the Habitat model selects only those fractions of a planning unit which are necessary to fulfil the respective conservation target and are theoretically available for reservation under the given land-use pattern. If species’ area requirements cannot be fulfilled within a single planning unit, further habitat is selected in adjacent planning units. Marianov et al. (Reference Marianov, ReVelle and Snyder2008) proposed a method to select reserves for species with differential habitat size needs exceeding planning units’ areas. Our approach goes beyond that by also considering the fact that species’ area requirements may be smaller than a planning unit's area. The total area selected as priority area for conservation in a planning unit considers MVP sizes of all species protected in it. This procedure allows easy implementation of planning units with varying sizes. Thus, the Habitat model does not only address persistence criterions directly, but also does this regardless of the planning unit's size. When better resolved species distribution data are available for Europe, the analyses could easily be refined.
There were both advances and limitations in the data generated. The empirical distribution model of wetland ecosystems at the European scale (SWEDI) distinguishes several wetland types. For the determination of existing wetland locations, several spatial datasets were jointly analysed. Potential wetland restoration sites were evaluated through geographic data analysis using rule-based statements (Schleupner Reference Schleupner, Taniar, Gervasi, Murgante, Pardede and Apduhan2010). The orientation towards physical parameters and the allowance of overlapping wetland types within the suitable restoration areas characterizes the SWEDI model. However, the accuracy of SWEDI model results is strongly restricted by the availability and quality of geographical data. Soil information is generally poor and often misleading with regard to wetland functionality. Another uncertainty involves the current state of existing wetland ecosystems. SWEDI is unable to assess the naturalness of the site. Nevertheless, validation with independent datasets of wetland biotopes, such as RAMSAR sites, corroborated the high accuracy of the existing wetland sites in SWEDI (see Schleupner Reference Schleupner2009).
The second dataset generated for this study included land rents at a 5ʹ resolution based on HRUs, which arranged heterogeneous land attributes into discrete classes. Each combination of altitude, soil and slope class was considered to be unique. However, within a certain class element, the response was considered to be homogenous. Thus, depending on the number of classes for each attribute, HRUs involved more or less approximation error. For example, the first altitude class of our classification scheme ranged from the lowest level to 300 m above sea level. All locations within this range were represented through the same weighted average altitude value. Furthermore, we used weighted, productivity-based, marginal value differences as proxies for differences in land rental values between HRUs. In reality, other factors related to markets and local policies may influence local land rental values. Thus, our approach must be interpreted as a first approximation until comprehensive land rent data for Europe are available. To foster the further development of such data by the scientific community, we publish the applied fine-scale datasets together with this study.
Another limitation in our analysis was that species occurrence data were used with only one resolution in our model, the reason being that comprehensive data with a resolution higher than UTM 50 were not available for Europe. An option to overcome this constraint in future studies would be to predict species distributions at finer spatial scales (see Araujo et al. Reference Araujo, Thuiller, Williams and Reginster2005; McPherson et al. Reference McPherson, Jetz and Rogers2006; Barbosa et al. Reference Barbosa, Real and Vargas2010).
Several simplifications of the Habitat model should also be noted (see also Jantke & Schneider Reference Jantke and Schneider2010 for a detailed description). First, we included only land opportunity costs from acquiring land for conservation, whereas there are important additional costs, such as costs of reserve establishment and maintenance (Naidoo et al. Reference Naidoo, Balmford, Ferraro, Polasky, Ricketts and Rouget2006). As we included sites suitable for wetland restoration in our analysis, further costs are related to the rehabilitation of wetland habitats. Second, we did not account for spatial reserve design criterions like connectivity or compactness and did not consider spatio-temporal aspects of persistence.
CONCLUSIONS
The costs of habitat protection may be severely underestimated when conservation planning relies on coarse-scale data. Benefits of EO data for conservation planning encompass more accurate estimations of area requirements for conservation and of habitat protection costs. Fine-scale habitat data ensure better coverage of the species of conservation concern in the conservation plan. Heterogeneous land rents within countries provide opportunities to select regions with below average rents and avoid regions with above average rents. In our study, we found that the conservation benefits achieved far outweighed the costs of acquiring fine-scale data.
ACKNOWLEDGEMENTS
We thank the many volunteer fieldworkers who contributed to the species atlas records. The helpful comments of three anonymous reviewers on earlier versions of the manuscript greatly improved the paper. This study has received financial support from the Michael Otto Foundation for Environmental Protection, the cluster of excellence Integrated Climate System Analysis and Prediction (CliSAP) and the European Commission through the FP6 projects, European Non-Food Agriculture (ENFA), Global Earth Observation – Benefit Estimation: Now, Next and Emerging (GEOBENE), and the FP7 project, A European approach to GEOSS (EUROGEOSS).