1 Introduction
Nature has endowed a wide variety of efficient locomotion mechanisms pertinent to marine and aerial life for predator evasion, food search, navigation and migration. Amongst them, flapping is one of the most prevalent modes of biological propulsion and can be broadly classified into (i) undulatory motion and (ii) oscillatory motion (Alexander Reference Alexander2003; Taylor, Triantafyllou & Tropea Reference Taylor, Triantafyllou and Tropea2010). The former is predominantly utilized by the aquatic animals and involves the movement or propagation of a wave along the entire body or the caudal fin (posterior part) for onward translation (Evans & Claiborne Reference Evans and Claiborne2005). The latter stimulates propulsion via the reciprocating motion of appendages (wings or pectoral fins) about the point of attachment or hinge and is primarily employed by the airborne animals. Unlike aquatic or swimming animals which are neutrally buoyant, flying animals have to simultaneously do a twofold job of staying aloft (to balance the weight) and generate thrust (to propel forward) (Taylor et al. Reference Taylor, Triantafyllou and Tropea2010). Based upon investigations utilizing a quasi-steady and time-dependent framework, new insights into mechanisms of lift and thrust generation have been gained (Ellington Reference Ellington1984a ,Reference Ellington b ; Dickinson & Gotz Reference Dickinson and Gotz1993; Ellington et al. Reference Ellington, Van Den Berg, Willmott and Thomas1996; Sane Reference Sane2003; Alexander Reference Alexander2004; Shyy et al. Reference Shyy, Aono, Chimakurthi, Trizila, Kang, Cesnik and Liu2010, Reference Shyy, Aono, Kang and Liu2013, Reference Shyy, Kang, Chirarattananon, Ravi and Liu2016).
For birds and insects, the composition and morphology of their skeletal and wing structures are contrasting and diverse. The flapping actuation of birds is distributed along the wing as their muscles, attached to the bones, run through the entire span and enable flexing in both span- and chord-wise directions, the phenomenon often termed active flexing or bending (Alexander Reference Alexander2003; Taylor et al. Reference Taylor, Triantafyllou and Tropea2010). On the contrary, insect wings lack any internal muscles and bone structure due to which the entire flapping is localized and actuated only from the base (Brodsky Reference Brodsky1994; Dudley Reference Dudley2002; Alexander Reference Alexander2003). Thus, the physiology of an insect wing inhibits chord- and span-wise flexing and is often termed passive as the extent of bending is predominantly governed by the balance between aerodynamic, structural inertia and stiffness forces. Despite their passive wing flexibility, insects are bestowed with similar manoeuvrability, navigation and flight control as displayed by birds (Alexander Reference Alexander2003, Reference Alexander2004). Moreover, insect wing structures, being lighter relative to their body weight, have stimulated scientists and engineers towards a deeper examination of their flight to design the next generation of flapping wing micro air vehicles (MAVs) that includes recent developments such as the Nano Hummingbird (Keennon et al. Reference Keennon, Klingebiel, Won and Andriukov2012) and microrobot (Fuller et al. Reference Fuller, Karpelson, Censi, Ma and Wood2014; Ma, Chirarattananon & Wood Reference Ma, Chirarattananon and Wood2015).
In this regard, the scientific understanding of how passive flexibility affects aerodynamic and propulsive performance of a flapping wing has been a subject of active research through experimental, analytical and numerical studies being performed. All of these studies indicated condition-dependent improvement in propulsive performance with flexible wings in comparison to their rigid counterparts. Moreover, the key areas touched upon in these studies mainly revolved around (i) the behaviour of vortex shedding, bending pattern and comparison of energy/power requirements and lift/drag generation with change in stiffness (Katz & Weihs Reference Katz and Weihs1978, Reference Katz and Weihs1979; Prempraneerach, Hover & Triantafyllou Reference Prempraneerach, Hover and Triantafyllou2003; Heathcote, Martin & Gursul Reference Heathcote, Martin and Gursul2004; Heathcote & Gursul Reference Heathcote and Gursul2007; Toomey & Eldredge Reference Toomey and Eldredge2008; Ishihara, Horie & Denda Reference Ishihara, Horie and Denda2009; Vanella et al. Reference Vanella, Fitzgerald, Preidikman, Balaras and Balachandran2009; Eldredge, Toomey & Medina Reference Eldredge, Toomey and Medina2010; Qi et al. Reference Qi, Liu, Shyy and Aono2010; Thiria & Godoy-Diana Reference Thiria and Godoy-Diana2010; Yin & Luo Reference Yin and Luo2010; Zhao et al. Reference Zhao, Huang, Deng and Sane2010; Zhao, Deng & Sane Reference Zhao, Deng and Sane2011; Dai, Luo & Doyle Reference Dai, Luo and Doyle2012; Liu et al. Reference Liu, Cheng, Sane and Deng2015), (ii) the association between peak performance (efficiency or thrust/power coefficients) and structural resonance (Masoud & Alexeev Reference Masoud and Alexeev2010; Ramananarivo, Godoy-Diana & Thiria Reference Ramananarivo, Godoy-Diana and Thiria2011; Yeh & Alexeev Reference Yeh and Alexeev2014, Reference Yeh and Alexeev2016; Paraz, Schouveiler & Eloy Reference Paraz, Schouveiler and Eloy2016), (iii) locomotion attained as a consequence of symmetry breaking and direction of propulsion as a function of plunging frequency and stiffness in the case of studies of self-propulsion (Spagnolie et al. Reference Spagnolie, Moret, Shelley and Zhang2010; Zhang, Liu & Lu Reference Zhang, Liu and Lu2010; Hua, Zhu & Lu Reference Hua, Zhu and Lu2013; Xiao, Hu & Liu Reference Xiao, Hu and Liu2014; Zhu, He & Zhang Reference Zhu, He and Zhang2014a ,Reference Zhu, He and Zhang b ; Olivier & Dumas Reference Olivier and Dumas2016a ) and (iv) dimensional analysis to summarize scaling laws ranging across different structural parameters such as density, stiffness, wing thickness and kinematic parameters such as plunging amplitude, frequency, Reynolds number (Alben Reference Alben2008; Kang et al. Reference Kang, Aono, Cesnik and Shyy2011; Alben et al. Reference Alben, Witt, Baker, Anderson and Lauder2012; Kang & Shyy Reference Kang and Shyy2013, Reference Kang and Shyy2014; Moore Reference Moore2014, Reference Moore2015; Kodali & Kang Reference Kodali and Kang2016). The implications drawn from these studies comprising all of the aforementioned issues are hereby summarized.
Prempraneerach et al. (Reference Prempraneerach, Hover and Triantafyllou2003) found that corresponding to the Strouhal numbers (parameter indicative of vortex shedding) at which rigid foils showed excellent performance, propulsive efficiency of flexible foils increased by 36 % and they also recorded higher thrust coefficients. Heathcote et al. (Reference Heathcote, Martin and Gursul2004) and Heathcote & Gursul (Reference Heathcote and Gursul2007) discovered that wing deformation and phase lag between the leading- and trailing-edge motions increase as the wing flexibility increases, with the effective pitching angle found to be the most influential parameter as far as efficiency is concerned. Thiria & Godoy-Diana (Reference Thiria and Godoy-Diana2010) showed that elasticity leads to (i) a substantial reduction in consumed power, and (ii) an increase in propulsive force by considering high inertia wings (relative density of
 $O(10^{3})$
with respect to air) with four different thickness and stiffness combinations.
By considering simplifying assumptions on the flexing motion and inviscid flow, most of the analytical studies supported the experimental inferences on improvement in propulsion performance with flexibility. Katz & Weihs (Reference Katz and Weihs1978, Reference Katz and Weihs1979) presented a 20 % increase in efficiency of flexible foils over rigid foils, accompanied by a negligible decrement in thrust. Alben (Reference Alben2008) and Alben et al. (Reference Alben, Witt, Baker, Anderson and Lauder2012) found that the optimum thrust corresponds to a body flexed upwards at the trailing edge with a quarter wavelength mode of deflection. Moore (Reference Moore2014, Reference Moore2015) established a theoretical solution using inviscid theory to model the passive pitching of a flapping wing undergoing small-amplitude oscillation. It was shown through numerical optimization that the flexibility localized at the wing’s leading edge generates more thrust than that with uniform stiffness.
A significant contribution to scrutinizing the impact of flexibility on aerodynamics involves numerical simulations corresponding to fluid–structure interactions. In this regard, the most popular techniques or models implemented in the structural solvers are: (i) the solid continuum (Masoud & Alexeev Reference Masoud and Alexeev2010; Qi et al. Reference Qi, Liu, Shyy and Aono2010; Yin & Luo Reference Yin and Luo2010; Kang et al. Reference Kang, Aono, Cesnik and Shyy2011; Dai et al. Reference Dai, Luo and Doyle2012; Hua et al. Reference Hua, Zhu and Lu2013; Yeh & Alexeev Reference Yeh and Alexeev2014; Zhu et al. Reference Zhu, He and Zhang2014a ,Reference Zhu, He and Zhang b ; Olivier & Dumas Reference Olivier and Dumas2016a ,Reference Olivier and Dumas b ; Yeh & Alexeev Reference Yeh and Alexeev2016), and (ii) lumped-torsional flexibility (Toomey & Eldredge Reference Toomey and Eldredge2008; Ishihara et al. Reference Ishihara, Horie and Denda2009; Vanella et al. Reference Vanella, Fitzgerald, Preidikman, Balaras and Balachandran2009; Eldredge et al. Reference Eldredge, Toomey and Medina2010; Spagnolie et al. Reference Spagnolie, Moret, Shelley and Zhang2010; Zhang et al. Reference Zhang, Liu and Lu2010; Xiao et al. Reference Xiao, Hu and Liu2014; Beatus & Cohen Reference Beatus and Cohen2015) approaches. While the former considers the wing or membrane to be entirely flexible along its length and requires complex and expensive computations, the latter involves simplifying assumptions with the flexibility localized, leading to a dynamics dictated using an ordinary differential equation.
Using the former approach, Kang et al. (Reference Kang, Aono, Cesnik and Shyy2011) showed that the maximum propulsive force and optimum efficiency are obtained when flapping at the resonant frequency and half the natural frequency, respectively. Masoud & Alexeev (Reference Masoud and Alexeev2010) examined hovering aerodynamics of flexible wings oscillating at resonance and found that aerodynamic lift is significantly enhanced due to the induction of large-amplitude oscillations at resonance. In their investigation, Qi et al. (Reference Qi, Liu, Shyy and Aono2010) found that both lift and drag increased with the increase in spanwise flexibility and reached a maximum beyond which there was a sharp decline, indicating that the forces are flexibility sensitive and can be optimized. Zhu et al. (Reference Zhu, He and Zhang2014a ,Reference Zhu, He and Zhang b ) found that introduction of flexibility exerted two opposing effects on vortex circulation that could both hinder as well as initiate the wake asymmetry. Hua et al. (Reference Hua, Zhu and Lu2013) identified forward, backward and irregular zones of motion and reported that flexibility can be optimized to obtain maximum propulsive efficiency, and detected both normal and deflected wake patterns indicative of thrust and lift generation in the former and latter situations, respectively. Yeh & Alexeev (Reference Yeh and Alexeev2014, Reference Yeh and Alexeev2016) observed two distinct regimes: (i) the maximum velocity (MV) that occurred at the resonant frequency and was accompanied by a large trailing-edge displacement, and (ii) the maximum performance (MP) that transpired near an off-resonance frequency and exhibited a bending pattern with minimum displacement of the centre of mass. Olivier & Dumas (Reference Olivier and Dumas2016a ,Reference Olivier and Dumas b ), by utilizing two dimensionless parameters, postulated different optimum flexibilities for thrust and efficiency. For inertia driven deformations, thrust and efficiency both deteriorated with an increase in flexibility.
Vanella et al. (Reference Vanella, Fitzgerald, Preidikman, Balaras and Balachandran2009) demonstrated that the best performance is achieved at one third of the natural frequency and was 25 % higher than the rigid wing driven with the same kinematics. Toomey & Eldredge (Reference Toomey and Eldredge2008), Eldredge et al. (Reference Eldredge, Toomey and Medina2010) showed that wing flexibility usually reduces the power consumption in flapping compared to a rigid wing as passive deflection leads to smaller drag. However, highly flexible wings undergoing large deformations exhibited worse aerodynamic performance than moderately flexible wings, indicating that flexibility is optimizable for maximizing performance. Zhang et al. (Reference Zhang, Liu and Lu2010) investigated the wake patterns by varying the plunging amplitude, flapping Reynolds number and the spring stiffness and identified four kinds of vortex structures, which mainly depend on the forward speed. Xiao et al. (Reference Xiao, Hu and Liu2014) found that the effect of stiffness was strongly influenced by the pitching axis as the propulsion performance improved when the pivot point of the spring moved from the centre to the leading edge. Maximum terminal velocity was attained when flapping at the natural frequency, while the optimal efficiency was recorded at half the natural frequency.
Based on these arguments, an optimum flexibility has been widely agreed to result in the maximum cruising velocity and efficiency, and highly flexible and very rigid wings are shown to be undesirable. However, contradicting results on peak performance exist. Studies have demonstrated that the maximum terminal velocity (in free swimmers) (see Spagnolie et al. Reference Spagnolie, Moret, Shelley and Zhang2010) or maximum thrust (in tethered flappers) (see Kang et al. Reference Kang, Aono, Cesnik and Shyy2011) occurs at resonance or the system’s natural frequency. In contrast, there are studies (Thiria & Godoy-Diana Reference Thiria and Godoy-Diana2010; Ramananarivo et al. Reference Ramananarivo, Godoy-Diana and Thiria2011; Hua et al. Reference Hua, Zhu and Lu2013; Zhu et al. Reference Zhu, He and Zhang2014b ) which have reported that the highest cruising velocity or highest propulsive efficiency usually transpires far below the natural frequency. Despite many analytical studies, the proposed dimensionless quantity or scaling parameter associated with the passive pitching and plunging was restricted primarily to the small-amplitude limit with no emphasis on propulsion. Furthermore, in all previous studies on lumped-torsional flexibility, a notable paucity was observed in that the flexibility was concentrated at a single point (either at the leading edge or centre) and this localized flexible system needs further improvement to mimic actual scenarios.
Lack of coherence in earlier results and a missing key parameter that correlates passive pitching with plunging lays the foundation for further research to be pursued. Following this course, the specific aim of this study is to examine the role of chordwise passive wing flexibility in forward propulsion for low Reynolds number flows. In this regard, we develop a generalized lumped-torsional spring flexibility model to mimic the chordwise flexibility of an insect wing. The computational framework is also validated and verified against available data. The explicitness of the governing equations of the lumped-torsional flexibility model enabled us to establish a phenomenological solution to the simplified version of this problem that disseminates the contribution of a fluid–structure interaction (FSI) index,
 $\unicode[STIX]{x1D713}$
. This parameter unravels some complex aerodynamic phenomena with regard to passive flexing that influences the propulsion characteristics of insect flight. Moreover, the aerodynamics and flow patterns associated with a flexible plate have been investigated for a range of Reynolds number and torsional stiffness. The key objectives of the study are to
(I) construct a two-dimensional fluid–structure interaction (FSI) framework based upon the multi-component lumped-torsional flexibility model for a self-propelled plunging plate;
(II) formulate a phenomenological solution to the simplified single-spring structural dynamics equation and identify key parameters that control passive pitching and establish the relationship with imposed plunging motion;
(III) examine the role of structural and kinematic parameters (flapping Reynolds number, plunging amplitude, density ratio, torsional stiffness, thickness) on the propulsion performance (cruising velocity and power requirements);
(IV) address prevailing issue about the phenomenon of resonance and its influence on propulsion; and
(V) elucidate the dominant wake patterns and investigate the role of shed vortices and their interactions with the wing that contribute to forward motion or thrust generation.
Through this work, important inferences on the role of passive wing flexibility will be outlined, which could act as starting points for the design and analysis of realistic and bio-inspired MAVs with inherent wing flexibility taken under consideration. This analysis is anticipated to assist in understanding fluid–structure interaction and efficiency of a self-propelled flexible plunging wing in a viscous fluid.
2 Problem description
2.1 Plunging kinematics and parameters
To circumvent the computational cost associated with expensive three-dimensional self-propelled wing simulations, we consider a heaving flexible two-dimensional flat plate unconstrained to translation in the horizontal direction and free to flex about the leading edge. A vertical sinusoidal plunging motion is prescribed at the leading edge. The key dimensional parameters expected to play a role in propulsion in a rigid wing have been introduced in an earlier publication (Arora et al.
Reference Arora, Gupta, Sanghi, Aono and Shyy2016a
) and for the sake of brevity are briefly described here. These are the flapping Reynolds number
 $Re_{f}=A\unicode[STIX]{x1D6FE}C/\unicode[STIX]{x1D708}$
, the amplitude ratio
 $\unicode[STIX]{x1D6FD}=A/C$
and the density ratio
 $\unicode[STIX]{x1D70C}^{\ast }=\unicode[STIX]{x1D70C}_{s}/\unicode[STIX]{x1D70C}_{f}$
. Here,
 $\unicode[STIX]{x1D708}$
is the kinematic viscosity,
 $C$
is the chord length,
 $\unicode[STIX]{x1D6FE}$
is the plunging frequency (
 $\unicode[STIX]{x1D6FE}=1/T$
, where
 $T$
is the time period of one stroke/cycle),
 $A$
is the plunging amplitude,
 $\unicode[STIX]{x1D70C}_{s}$
and
 $\unicode[STIX]{x1D70C}_{f}$
are the densities of the plate and fluid, respectively;
 $\unicode[STIX]{x1D6FF}$
is the thickness to chord ratio (
 $\unicode[STIX]{x1D6FF}=e/C$
, where
 $e$
is the dimensional wing thickness) which has been fixed at 2 % in this work as considered in earlier studies (Wu, Ifju & Stanford Reference Wu, Ifju and Stanford2010; Kang et al.
Reference Kang, Aono, Cesnik and Shyy2011). With the incorporation of flexibility, additional parameters are introduced. These are the non-dimensionalized torsional flexibility,
 $$\begin{eqnarray}K^{\ast }=\frac{K}{\unicode[STIX]{x1D70C}_{f}\unicode[STIX]{x1D6FE}^{2}C^{4}},\end{eqnarray}$$
where
 $K$
is the dimensional torsional flexibility, and the ratio of the natural frequency (
 $\unicode[STIX]{x1D714}_{n}$
) to the flapping frequency (Zhang et al.
Reference Zhang, Liu and Lu2010), given as
 $$\begin{eqnarray}\unicode[STIX]{x1D714}^{\ast }=\frac{\unicode[STIX]{x1D714}_{n}}{\unicode[STIX]{x1D714}}.\end{eqnarray}$$
Here
 $\unicode[STIX]{x1D714}_{n}=\sqrt{K/I}$
when a single torsion spring is attached at the leading edge of the plate with
 $I$
being the mass moment of inertia of the plate about the leading edge. The resonance frequency in the fluid deviates from that in a vacuum as inferred from a theoretical analysis by Sader (Reference Sader1998) and Van Eysden & Sader (Reference Van Eysden and Sader2007). For reasons given later, frequency normalization in this work has been done using the vacuum resonance frequency. Henceforth, resonance refers to plunging at the natural or resonant frequency in a vacuum and is called structural resonance, also denoted by ‘unit frequency ratio’ (
 $\unicode[STIX]{x1D714}^{\ast }=1$
). Natural flyers usually operate at a frequency ratio
 $\unicode[STIX]{x1D714}^{\ast }>1.2$
(Kang & Shyy Reference Kang and Shyy2013). To assess the role of structural resonance on propulsion,
 $1\lesssim \unicode[STIX]{x1D714}^{\ast }\leqslant 10$
has been considered (Zhang et al.
Reference Zhang, Liu and Lu2010; Xiao et al.
Reference Xiao, Hu and Liu2014).
Due to the fluid–wing interaction, an aerodynamic force is exerted on the flat plate. The horizontal component of this force is responsible for the forward locomotion. The non-dimensional horizontal position of the plate
 $\boldsymbol{x}_{p}^{\ast }$
is updated by the equation
 $$\begin{eqnarray}\frac{\text{d}^{2}\boldsymbol{x}_{p}^{\ast }}{\text{d}t^{\ast 2}}=\frac{2\unicode[STIX]{x03C0}^{2}\unicode[STIX]{x1D6FD}^{2}}{\unicode[STIX]{x1D70C}^{\ast }\unicode[STIX]{x1D6FF}}F_{x}^{\ast },\end{eqnarray}$$
where
 $t^{\ast }=\unicode[STIX]{x1D6FE}t$
is the dimensionless time and
 $F_{x}^{\ast }$
is the thrust coefficient defined as
 $$\begin{eqnarray}F_{x}^{\ast }=\frac{\overline{\boldsymbol{F}}_{x}}{\frac{1}{2}\unicode[STIX]{x1D70C}_{f}V^{2}C},\end{eqnarray}$$
where
 $V=2\unicode[STIX]{x03C0}A\unicode[STIX]{x1D6FE}$
is the maximum plunging velocity and
 $\overline{\boldsymbol{F}}_{x}$
is the instantaneous thrust (per unit depth) calculated using the momentum exchange method (Arora et al.
Reference Arora, Gupta, Sanghi, Aono and Shyy2014, Reference Arora, Gupta, Sanghi, Aono and Shyy2016a
; Arora, Gupta & Shyy Reference Arora, Gupta and Shyy2016b
). The dimensionless velocity component in the horizontal direction is
 $U=u/V$
, where
 $u$
is the dimensional instantaneous translational velocity. The translational Reynolds number is defined as
 $Re_{u}=\overline{u}C/\unicode[STIX]{x1D708}$
where
 $\overline{u}=1/T\int u\,\text{d}t$
is the time-averaged translational velocity attained by the plate at the cruising condition and can similarly be non-dimensionalized as
 $\overline{U}=\overline{u}/V$
.
Another important dimensionless number related to flapping flight and indicative of vortex shedding is the Strouhal number (Taylor, Nudds & Thomas Reference Taylor, Nudds and Thomas2003) which is defined as
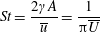 $$\begin{eqnarray}St=\frac{2\unicode[STIX]{x1D6FE}A}{\overline{u}}=\frac{1}{\unicode[STIX]{x03C0}\overline{U}}\end{eqnarray}$$
and can also be expressed as
 $St=2Re_{f}/Re_{u}$
.
For estimating the power required to propel the wing, the cruising condition input power
 $\langle P_{i}\rangle$
is determined by averaging instantaneous values of power over a time period of 20 plunging strokes after steady propulsion is achieved, i.e.
 $$\begin{eqnarray}\langle P_{i}\rangle =\frac{P_{i}}{\frac{1}{2}\unicode[STIX]{x1D70C}_{f}V^{3}C}=\int _{t_{0}^{\ast }}^{t_{0}^{\ast }+20}F_{y}^{\ast }\left(\frac{v}{V}\right)\,\text{d}t^{\ast },\end{eqnarray}$$
where
 $F_{y}^{\ast }$
is the drag coefficient of the plunging wing,
 $v$
is the instantaneous vertical (or plunging) velocity and
 $t_{0}^{\ast }$
is the plunging cycle after which quasi-steady propulsion commences. The power has been calculated with an assumption that any negative contribution is ignored (Yin & Luo Reference Yin and Luo2010). In self-propelled studies, the net horizontal force is zero at the cruising condition, and hence the output power cannot be calculated in a fashion similar to the input power. Cruising efficiency is one of the measures to quantify propulsive performance of forward locomotion and can be calculated as the kinetic energy gained per unit input work (Arora et al.
Reference Arora, Gupta, Sanghi, Aono and Shyy2016a
). However, in the present study, another parameter, known as the effectiveness, which is described in a later section, has been used for measuring the performance.
2.2 Implementation of flexibility
The insect wing structures are inherently anisotropic due to the complex membrane–vein structure (Combes & Daniel Reference Combes and Daniel2003a ). Moreover, the spanwise bending stiffness has been reported to be one or two orders of magnitude larger than the chordwise bending stiffness in a majority of insects (Combes & Daniel Reference Combes and Daniel2003a ,Reference Combes and Daniel b ). Therefore, the focus of the present work is to develop a fluid–structure interaction framework in which the role of flexibility in propulsion performance can be investigated through a chordwise flexibility model. The lumped-torsional flexibility model has been widely used to study the dynamics of a flexible wing (Toomey & Eldredge Reference Toomey and Eldredge2008; Ishihara et al. Reference Ishihara, Horie and Denda2009; Vanella et al. Reference Vanella, Fitzgerald, Preidikman, Balaras and Balachandran2009; Eldredge et al. Reference Eldredge, Toomey and Medina2010; Spagnolie et al. Reference Spagnolie, Moret, Shelley and Zhang2010; Zhang et al. Reference Zhang, Liu and Lu2010; Xiao et al. Reference Xiao, Hu and Liu2014; Beatus & Cohen Reference Beatus and Cohen2015). However, all of these studies consider flexibility located at the leading edge only. Other differences exist due to the focus not being on self-propulsion (Toomey & Eldredge Reference Toomey and Eldredge2008; Ishihara et al. Reference Ishihara, Horie and Denda2009; Vanella et al. Reference Vanella, Fitzgerald, Preidikman, Balaras and Balachandran2009; Eldredge et al. Reference Eldredge, Toomey and Medina2010), ignoring the effects of inertial acceleration (Zhang et al. Reference Zhang, Liu and Lu2010; Xiao et al. Reference Xiao, Hu and Liu2014) or considering a membrane of high or negligible thickness (Spagnolie et al. Reference Spagnolie, Moret, Shelley and Zhang2010; Zhang et al. Reference Zhang, Liu and Lu2010; Xiao et al. Reference Xiao, Hu and Liu2014).
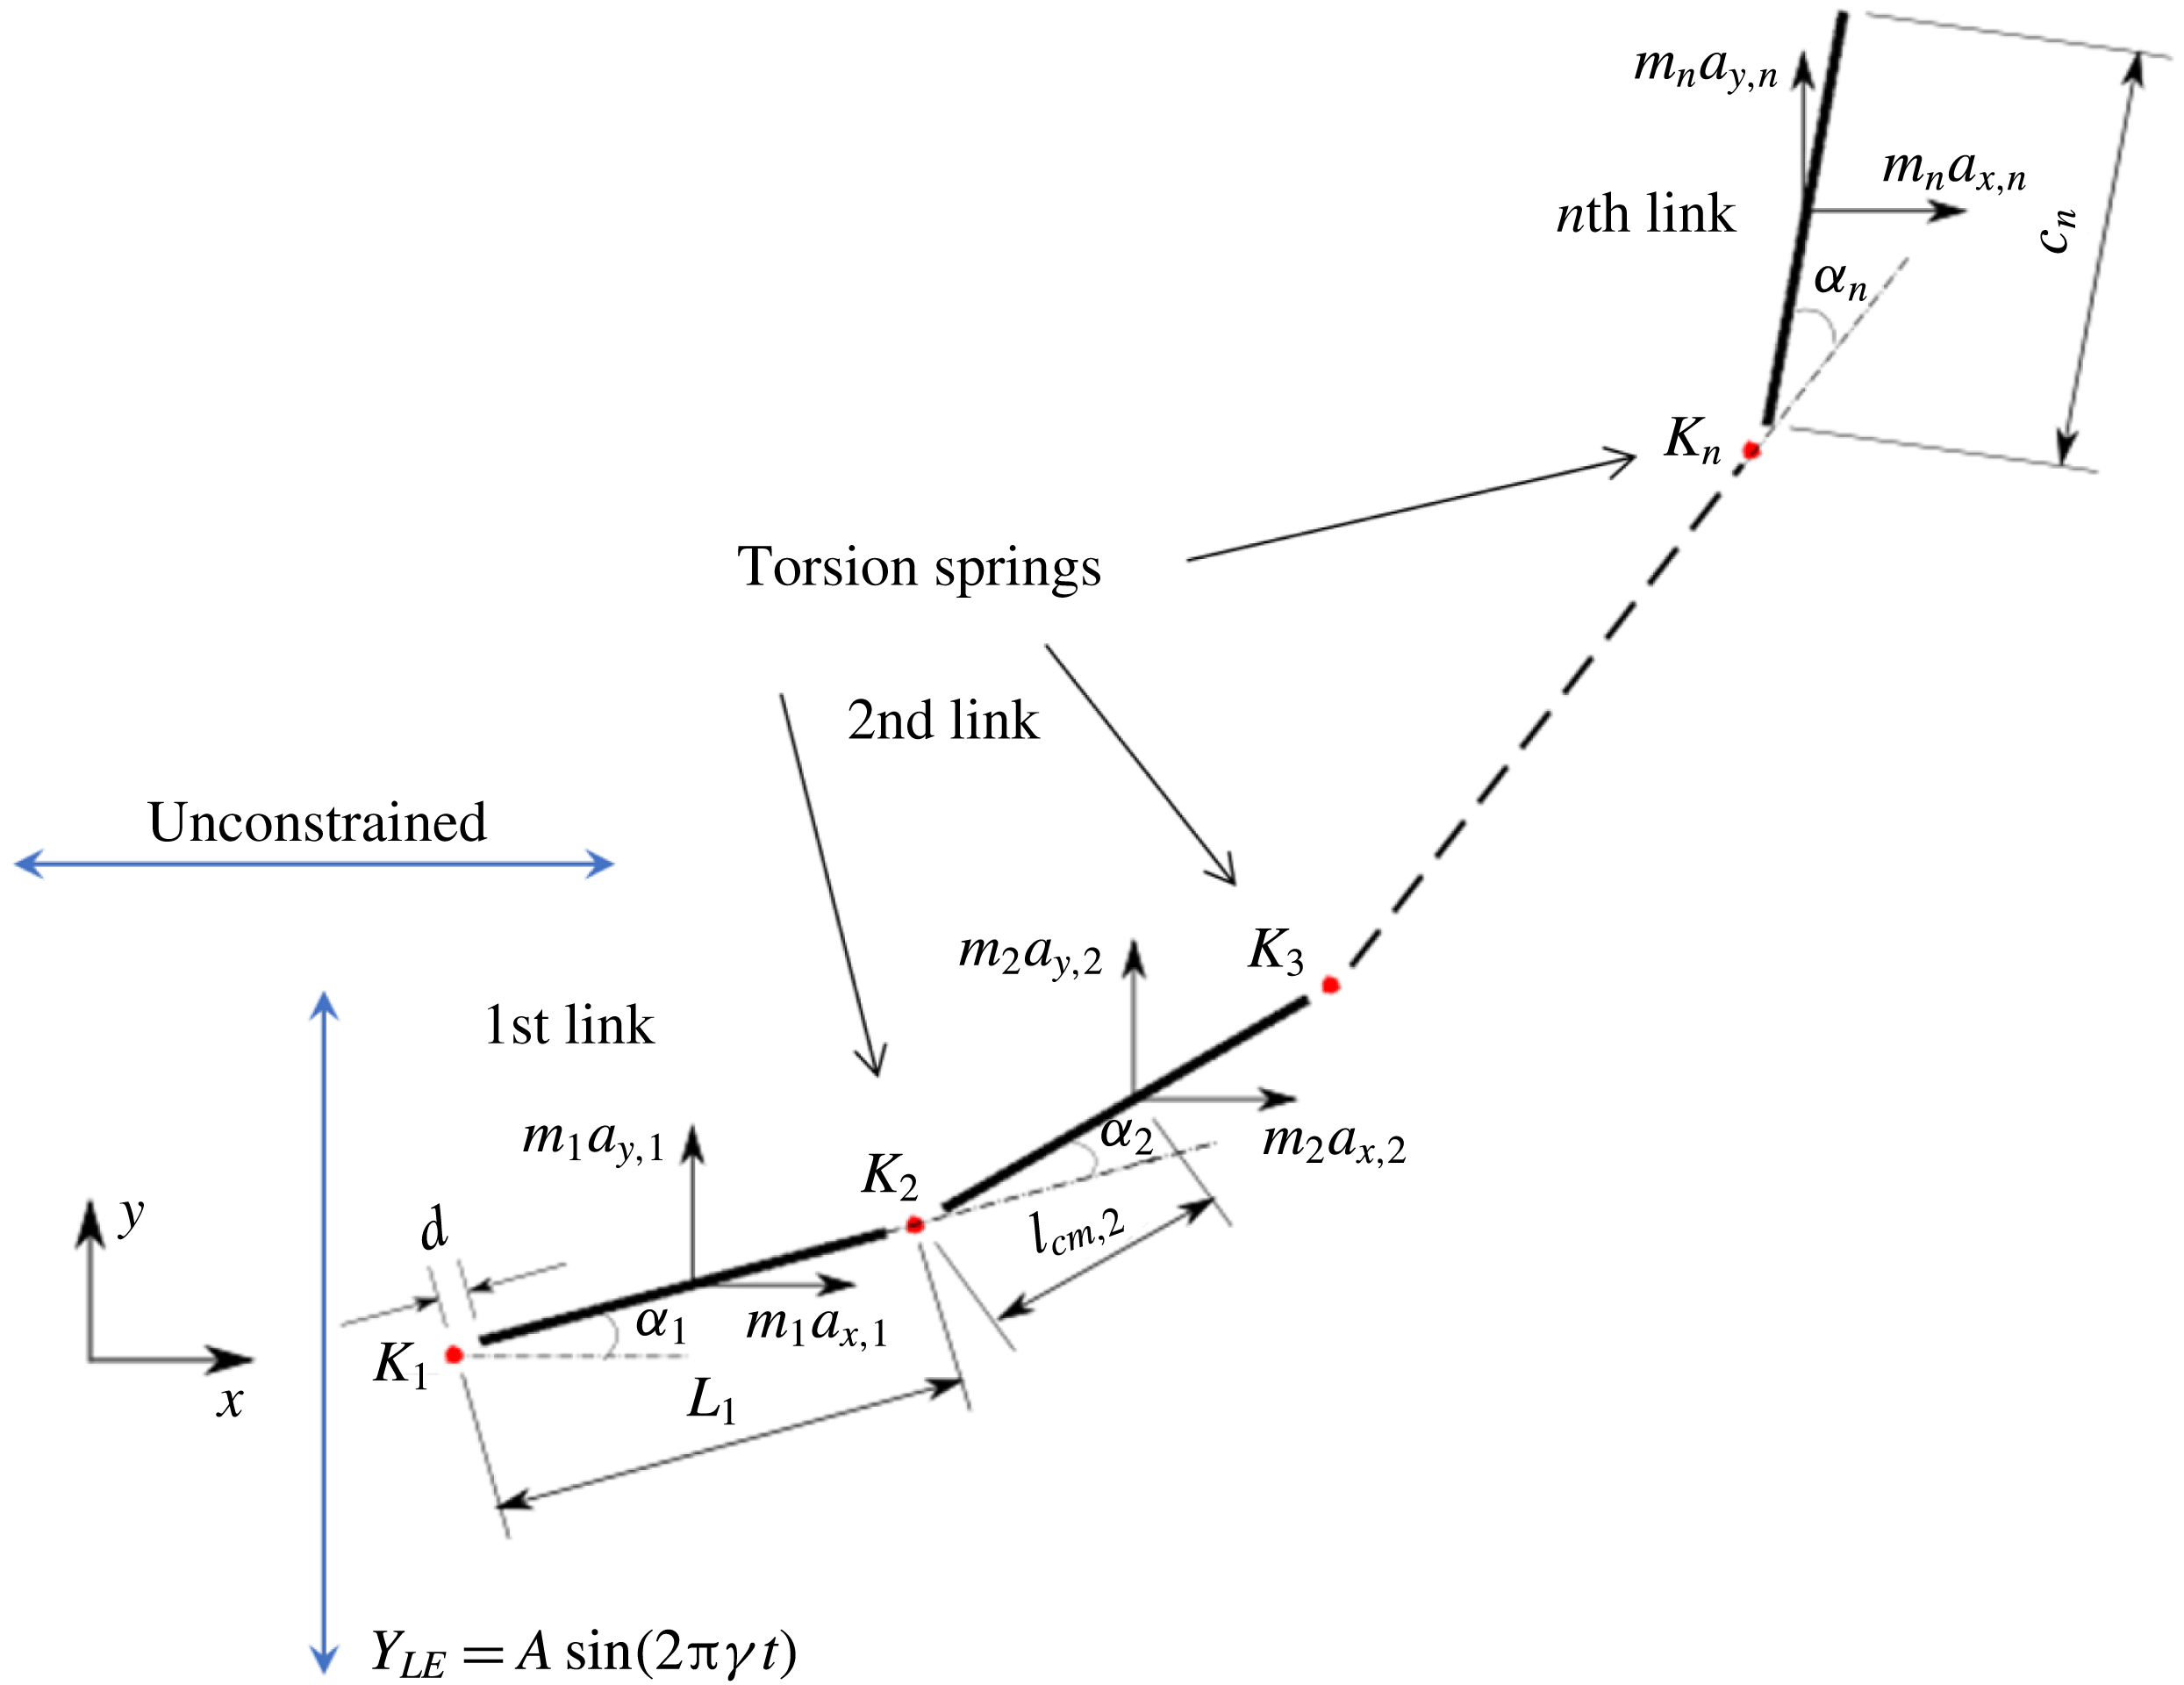
Observing the notable shortcoming in all these studies due to the lack of a generalized discrete flexibility model, we develop a multi-component system where flexibility is not localized. Shown in figure 1 is one such illustration in which flexibility has been implemented by segregating it into
 $n$
rigid links connected with each other through torsion springs. Due to inertia and fluid forces, the wing deforms during the plunging motion and its impact on forward propulsion can be quantified.
Lumped-torsional flexibility model for
 $n$
linkages.
For illustration purposes, the dynamics of a single plate–spring system (
 $n=1$
with the spring attached at the leading edge of the plate) can be modelled using the equation
 $$\begin{eqnarray}(I+I_{a})\frac{\text{d}^{2}\unicode[STIX]{x1D6FC}}{\text{d}t^{2}}+\unicode[STIX]{x1D70E}\dot{\unicode[STIX]{x1D6FC}}+K\unicode[STIX]{x1D6FC}=-(m+m_{a})\frac{C}{2}\cos \unicode[STIX]{x1D6FC}\ddot{Y} +\unicode[STIX]{x1D6EC}_{a},\end{eqnarray}$$
where
 $I$
is the moment of inertia of the plate about the leading edge,
 $m$
is the mass of the plate,
 $m_{a}(I_{a})$
is the added mass (added moment of inertia) for the flat plate,
 $\unicode[STIX]{x1D70E}$
is the linear damping coefficient (defined as
 $\unicode[STIX]{x1D70E}=2\unicode[STIX]{x1D709}I\unicode[STIX]{x1D714}_{n}$
with
 $\unicode[STIX]{x1D709}$
being the damping ratio),
 $C$
is the chord length,
 $\ddot{Y}$
is the acceleration due to heaving,
 $\unicode[STIX]{x1D6EC}_{a}$
is the aerodynamic torque experienced by the spring due to fluid–structure interaction and
 $\unicode[STIX]{x1D6FC}$
is the deflection angle of the passively pitching wing. The aerodynamic torque is calculated by the fluid solver and is the parameter which couples it to the structural solver. Due to this torque, the angle of deflection is determined (by the structural solver) which in turn affects the aerodynamic force (estimated by the fluid solver) and vice versa.
Virtual or added mass characterizes the additional force to be considered as the accelerating or decelerating body displaces a volume of the surrounding fluid (Brennen Reference Brennen1982; Techet Reference Techet2005). The added mass is a
 $3\times 3$
tensor for two-dimensional flows (
 $6\times 6$
in three dimensions) which depends only on the shape and orientation of surface of the body and is independent of the motion kinematics. Conventionally, the added mass of various shaped bodies has been approximated by considering the surrounding fluid as inviscid and incompressible. Then the added mass matrix
 $(\unicode[STIX]{x1D706})$
can be written as (Korotkin Reference Korotkin2008)
 $$\begin{eqnarray}\unicode[STIX]{x1D706}_{ij}=-\unicode[STIX]{x1D70C}_{f}\iint _{s}\frac{\unicode[STIX]{x2202}\unicode[STIX]{x1D711}_{i}}{\unicode[STIX]{x2202}n}\unicode[STIX]{x1D711}_{j}\,\text{d}S\quad (i,j=1,2,\ldots ,6),\end{eqnarray}$$
where
 $S$
denotes the surface of moving body,
 $n$
is the outward direction normal to surface
 $S$
and
 $\unicode[STIX]{x1D711}_{i}$
represents the flow potential corresponding to translational and rotational velocities for
 $i=1,2,3$
and
 $i=4,5,6$
, respectively. In other words,
 $\unicode[STIX]{x1D706}_{ij}$
can be considered as an additional mass associated with the force acting on a body in the
 $i$
th direction as it moves with unit acceleration in the
 $j$
th direction (Techet Reference Techet2005). Determining the added mass matrix is simpler for symmetrical bodies with unidirectional movement in an inviscid fluid (Brennen Reference Brennen1982). However, it is extremely challenging to assess the added mass matrix for bodies experiencing time-evolving flows at finite Reynolds numbers (Brennen Reference Brennen1982), an aspect shared by the fluid–structure interaction being modelled in this work. Although we note that by considering the fluid to be inviscid, an approximate representation of the added mass forces and moments could be obtained, this however will be applicable only if the plate considered were rigid. With the implementation of flexibility, the shape of the plate is expected to evolve at every time step. Hence, evaluation of added mass forces is an extremely difficult assignment, especially with the bending being passive, where both fluid and structural solvers are coupled. Moreover, the added mass is expected to make a significant contribution for marine animals where
 $\unicode[STIX]{x1D70C}^{\ast }\sim O(10^{0}{-}10^{1})$
and can potentially be ignored for aerial animals where
 $\unicode[STIX]{x1D70C}^{\ast }\sim O(10^{2}{-}10^{3})$
(Brennen Reference Brennen1982). Thus, computing the added mass tensor was ignored in the present study and will be the subject of a future investigation.
One of the main advantages of this simplified two-dimensional model is that with the structural equation (2.7) being an ordinary differential equation (ODE), the analytical solution to this problem can be easily attained (refer § 4.1), which is otherwise difficult, for example, in passive pitching where the shape is a priori unknown. Moreover, the above spring mass equation approaches the nonlinear Euler–Bernoulli beam equation as the number of linkages and springs increase. In all of the earlier studies on lumped-torsional flexibility, the number of linkages or torsional springs was restricted to one or two. In the present study, we generalize the lumped-torsional flexibility model for
 $n$
number of linkages or springs, which can better mimic a real flexible wing. The description of the algorithm for
 $n$
linkages is given in § 3.2.
3 Methodology
This section addresses the numerical methodology adopted to examine the role of flexibility in a plunging plate. The numerical framework encompasses two stages of modelling: (i) flow solver, for deciphering the fluid flow around the plunging wing and the force calculation due to fluid–structure interaction, and (ii) structural solver, for computing the bending or angular deflection of the wing due to aerodynamic and inertia forces. Since the flexibility is passive, the wing deformation is unknown with the fluid and structural dynamics equations coupled in a time-staggered manner. The description of these solvers along with various performance checks and validations is as follows.
3.1 Flow Solver
The fluid solver utilizes the multi-relaxation time (MRT) version of the lattice Boltzmann method (LBM) to determine the flow physics and for force evaluation on the plunging plate. The description of MRT, calculation of the macroscopic variables (i.e. pressure and velocity) and force exerted on a moving object immersed in a fluid are concisely described here, and details can be found in our earlier publications (Arora et al. Reference Arora, Gupta, Sanghi, Aono and Shyy2014, Reference Arora, Gupta, Sanghi, Aono and Shyy2016a ).
The single relaxation time (SRT) lattice Boltzmann model exhibits numerical instability at high
 $Re$
and displays spurious oscillations in force measurement (Arora et al.
Reference Arora, Gupta and Shyy2016b
). Citing these disadvantages, we employ the multi-relaxation time (MRT) model that does not exhibit these problems. In this method, the distribution function
 $f$
(as defined in the SRT model) in the discrete velocity space
 $\boldsymbol{B}$
is mapped onto the moment space
 $\boldsymbol{Q}$
by using a transformation matrix
 $\unicode[STIX]{x1D648}$
(Arora et al.
Reference Arora, Gupta, Sanghi, Aono and Shyy2016a
,Reference Arora, Gupta and Shyy
b
), i.e.
 $$\begin{eqnarray}\hat{f}=\unicode[STIX]{x1D648}f\quad \text{and}\quad f=\unicode[STIX]{x1D648}^{-1}\hat{f},\end{eqnarray}$$
where
 $\hat{f}$
is a column matrix consisting of moments of the velocity distribution function (each row vector) which represents the following quantities in two-dimensional space:
 $$\begin{eqnarray}\hat{f}=[\unicode[STIX]{x1D70C},e,\unicode[STIX]{x1D716},j_{x},q_{x},j_{y},q_{y},p_{xx},p_{xy}]^{\text{T}},\end{eqnarray}$$
where
 $\unicode[STIX]{x1D70C}$
is the density,
 $e$
signifies the kinetic energy,
 $\unicode[STIX]{x1D716}$
is the square of the kinetic energy,
 $j_{x}$
and
 $j_{y}$
are the
 $x$
and
 $y$
components of the momentum flux,
 $q_{x}$
and
 $q_{y}$
are related to the
 $x$
and
 $y$
components of energy density and
 $p_{xx}$
and
 $p_{xy}$
refer to the diagonal and off-diagonal terms in the viscous stress tensor.
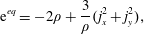
The equilibrium values for the non-conserved moments can be obtained from the conserved moments
 $\unicode[STIX]{x1D70C}$
and
 $\boldsymbol{j}$
(
 $j_{x}$
and
 $j_{y}$
) as
 $$\begin{eqnarray}\displaystyle & \displaystyle \text{e}^{eq}=-2\unicode[STIX]{x1D70C}+\frac{3}{\unicode[STIX]{x1D70C}}(j_{x}^{2}+j_{y}^{2}), & \displaystyle\end{eqnarray}$$
 $$\begin{eqnarray}\displaystyle & \displaystyle \unicode[STIX]{x1D716}^{eq}=\unicode[STIX]{x1D70C}-\frac{3}{\unicode[STIX]{x1D70C}}(j_{x}^{2}+j_{y}^{2}), & \displaystyle\end{eqnarray}$$
 $$\begin{eqnarray}\displaystyle & \displaystyle q_{x}^{eq}=-j_{x},\quad q_{y}^{eq}=-j_{y}, & \displaystyle\end{eqnarray}$$
 $$\begin{eqnarray}\displaystyle & \displaystyle p_{xx}^{eq}=\frac{1}{\unicode[STIX]{x1D70C}}(j_{x}^{2}-j_{y}^{2}),\quad p_{xy}^{eq}=\frac{1}{\unicode[STIX]{x1D70C}}j_{x}j_{y}. & \displaystyle\end{eqnarray}$$
The collision process is performed in the
 $\boldsymbol{Q}$
space which is as follows:
 $$\begin{eqnarray}\hat{f}_{\ast }=\hat{f}-\unicode[STIX]{x1D64E}[\,\hat{f}-\hat{f}^{eq}],\end{eqnarray}$$
where
 $\hat{f}_{\ast }$
is the post-collision operator, and
 $\unicode[STIX]{x1D64E}$
is the diagonal relaxation time matrix
 $$\begin{eqnarray}\unicode[STIX]{x1D64E}=\text{diag}[s_{1},s_{2},s_{3},s_{4},s_{5},s_{6},s_{7},s_{8},s_{9}],\end{eqnarray}$$
where
 $s_{1}=s_{4}=s_{6}=0$
(relaxation time for the conserved quantities).
The moments
 $\hat{f}$
are transformed back and thus the advection step is carried out in the
 $\boldsymbol{B}$
space on the distribution function
 $f$
. Thus, (3.4) can be written as
 $$\begin{eqnarray}\tilde{f}=\unicode[STIX]{x1D648}^{-1}\hat{f}-\unicode[STIX]{x1D648}^{-1}\unicode[STIX]{x1D64E}[\,\hat{f}-\hat{f}^{eq}],\end{eqnarray}$$
where
 $\tilde{f}$
is the post-collision distribution function in
 $\boldsymbol{B}$
space which is then streamed to the neighbouring nodes in the direction of the lattice velocities.
For the case of a moving boundary, the solid surface is represented by a set of boundary nodes which lie at the mid-points of the links connecting the fluid and solid nodes. In this half-way bounce-back interpretation, both fluid and solid nodes are treated indistinguishably and the collision and streaming is applied as if a fictitious fluid were present in the interior of the solid (Arora et al. Reference Arora, Gupta, Sanghi, Aono and Shyy2014, Reference Arora, Gupta, Sanghi, Aono and Shyy2016a ). This approach ensures that mass is conserved at the boundary nodes and also avoids the necessity of creating and destroying fluid as the solid particle moves (covering/uncovering of the fluid nodes).
The total force
 $\bar{\boldsymbol{F}}$
on the solid object is obtained by summing
 $\boldsymbol{F}$
over all the nodes that constitute the boundary of the object along the directions
 $\unicode[STIX]{x1D6FC}$
which involve the exchange of distributions from fluid to solid nodes or vice versa (Arora et al.
Reference Arora, Gupta, Sanghi, Aono and Shyy2014, Reference Arora, Gupta, Sanghi, Aono and Shyy2016a
),
 $$\begin{eqnarray}\bar{\boldsymbol{F}}\left(t+\frac{1}{2}\right)=\mathop{\sum }_{all\;x_{b}}\mathop{\sum }_{\unicode[STIX]{x1D6FC}}\boldsymbol{F}\left(\boldsymbol{x}+\frac{1}{2}\boldsymbol{e}_{\unicode[STIX]{x1D6FC}},t+\frac{1}{2}\right).\end{eqnarray}$$
Similarly, the total aerodynamic torque exerted on the object is given as
 $$\begin{eqnarray}\bar{\unicode[STIX]{x1D726}}_{a}\left(t+\frac{1}{2}\right)=\mathop{\sum }_{all\;x_{b}}\mathop{\sum }_{\unicode[STIX]{x1D6FC}}\left[\boldsymbol{r}\times \boldsymbol{F}\left(\boldsymbol{x}+\frac{1}{2}\boldsymbol{e}_{\unicode[STIX]{x1D6FC}},t+\frac{1}{2}\right)\right],\end{eqnarray}$$
where
 $\boldsymbol{r}$
is the displacement vector of the boundary node or the moment arm about the torsion spring. The overall force and torque are calculated at the intermediate time step by taking the average of the respective components at half-integer time steps,
 $$\begin{eqnarray}\displaystyle & \displaystyle \bar{\boldsymbol{F}}(t)={\textstyle \frac{1}{2}}[\bar{\boldsymbol{F}}(t-{\textstyle \frac{1}{2}})+\bar{\boldsymbol{F}}(t+{\textstyle \frac{1}{2}})], & \displaystyle\end{eqnarray}$$
 $$\begin{eqnarray}\displaystyle & \displaystyle \unicode[STIX]{x1D726}_{a}(t)={\textstyle \frac{1}{2}}[\unicode[STIX]{x1D726}_{a}(t-{\textstyle \frac{1}{2}})+\unicode[STIX]{x1D726}_{a}(t+{\textstyle \frac{1}{2}})]. & \displaystyle\end{eqnarray}$$
Some of the issues pertaining to the resolution of the moving body are ubiquitous and can be resolved by refining the mesh near the surface of the solid. Thus, the present study employs a novel and unconventional shifting discontinuous grid-block MRT LBM where a fine block translates with the moving solid on a carpet of coarse block (Arora et al. Reference Arora, Gupta, Sanghi, Aono and Shyy2016a ,Reference Arora, Gupta and Shyy b ). With the implementation of flexibility, the role of the structural solver comes into the picture and the focus is rather on presenting the coupling between the fluid and structural solver.
3.2 Structural solver
The Newton–Euler approach (Thomson Reference Thomson1996) has been used to set up the multi-body dynamics equations. Since the system deals with torsion springs, conservation of angular momentum has been applied at all the joints to eliminate the effect of contact forces. Thus,
 $n$
links involve
 $n$
conservation equations to determine the same number of unknowns (or angular deflections). Setting up of the dynamics equations of a multi-link body requires a generalized coordinate system for determining the centre of mass positions, velocities and accelerations of all of the links.
With reference to figure 1, the length of the
 $i$
th linkage is taken as
 $c_{i}$
and
 $2d$
is the gap between two linkages and characterizes the width of the torsional spring (taken to be equal to the half-thickness of each linkage). In the simulations, this gap is transparent to the flow and does not affect the wing aerodynamics (Toomey & Eldredge Reference Toomey and Eldredge2008; Eldredge et al.
Reference Eldredge, Toomey and Medina2010). Thus, the effective length of each linkage, i.e. centre to centre distance of the springs, is
 $L_{i}=c_{i}+2d$
. The total length or chord of the wing is
 $C=nc_{i}+(2n-1)d$
where
 $n\geqslant 1$
. The centre of mass position
 $(X_{i},Y_{i})$
of the
 $i$
th linkage is given by
 $$\begin{eqnarray}\displaystyle & \displaystyle X_{i}=X_{LE}+\mathop{\sum }_{k=1}^{i-1}\left[L_{k}\cos \left(\mathop{\sum }_{j=1}^{k}\unicode[STIX]{x1D6FC}_{j}\right)\right]+l_{cm,i}\cos \left(\mathop{\sum }_{k=1}^{i}\unicode[STIX]{x1D6FC}_{k}\right), & \displaystyle\end{eqnarray}$$
 $$\begin{eqnarray}\displaystyle & \displaystyle Y_{i}=Y_{LE}+\mathop{\sum }_{k=1}^{i-1}\left[L_{k}\sin \left(\mathop{\sum }_{j=1}^{k}\unicode[STIX]{x1D6FC}_{j}\right)\right]+l_{cm,i}\sin \left(\mathop{\sum }_{k=1}^{i}\unicode[STIX]{x1D6FC}_{k}\right), & \displaystyle\end{eqnarray}$$
 $l_{cm,i}=d+c_{i}/2$
,
 $Y_{LE}=A\sin (2\unicode[STIX]{x03C0}\unicode[STIX]{x1D6FE}t)$
and
 $\unicode[STIX]{x1D6FC}_{i}(t)$
is the angular displacement of the
 $i$
th linkage relative to the
 $(i-1)$
th linkage. The translational velocity and acceleration components of the
 $i$
th linkage are given as
 $V_{x,i}={\dot{X}}_{i}$
,
 $V_{y,i}={\dot{Y}}_{i}$
and
 $a_{x,i}=\ddot{X}_{i}$
,
 $a_{y,i}=\ddot{Y} _{i}$
, respectively.
The moment due to the inertial acceleration
 $M_{inrta}$
about the
 $i$
th hinge in a direction perpendicular to the plane of the wing is given as
 $$\begin{eqnarray}M_{inrta,i}=-m_{i}\mathop{\sum }_{j=i}^{n}\{a_{y,j}[r_{x,j}+(j-i)R_{x,j}]\}+m_{i}\mathop{\sum }_{j=i}^{n}\{a_{x,j}[r_{y,j}+(j-i)R_{y,j}]\},\end{eqnarray}$$
where
 $m_{i}$
is the mass of
 $i$
th linkage and
 $\boldsymbol{r}_{i}$
and
 $\boldsymbol{R}_{i}$
are the moment arms about the
 $i$
th spring and their components are given as
 $$\begin{eqnarray}\displaystyle & \displaystyle r_{x,i}=l_{cm,i}\cos \left(\mathop{\sum }_{j=1}^{i}\unicode[STIX]{x1D6FC}_{j}\right),\quad r_{y,i}=l_{cm,i}\sin \left(\mathop{\sum }_{j=1}^{i}\unicode[STIX]{x1D6FC}_{j}\right), & \displaystyle\end{eqnarray}$$
 $$\begin{eqnarray}\displaystyle & \displaystyle R_{x,i}=L_{i}\cos \left(\mathop{\sum }_{j=1}^{i}\unicode[STIX]{x1D6FC}_{j}\right),\quad R_{y,i}=L_{i}\sin \left(\mathop{\sum }_{j=1}^{i}\unicode[STIX]{x1D6FC}_{j}\right). & \displaystyle\end{eqnarray}$$
By conservation of angular momentum about the hinges, the equations governing the dynamics for an
 $n$
-link system can be generalized in a matrix form as
 $$\begin{eqnarray}\displaystyle & & \displaystyle [\unicode[STIX]{x1D644}]_{n\times n}\{\ddot{\unicode[STIX]{x1D6FC}}\}_{n\times 1}+[\unicode[STIX]{x1D646}]_{n\times n}\{\unicode[STIX]{x1D6FC}\}_{n\times 1}+[\unicode[STIX]{x1D64C}]_{n\times n}\{\dot{\unicode[STIX]{x1D6FC}}^{2}\}_{n\times 1}+[\unicode[STIX]{x1D642}]_{n\times n}\{2\dot{\unicode[STIX]{x1D6FC}}_{i}\dot{\unicode[STIX]{x1D6FC}}_{i+1}\}_{n\times 1}\nonumber\\ \displaystyle & & \displaystyle \quad =\{\unicode[STIX]{x1D63F}\}_{n\times 1}+\{\unicode[STIX]{x1D63C}\}_{n\times 1},\end{eqnarray}$$
where
 $\unicode[STIX]{x1D644}$
,
 $\unicode[STIX]{x1D646}$
,
 $\unicode[STIX]{x1D64C}$
and
 $\unicode[STIX]{x1D642}$
are the inertia, stiffness, centrifugal force and Coriolis force matrices, respectively, while
 $\unicode[STIX]{x1D63F}$
and
 $\unicode[STIX]{x1D63C}$
are the structural inertia and aerodynamic contributions, respectively. As a representative case, the matrices obtained for a two link system are given in appendix A. The fourth-order Runge–Kutta method has been used to solve the simultaneous nonlinear equations to obtain the angular deflections at each time step.
3.3 Computational domain and grid convergence
A pictorial representation of the computational domain is shown in figure 2. As shown, a dynamic multi-block (finer mesh) has been considered around the structure in an overall domain of size
 $50C\times 20C$
. The leading edge of the wing was positioned
 $20C$
downstream of the inlet and
 $30C$
upstream of the outlet. It should be noted that the simulations presented here are for a self-propelled wing in a quiescent fluid. Hence, a no-slip boundary condition (zero fluid velocity) was applied on the top and bottom walls of the domain along with the inlet. At the outlet, a fully developed boundary condition (
 $\unicode[STIX]{x2202}u/\unicode[STIX]{x2202}x=0$
) was imposed (Aidun, Lu & Ding Reference Aidun, Lu and Ding1998). Along with the fine block, the entire computational domain shifted with the movement of the wing. Therefore, as the wing translated a unit distance in the coarse block, a layer of fluid nodes was removed from the outlet and added at the inlet. At the inlet, the pressure gradient was specified as (
 $\unicode[STIX]{x2202}p/\unicode[STIX]{x2202}x=0$
). With this technique an infinite region could be replaced with a finite simulation domain.
Layout of the computational domain with imposed boundary conditions.
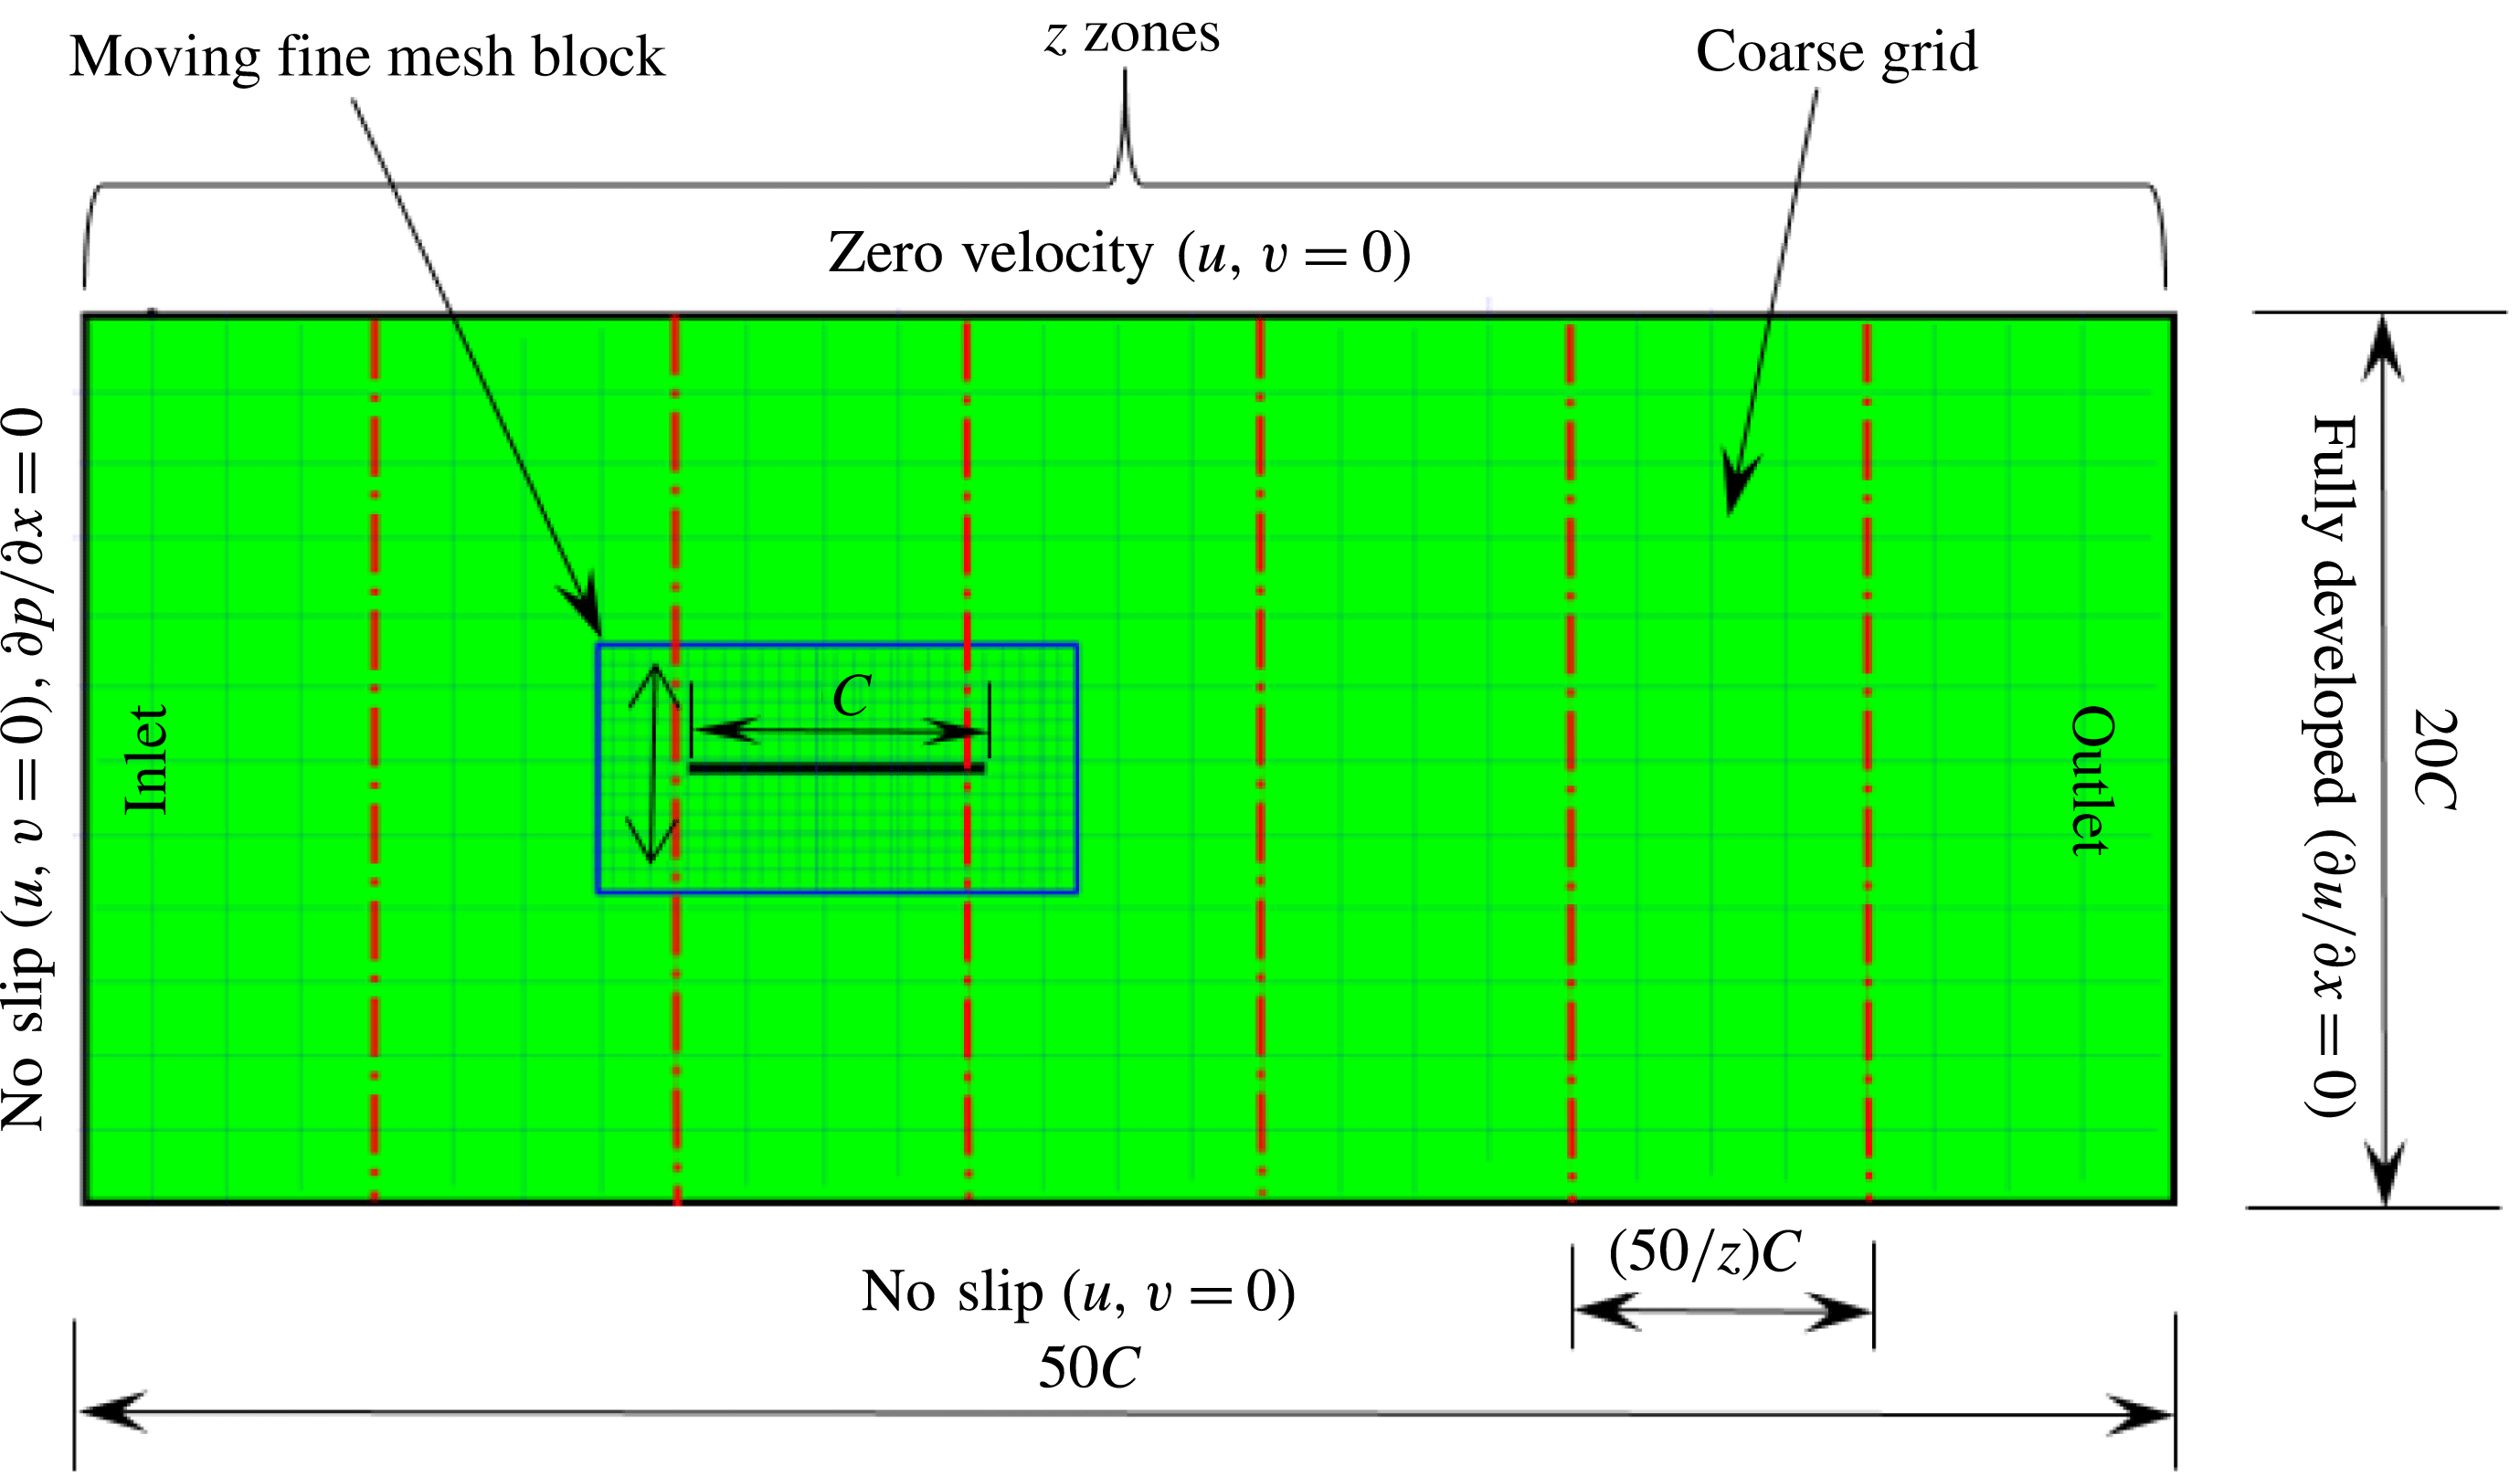
To obtain leverage from the use of the LBM, the developed solver was parallelized using MPI (message passing interface) in which the domain along the
 $x$
direction was sliced into
 $\boldsymbol{z}$
sub-zones, where
 $\boldsymbol{z}$
is the number of processors. Thus, each processor was assigned a sub-domain of
 $(50/\boldsymbol{z})C\times 20C$
physical size. On average, a 24-core
 $i7$
processor was able to perform simulations for
 ${\sim}25$
flapping cycles per day (which varied with flapping frequency or
 $Re_{f}$
) for the large domain considered in this work.
Mesh resolution for different cases compared in figure 3.

To test for the mesh independence and convergence of the numerical method employed for the flexible wing simulations, three cases with progressively finer mesh resolutions were examined. In case 1, a uniform coarse grid without any local refinement was considered. In cases 2 and 3, a fine mesh was taken around the wing (with grid refinement ratio of 2). The description of the grid spacing for these cases is given in table 1. The dimensions of the dynamic fine mesh block which moved along with the wing was taken as
 $2C\times 3C$
to ensure that the plunging plate was well confined within the boundaries of the fine block. The convergence test for the size of the moving mesh was also performed and it was observed that the horizontal velocity profile with the current dimensions of the moving fine mesh exhibited good agreement with the stationary fine mesh that spanned the entire horizontal length of the computational domain (i.e.
 $50C\times 3C$
).
A comparison in (a) of thrust and drag coefficient and (b) angular deflection of the first linkage with different grid spacings at
 $Re_{f}=100$
and
 $\unicode[STIX]{x1D713}=0.6$
. The description of the mesh resolution for these cases is given in table 1. Zoomed versions of the rectangular snapshots are shown alongside.
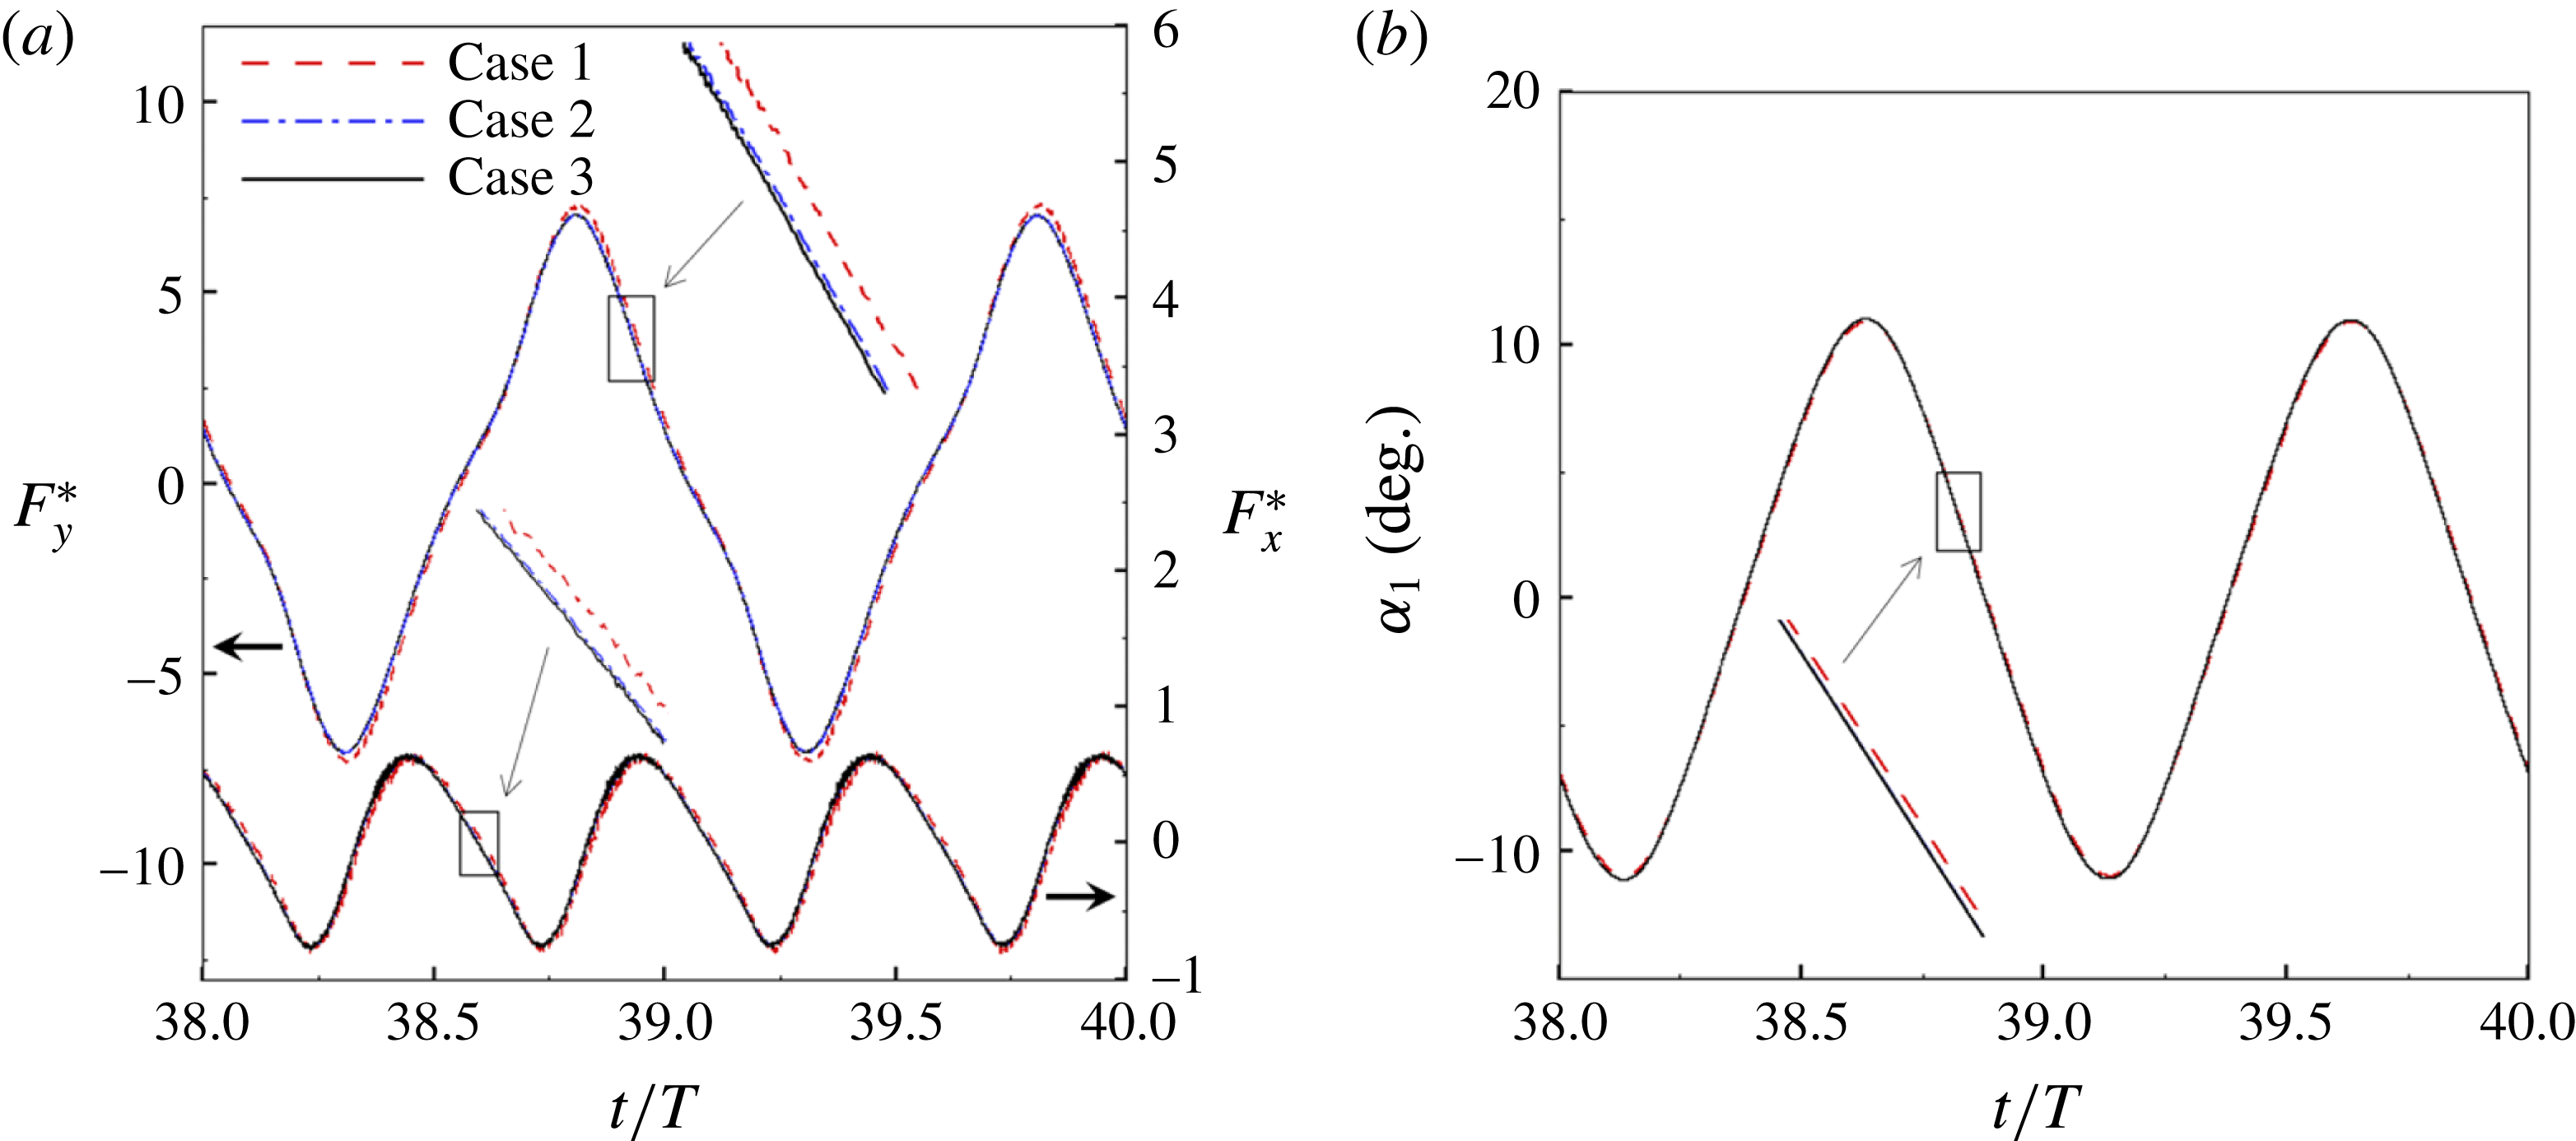
A comparison of the instantaneous dimensionless thrust and drag for these cases is shown in figure 3(a). As evident, there is not much deviation in the forces and the degree of quantitative agreement with case 3 improves from case 1 to case 2. As shown in figure 3(b), a similar trend was observed in the angular deflections of the first spring as exhibited by the overlapping curves. However, to achieve a balance between the accuracy associated with mesh resolution and computational cost, the grid parameters corresponding to case 2 were chosen for performing all numerical simulations.
3.4 Validation
The validation of the flow solver involving the force calculation and flow evolution around rigid bodies translating in a fluid can be found in our earlier publications (Arora et al.
Reference Arora, Gupta, Sanghi, Aono and Shyy2014, Reference Arora, Gupta, Sanghi, Aono and Shyy2016a
,Reference Arora, Gupta and Shyy
b
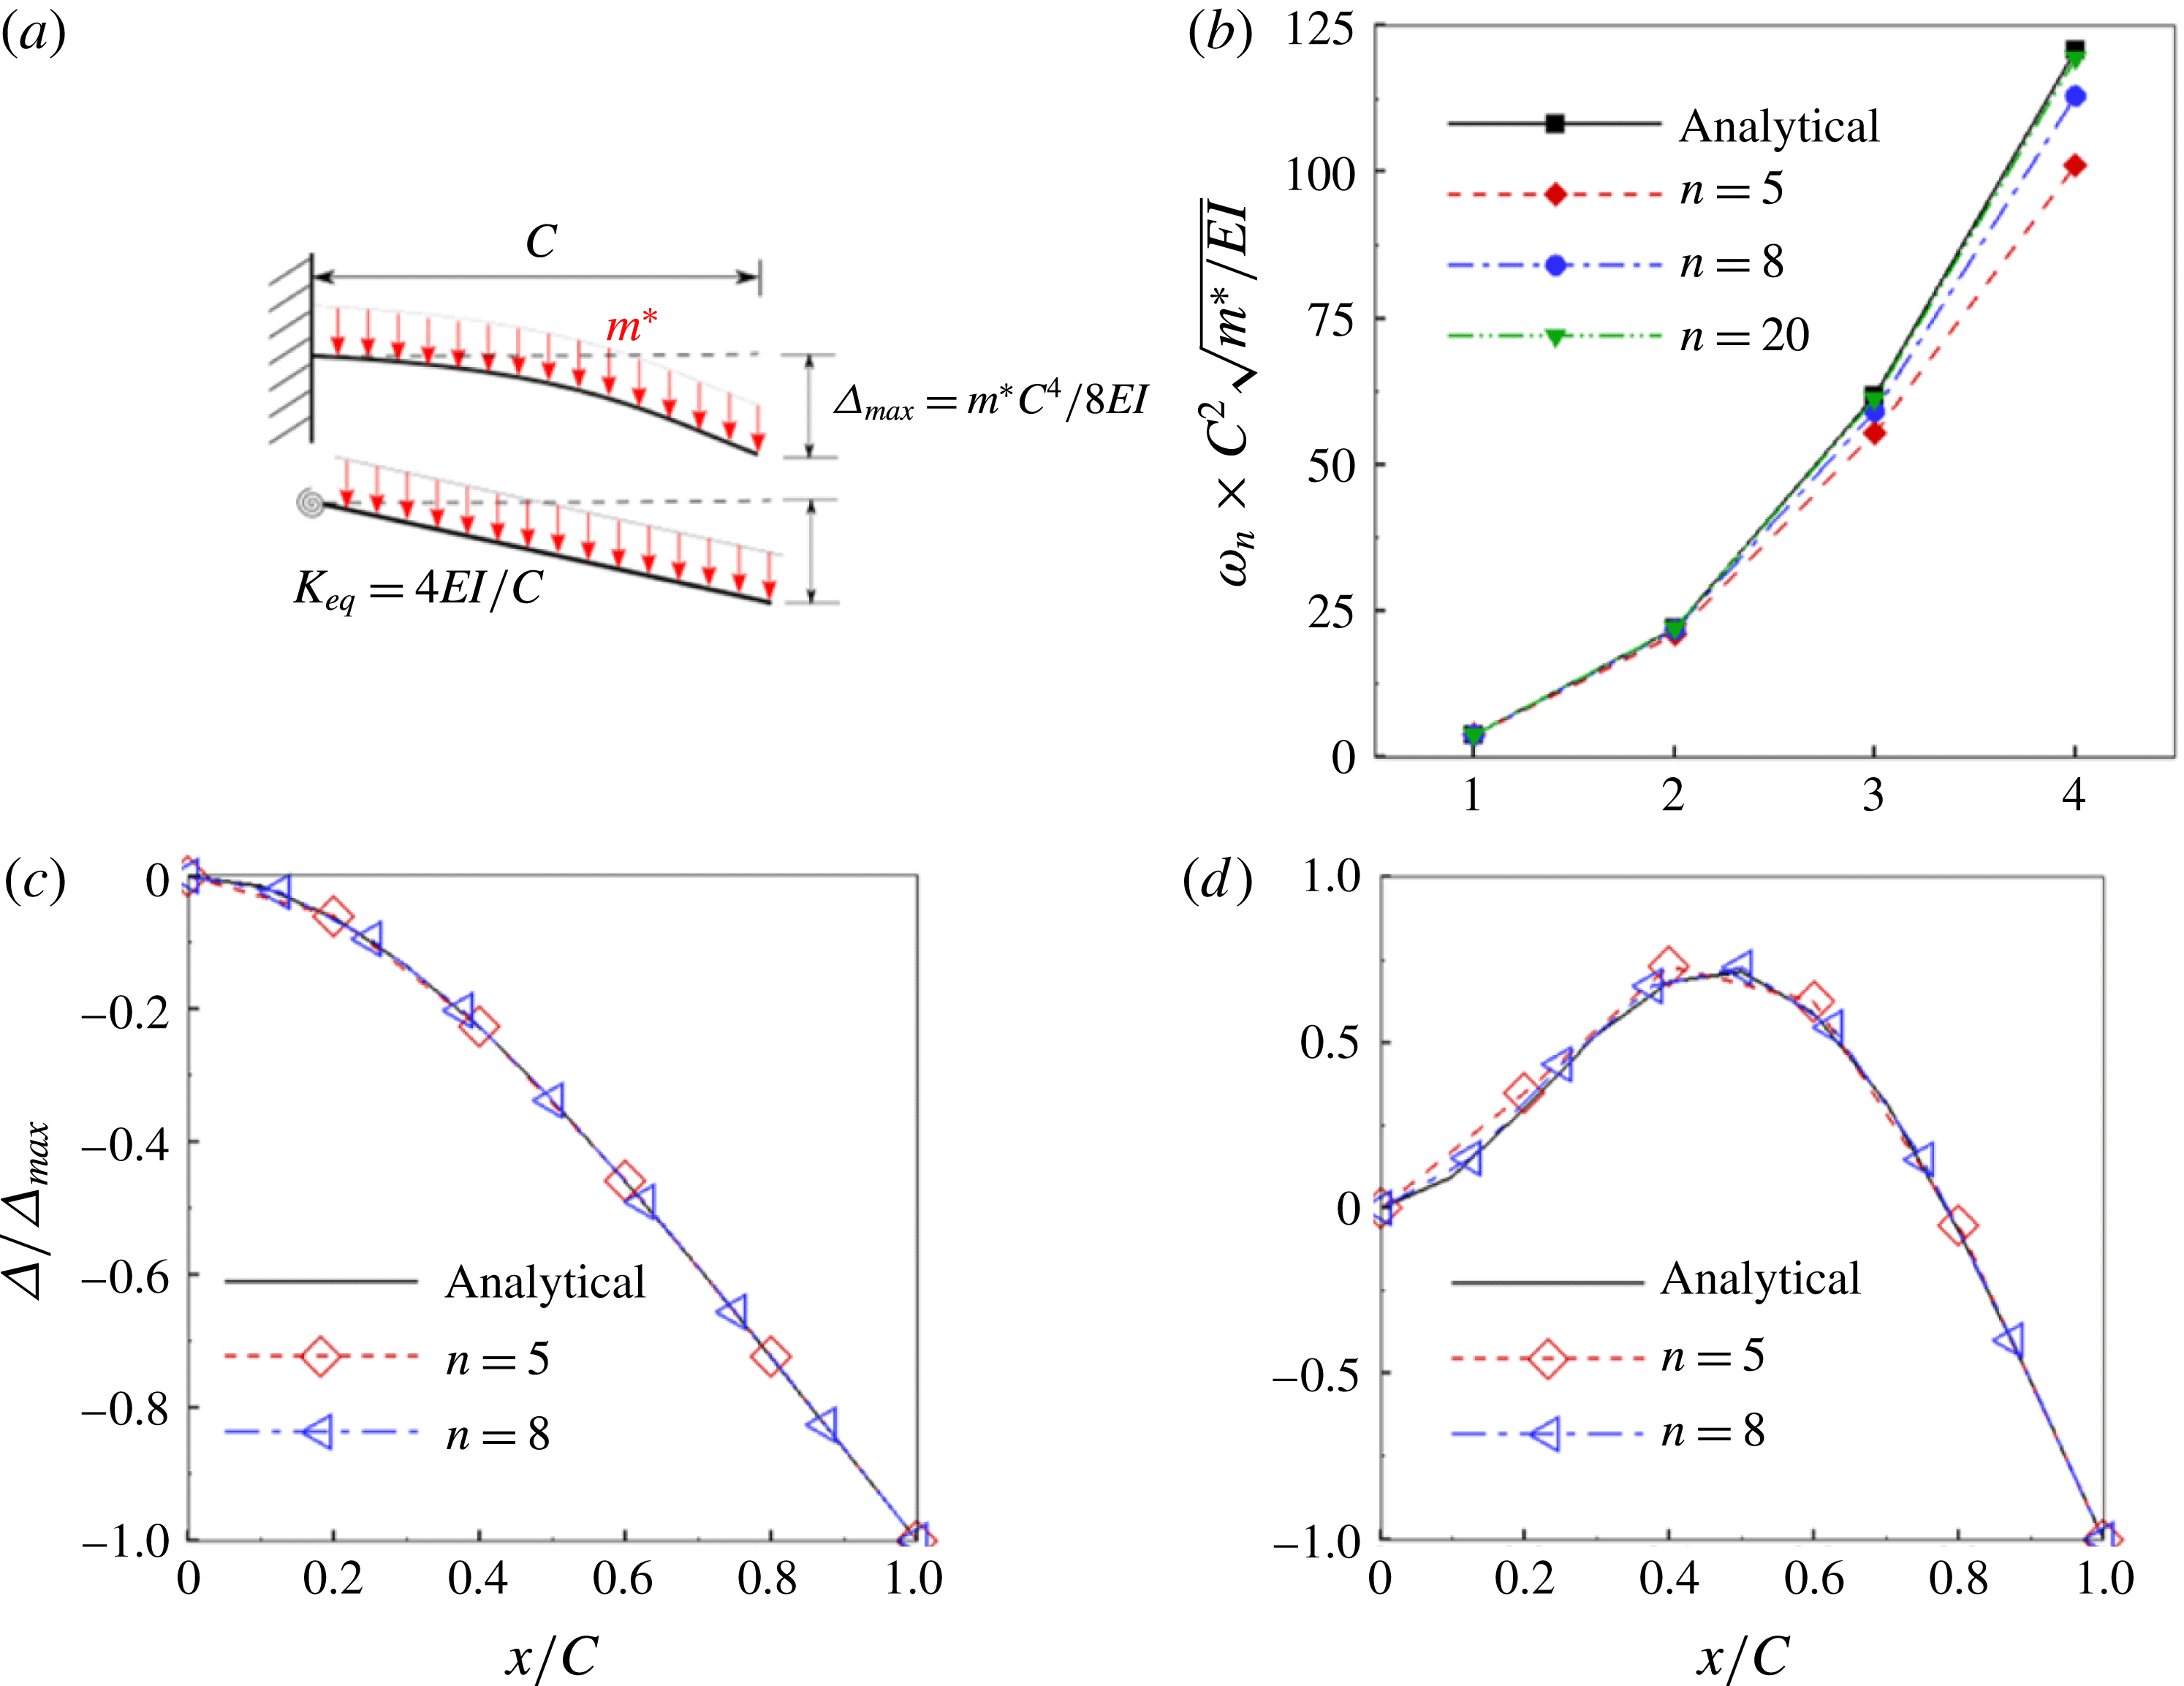
). To validate the structural solver, natural frequencies and mode shapes of vibration obtained with the existing solver were compared with the analytical solution of the linear Euler–Bernoulli beam equation by varying the number of linkages. With plunging kinematics imposed on the leading edge, a plate with constant
 $\unicode[STIX]{x1D70C}^{\ast }$
can be considered analogous to a cantilever beam subjected to a uniformly distributed load (UDL). The Euler–Bernoulli equation governing the bending of this beam subjected to a transverse load has a closed form solution when linearized (i.e. under the limit of small deflection and ignoring the shear deformation). The analytical solution for the natural frequencies and corresponding mode shapes of vibration for different boundary conditions of a beam exists in the literature (Genta Reference Genta2009) and has been used for the validation of the structural solver. For the sake of comparison, the equivalent stiffness of a single torsion spring–plate system when subjected to the same transverse load was found as
 $K_{eq}=4EI/C$
corresponding to the same tip deflection as that of the cantilever (i.e.
 $\unicode[STIX]{x1D6E5}_{max}=m^{\ast }C^{4}/(8EI)$
, where
 $m^{\ast }$
is the mass per unit length and
 $EI$
is the flexural rigidity of the beam) and is shown in figure 4(a). In a similar fashion, a uniform
 $K_{eq}$
was calculated for multiple linkages as well. Thus, using this value of
 $K_{eq}$
for vibration analysis, (3.13) reduces to an eigenvalue problem whose solution gives natural frequencies as eigenvalues and corresponding mode shapes as the eigenvectors. Figure 4(b) compares the first four natural frequencies for different numbers of links
 $n$
. As evident, the difference between analytically and numerically obtained natural frequencies diminishes with an increase in number of linkages. Even with
 $n=5$
and 8, excellent agreement in the first two natural frequencies can be observed, even though some disparity is noticeable in the third and fourth natural frequencies. Since the operating frequency of an insect wing is close to the first or second natural frequency (Zhang et al.
Reference Zhang, Liu and Lu2010; Kang & Shyy Reference Kang and Shyy2013) only, the number of linkages in this study was chosen as 5, which also enabled us to keep the computational cost manageable. The first two normalized mode shapes of vibration, shown in figure 4(c,d), corroborate the assumption, as there is an excellent agreement with the analytical solution.
(a) A schematic representation of an equivalent stiffness of a single spring–plate system corresponding to same maximum deflection as that of a Euler–Bernoulli beam subjected to the same transverse load. A comparison between the analytical solution and the
 $n$
link torsional flexibility model for (b) the first four natural frequencies of a cantilever beam, and (c) first and (d) second normalized mode shapes of a cantilever between with different numbers of linkages.
(a) Schematic of a two-component flexible wing performing hovering motion as considered by Eldredge et al. (Reference Eldredge, Toomey and Medina2010). Variation of (b,c) lift coefficient and (d) angular deflection of passive membrane with time at
 $Re_{u}=220$
for different kinematic parameters compared against Eldredge et al. (Reference Eldredge, Toomey and Medina2010).
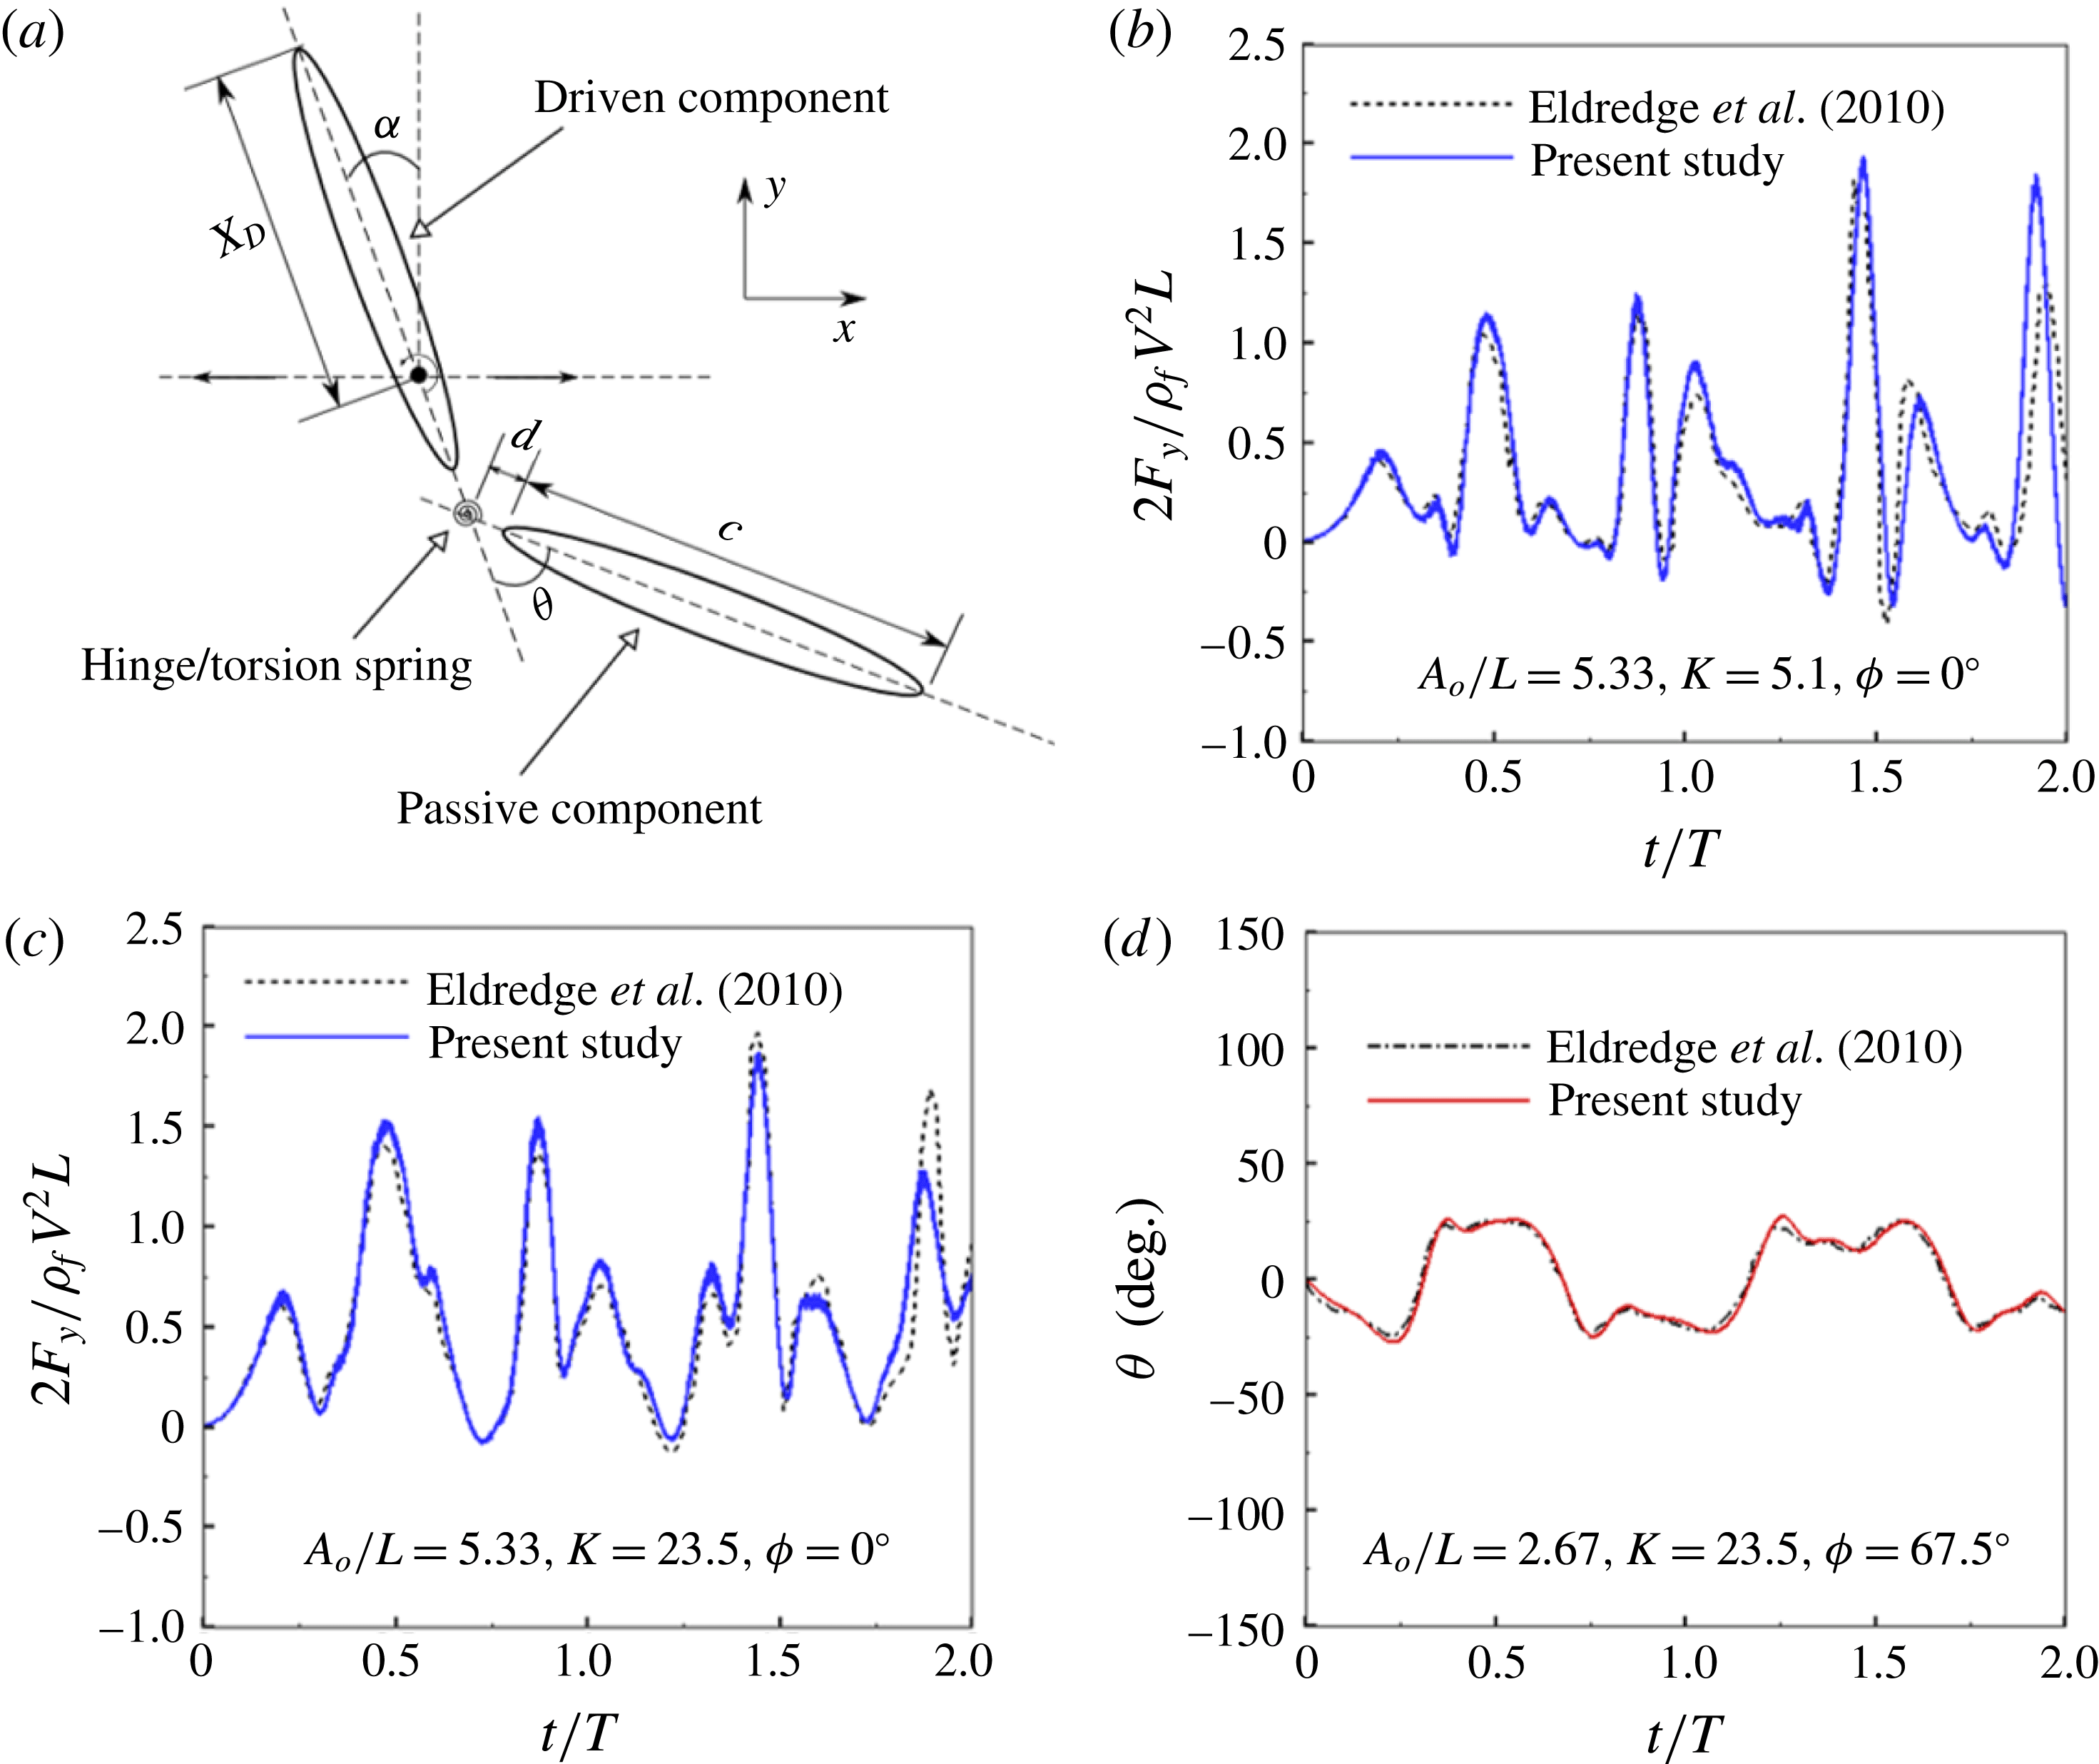
To further test the applicability and coupling of the fluid with the structural (i.e. combined FSI) solver, validation was performed against results by Eldredge et al. (Reference Eldredge, Toomey and Medina2010), where two rigid elliptical membranes linked through a torsion spring with the system performing hovering motion was considered. The leading and trailing ellipses acted as active and passive membranes, respectively. The simulations were carried out at a fixed translational Reynolds number
 $Re_{u}=220$
, where
 $Re_{u}=VL/\unicode[STIX]{x1D708}$
(
 $V$
is the peak translational velocity and
 $L$
is the total length of the body) with an aspect ratio of 5 and mass density ratio
 $\unicode[STIX]{x1D70C}^{\ast }=5$
. The pictorial representation of the two-component system (adapted from Eldredge et al.
Reference Eldredge, Toomey and Medina2010) is shown in figure 5(a). Further, the gap between the two membranes
 $d$
was chosen to be
 $0.05c$
and
 $L$
to be
 $2.1c$
. The position of the pitching axis about which the oscillatory (translational) and rotational (pitching) kinematics were imposed,
 $X_{D}/L$
, was 0.48. The dimensionless heaving amplitude
 $A_{0}/L$
was 2.67 and 5.33 and the phase difference between pitching and heaving
 $\unicode[STIX]{x1D719}$
was taken to be 0 to
 $67.5^{\circ }$
. The stiffness,
 $K^{\ast }$
, and damping coefficient,
 $R^{\ast }$
, of torsion spring were also non-dimensionalized as per the expressions
 $K=K^{\ast }/(\unicode[STIX]{x1D70C}_{f}f^{2}L^{4})$
and
 $R=R^{\ast }/(\unicode[STIX]{x1D70C}_{f}f^{2}L^{4})$
, respectively. Here
 $f$
is the hovering frequency (
 $f=1/T$
,
 $T$
is the time period of one cycle).
 $R$
was fixed at 0.2, whereas
 $K$
took a value of 5.1 or 23.
Based on these parameters, simulations were performed for a two-component wing using the same kinematics. As no information was provided on the size of the domain and boundary conditions imposed by Eldredge et al. (Reference Eldredge, Toomey and Medina2010), a computational domain of size
 $25L\times 25L$
was taken with periodic boundary conditions on all four sides for carrying out the comparisons. Figure 5(b,c,d) shows a comparison of the time variation of lift coefficient and angular deflection of the passive wing between the present study and Eldredge et al. (Reference Eldredge, Toomey and Medina2010) for the selected parameters. The results obtained show good agreement both qualitatively and quantitatively and validate the coupled FSI solver as well. The discrepancy in the later period of the computations could be due to dissimilarity in the choice of boundary conditions and domain size.
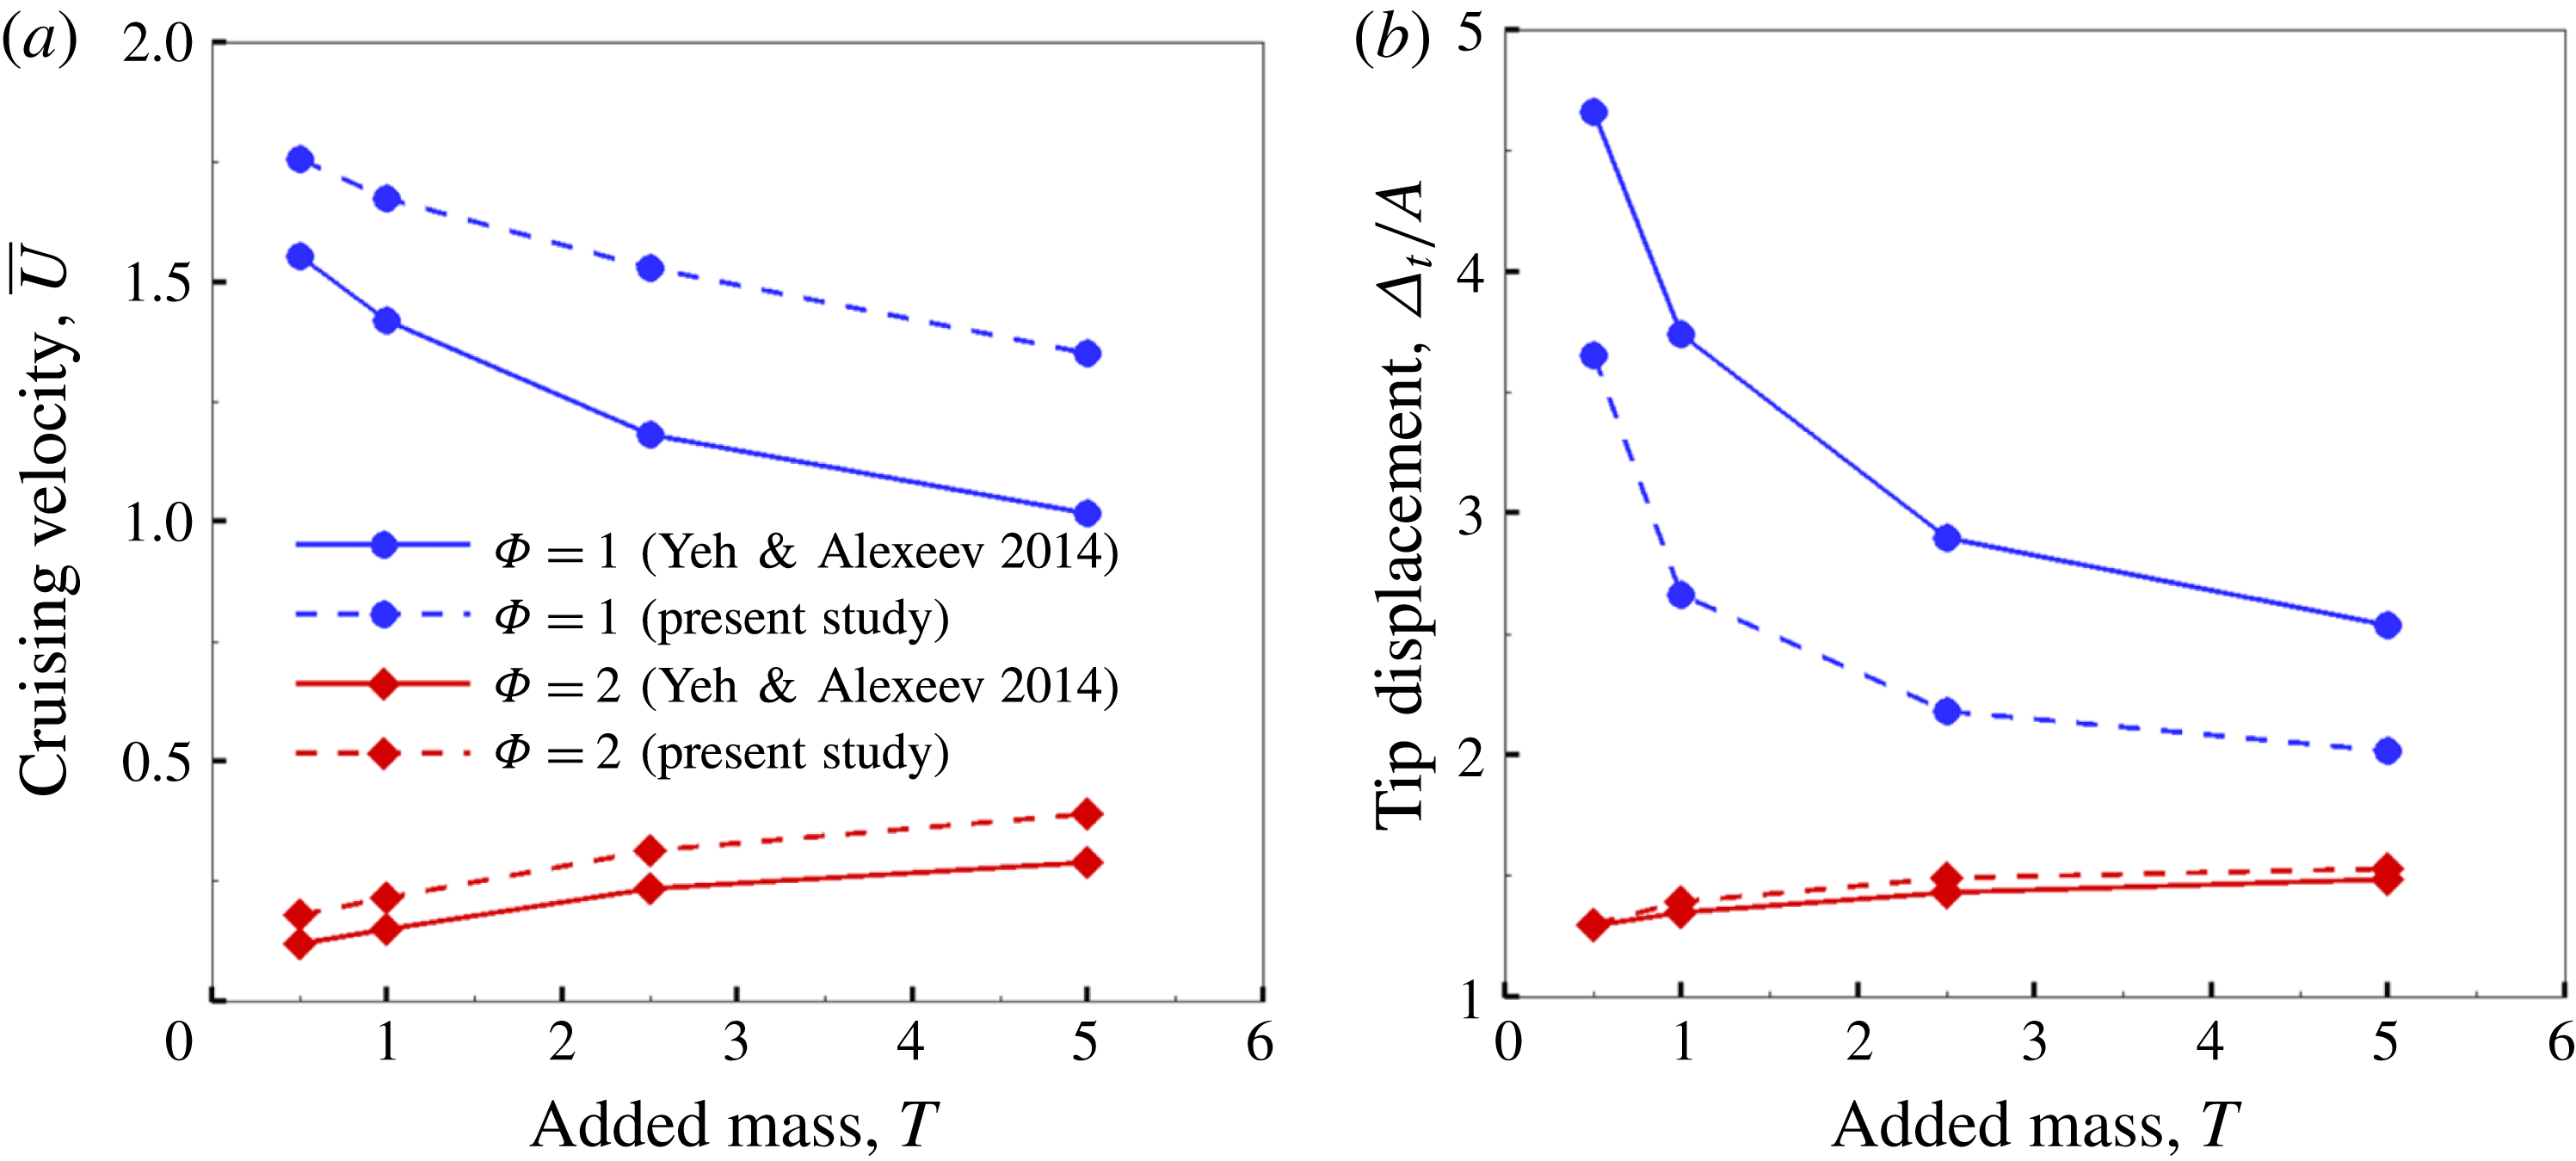
Finally, simulations were also conducted to validate our solver with the results of Yeh & Alexeev (Reference Yeh and Alexeev2014) for
 $\hat{Re}_{f}=2\unicode[STIX]{x03C0}A\unicode[STIX]{x1D6FE}C/\unicode[STIX]{x1D708}=250$
and
 $\unicode[STIX]{x1D6FD}=A/C=0.1$
. Simulations were done for a flexible plunging plate by normalizing the plunge frequency using the natural frequency in the fluid (
 $\unicode[STIX]{x1D714}_{n,fluid}$
) (Sader Reference Sader1998) as
 $\unicode[STIX]{x1D714}_{fluid}^{\ast }=\unicode[STIX]{x1D714}_{n,fluid}/\unicode[STIX]{x1D714}$
. Figure 6 shows a comparison of the dimensionless propulsion velocity
 $\bar{U}$
and dimensionless tip displacement
 $\unicode[STIX]{x1D6E5}_{t}/A$
for different added mass values
 $T=1/(\unicode[STIX]{x1D70C}^{\ast }\unicode[STIX]{x1D6FF})$
at two different frequency ratios
 $\unicode[STIX]{x1D6F7}=1$
and
 $\unicode[STIX]{x1D6F7}=2$
(here
 $\unicode[STIX]{x1D6F7}=(\unicode[STIX]{x1D714}_{fluid}^{\ast })^{-1}$
) that were shown to correspond to maximum velocity and maximum performance, respectively (Yeh & Alexeev Reference Yeh and Alexeev2014). Good qualitative agreement is obtained for both cases with the opposite trend of velocities for the post-resonance frequencies (the forward velocity decreases with an increase in added mass and vice versa at
 $\unicode[STIX]{x1D6F7}=1$
and
 $\unicode[STIX]{x1D6F7}=2$
, respectively) being captured in our simulations. Also, figure 6(b) conforms with the finding in Yeh & Alexeev (Reference Yeh and Alexeev2014) that trailing-edge displacements are directly proportional to the cruising velocity. Although the comparison at
 $\unicode[STIX]{x1D6F7}=1$
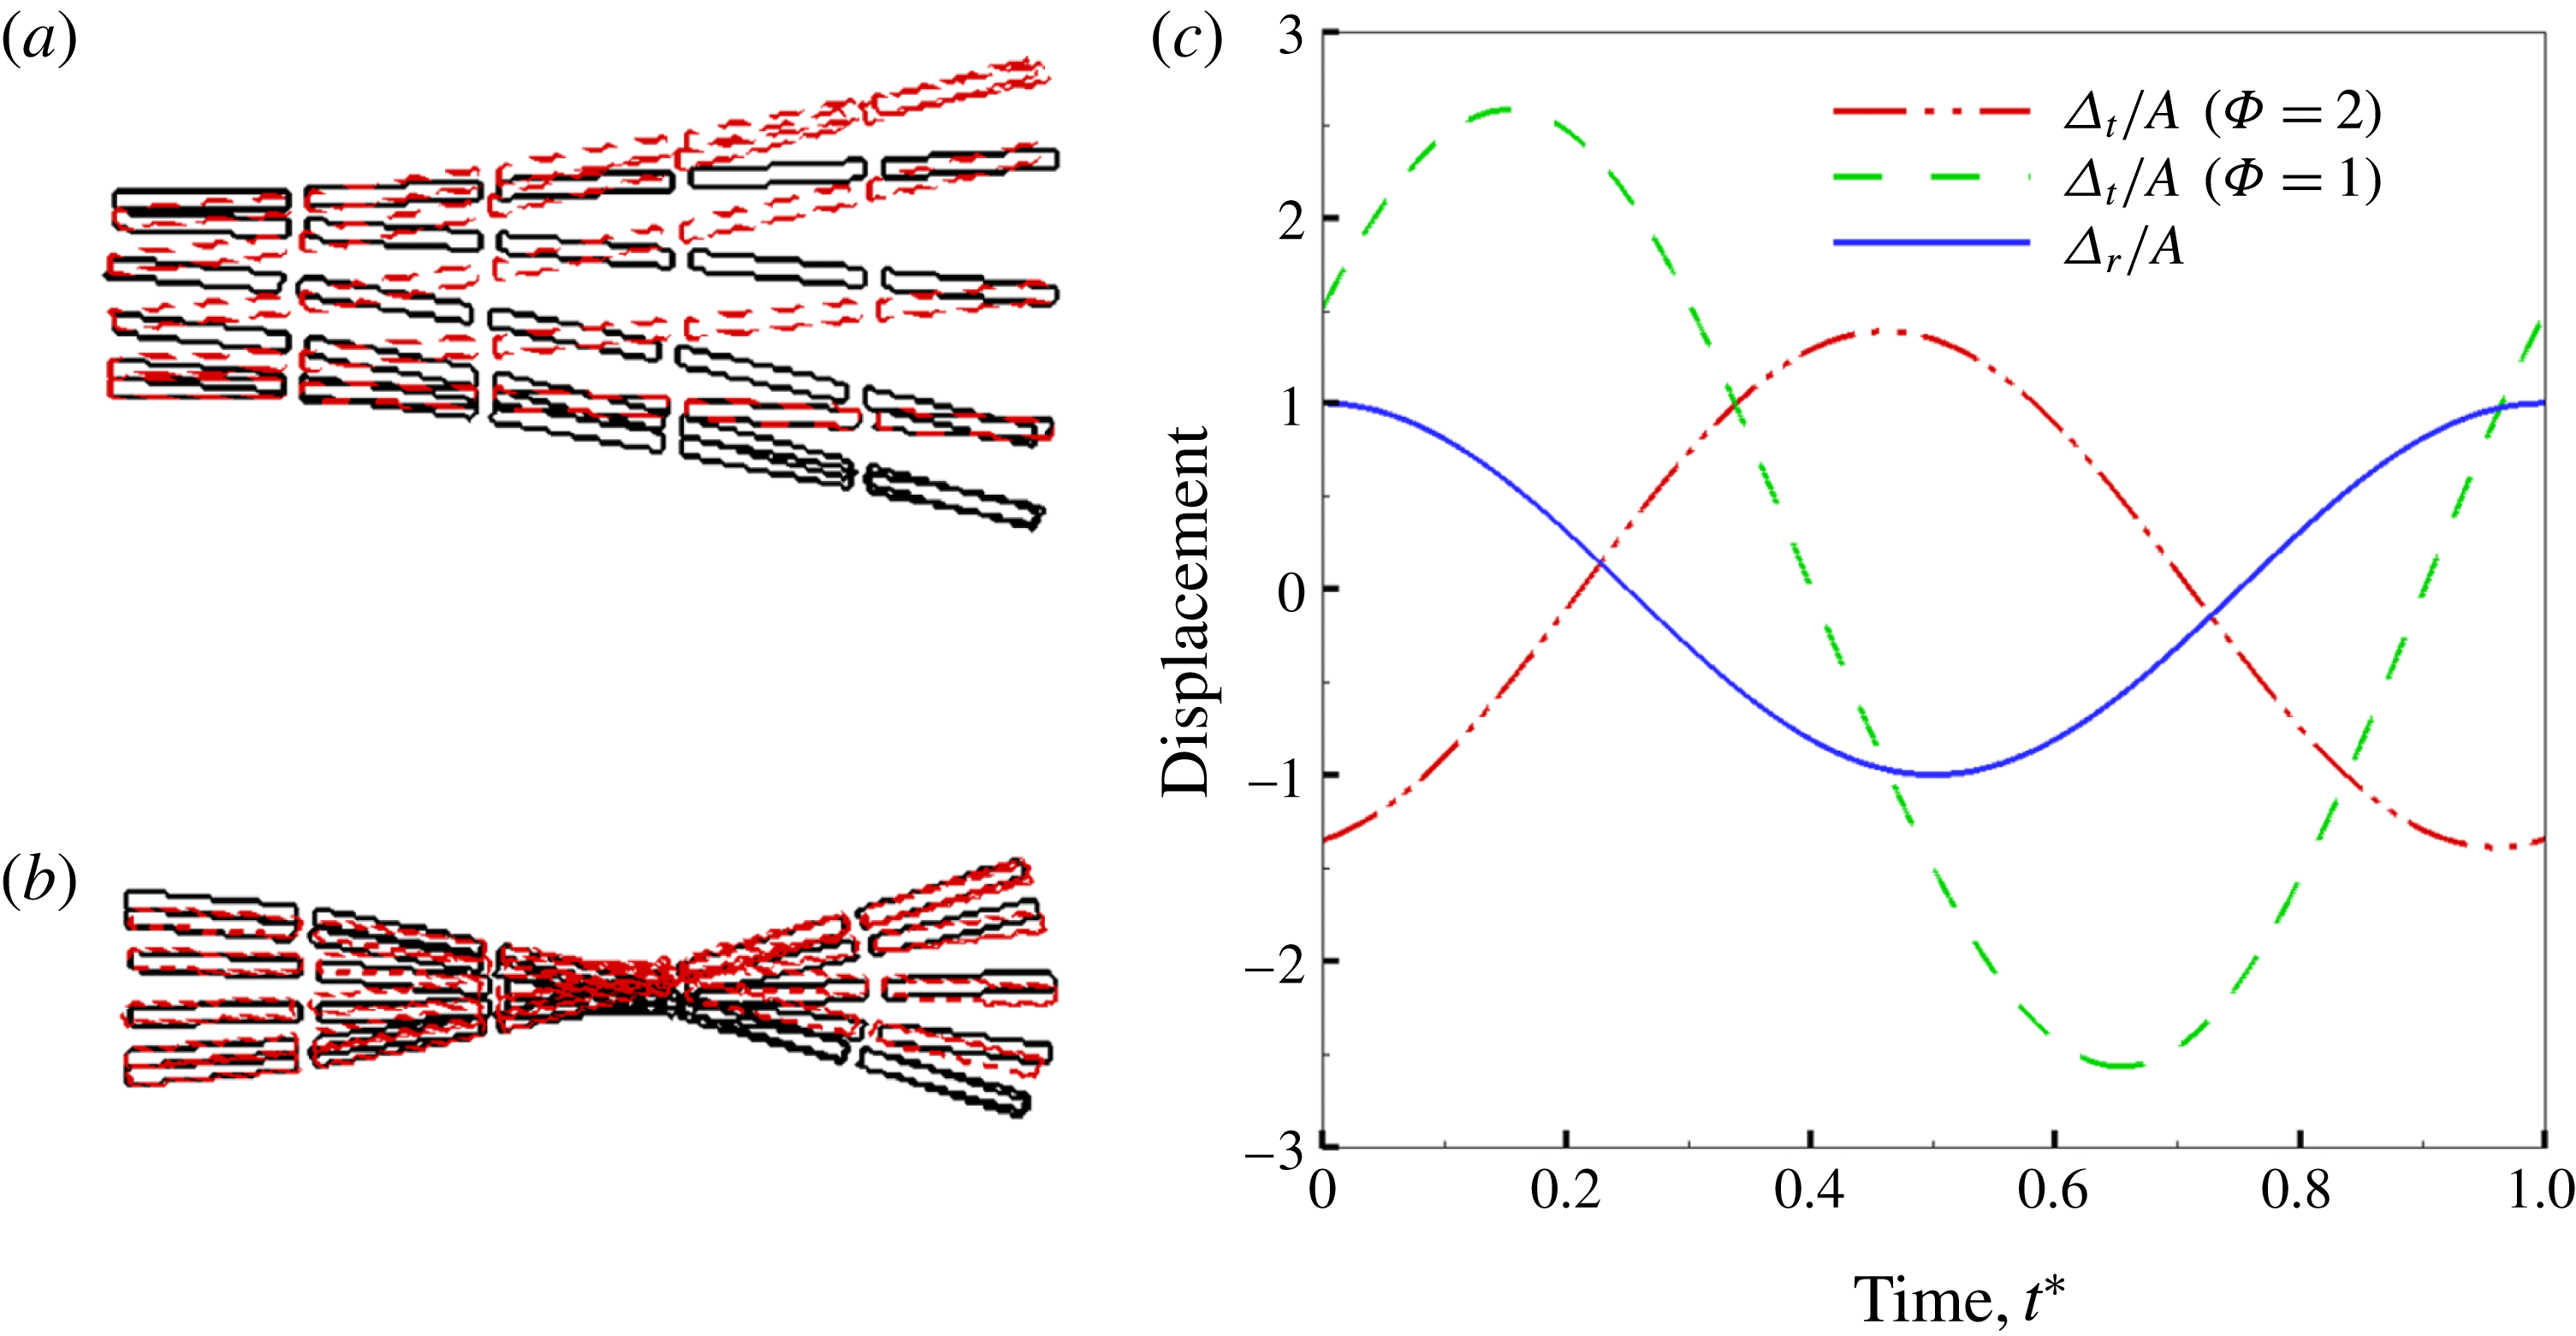
shows a slightly over-estimated and under-estimated magnitude of velocities and tip displacements, respectively, this is possibly due to the effect of tip vortices that is not captured in our simulations. Nevertheless, the wing shapes at
 $\unicode[STIX]{x1D6F7}=1$
and
 $\unicode[STIX]{x1D6F7}=2$
for
 $T=1$
plotted in figures 7(a) and 7(b), respectively show an exact resemblance to the bending patterns shown in figure 6(a) of Yeh & Alexeev (Reference Yeh and Alexeev2014). In addition, the tip and root displacements as a function of time in our simulations (figure 7
c) also corroborate and are consistent with their findings that showed that a phase difference of
 $\unicode[STIX]{x1D719}\approx \unicode[STIX]{x03C0}/2$
and
 $\unicode[STIX]{x1D719}\approx \unicode[STIX]{x03C0}$
is obtained at
 $\unicode[STIX]{x1D6F7}=1$
and
 $\unicode[STIX]{x1D6F7}=2$
, respectively. This further confirmed that the calculation of the resonance frequency in the fluid using the approach of Sader (Reference Sader1998) was correctly implemented since a phase difference of
 $\unicode[STIX]{x03C0}/2$
can be observed between plunging and tip displacement at
 $\unicode[STIX]{x1D6F7}=1$
. Thus, the numerical model was considered to be suitable for the analyses of fluid–structure interaction pertaining to the present problem.
(a) Dimensionless forward velocity (
 $\bar{U}$
) and (b) dimensionless tip displacement (
 $\unicode[STIX]{x1D6E5}_{t}/A$
) as a function of added mass (
 $T$
) and frequency ratio (
 $\unicode[STIX]{x1D6F7}$
) compared against Yeh & Alexeev (Reference Yeh and Alexeev2014).
Bending patterns of the wing at (a)
 $\unicode[STIX]{x1D6F7}=1$
and (b)
 $\unicode[STIX]{x1D6F7}=2$
for
 $T=1$
. Black solid and red dotted lines represent upstroke and downstroke, respectively. (c) Corresponding root displacement (
 $\unicode[STIX]{x1D6E5}_{r}$
) and tip displacement (
 $\unicode[STIX]{x1D6E5}_{t}$
) normalized with respect to amplitude as a function of time.
4 Results and discussion
4.1 Phenomenological approach
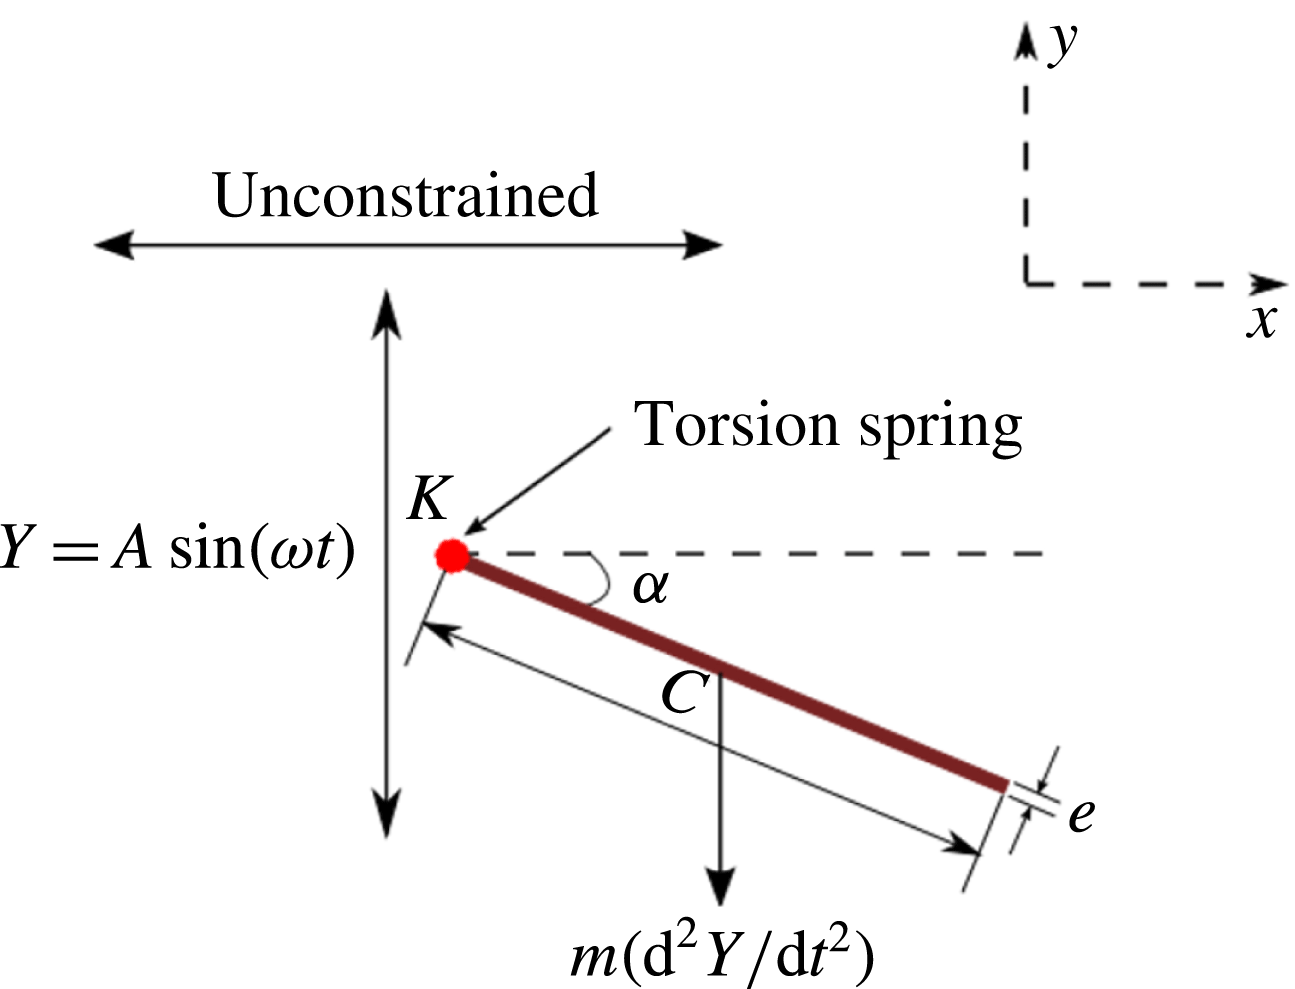
In order to obtain the phenomenological solution for the structural deformation or bending of the flexible plunging plate, a single spring–plate system (
 $n=1$
) is considered. As shown in figure 8, the torsion spring is attached at the leading edge.
A schematic diagram of the simplified flexibility model of a self-propelled plunging plate with a single torsion spring attached at its leading edge.
The dimensional form of vertical displacement imposed at the leading edge is given as
 $Y_{LE}=A\sin (\unicode[STIX]{x1D714}t)$
where
 $A$
is the plunging amplitude and
 $\unicode[STIX]{x1D714}=2\unicode[STIX]{x03C0}\unicode[STIX]{x1D6FE}$
with
 $\unicode[STIX]{x1D6FE}$
being the prescribed plunging frequency. Thus, the leading-edge plunging velocity
 ${\dot{Y}}_{LE}$
and acceleration
 $\ddot{Y} _{LE}$
are given as
 $$\begin{eqnarray}{\dot{Y}}_{LE}=V\cos (\unicode[STIX]{x1D714}t),\quad \ddot{Y} _{LE}=-\unicode[STIX]{x1D714}^{2}A\sin (\unicode[STIX]{x1D714}t),\end{eqnarray}$$
where
 $V=\unicode[STIX]{x1D714}A$
is the maximum plunging velocity.
As shown in the experiments of Vandenberghe, Zhang & Childress (Reference Vandenberghe, Zhang and Childress2004) and simulations of Alben & Shelley (Reference Alben and Shelley2005), the self-propulsion velocity
 $\bar{u}$
is proportional to the plunge amplitude
 $A$
and frequency
 $\unicode[STIX]{x1D6FE}$
in a wide flow regime. Hence, for a self-propelled single torsion spring–plate system plunging in a quiescent fluid, the dynamics of angular deflection is governed by (2.7), where
 $\unicode[STIX]{x1D6EC}_{a}$
corresponds to the moment exerted by the aerodynamic force (per unit span) and scales as
 $$\begin{eqnarray}\unicode[STIX]{x1D6EC}_{a}\sim p_{dynamic}xC^{2}\sim {\textstyle \frac{1}{2}}\unicode[STIX]{x1D70C}_{f}(\unicode[STIX]{x1D6FE}A)^{2}xC^{2},\end{eqnarray}$$
where
 $x$
is the fraction of chord length (from
 $LE$
) where the centre of pressure (COP) is situated. From numerical simulations, it was observed that
 $x$
is close to 0.5 for rigid plates (i.e. cycle-averaged COP coincided with the centre of gravity for the considered range of variables in Arora et al. (Reference Arora, Gupta, Sanghi, Aono and Shyy2016a
)). With an increase in flexibility the COP shifted towards the leading edge, which has also been reported in Zhao et al. (Reference Zhao, Huang, Deng and Sane2010), and
 $x$
varied from 0.25 to 0.5.
The aerodynamic moment can thus be represented as
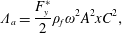 $$\begin{eqnarray}\unicode[STIX]{x1D6EC}_{a}=\frac{F_{y}^{\ast }}{2}\unicode[STIX]{x1D70C}_{f}\unicode[STIX]{x1D714}^{2}A^{2}xC^{2},\end{eqnarray}$$
where
 $F_{y}^{\ast }=f(Re_{f},\unicode[STIX]{x1D70C}^{\ast },\unicode[STIX]{x1D6FF},\unicode[STIX]{x1D6FD},\unicode[STIX]{x1D703})$
is the instantaneous drag coefficient (Arora et al.
Reference Arora, Gupta, Sanghi, Aono and Shyy2016a
) and
 $\unicode[STIX]{x1D703}$
is the instantaneous angle of attack.
For a self-propelled plunging plate,
 $\unicode[STIX]{x1D703}$
varies continuously during plunging which is given as
 $$\begin{eqnarray}\unicode[STIX]{x1D703}=\tan ^{-1}\left(\frac{{\dot{Y}}_{LE}}{u}\right),\end{eqnarray}$$
where
 $u$
is the instantaneous horizontal velocity. At the cruising condition, the wing propels with a velocity that is periodically varying, has a small amplitude and a frequency of oscillation that is much larger than
 $\dot{Y_{LE}}$
. Hence, the angle of attack could be considered as a function of the instantaneous leading-edge plunging velocity only. Subsequently, the drag coefficient
 $F_{y}^{\ast }$
and the aerodynamic moment
 $\unicode[STIX]{x1D6EC}_{a}$
can also be assumed to be varying with time as a cosine function (with reference to figure 7 in Arora et al. (Reference Arora, Gupta, Sanghi, Aono and Shyy2016a
)). This basis is in agreement with the study of Shih & Buchanan (Reference Shih and Buchanan1971) which showed that the inertia (or plunging kinematics) and aerodynamics are out of phase by an angle of
 $\unicode[STIX]{x03C0}/2$
. A third-degree polynomial (using surrogate models) for cruising power as a function of system variables (such as
 $Re_{f}$
,
 $\unicode[STIX]{x1D70C}^{\ast }$
,
 $\unicode[STIX]{x1D6FD}$
) was obtained in a previous study (Arora et al.
Reference Arora, Gupta, Sanghi, Aono and Shyy2016a
). From this study, mean drag
 $\langle F_{y}^{\ast }\rangle$
can be obtained directly from (2.6) to derive the phenomenological solution.
Substituting the expression for aerodynamic and structural inertia moments, (2.7) can thus be rewritten as
 $$\begin{eqnarray}I\frac{\text{d}^{2}\unicode[STIX]{x1D6FC}}{\text{d}t^{2}}+\unicode[STIX]{x1D70E}\frac{\text{d}\unicode[STIX]{x1D6FC}}{\text{d}t}+K\unicode[STIX]{x1D6FC}=m\unicode[STIX]{x1D714}^{2}A\frac{C}{2}\cos \unicode[STIX]{x1D6FC}\sin \unicode[STIX]{x1D714}t-\frac{\langle F_{y}^{\ast }\rangle }{2}\unicode[STIX]{x1D70C}_{f}\unicode[STIX]{x1D714}^{2}A^{2}xC^{2}\cos \unicode[STIX]{x1D714}t.\end{eqnarray}$$
The first and second terms on the right-hand side are the magnitudes of the inertia and aerodynamic moments, respectively. Equation (4.5) is a nonlinear ordinary differential equation which can be linearized under the small angular deflection limit, i.e.
 $\cos \unicode[STIX]{x1D6FC}\approx 1$
, and can be solved analytically. We non-dimensionalize (4.5) by geometric, kinematic and structural parameters such as
 $$\begin{eqnarray}\displaystyle & \displaystyle m\sim \unicode[STIX]{x1D70C}_{s}eC & \displaystyle\end{eqnarray}$$
 $$\begin{eqnarray}\displaystyle & \displaystyle I=mC^{2}\left(\frac{1}{3}+\frac{\unicode[STIX]{x1D6FF}^{2}}{12}\right)\cong \unicode[STIX]{x1D70C}_{s}e\frac{C^{3}}{3}, & \displaystyle\end{eqnarray}$$
where the contribution of thickness to the mass moment of inertia has been ignored (as
 $\unicode[STIX]{x1D6FF}\ll 1$
). Finally, the following equation governing the dynamics of a single-spring rigid plate system is obtained,
 $$\begin{eqnarray}\frac{\unicode[STIX]{x1D70C}^{\ast }\unicode[STIX]{x1D6FF}}{3}\frac{\ddot{\unicode[STIX]{x1D6FC}}}{\unicode[STIX]{x1D6FE}^{2}}+\unicode[STIX]{x1D70E}^{\ast }\frac{\dot{\unicode[STIX]{x1D6FC}}}{\unicode[STIX]{x1D6FE}}+K^{\ast }\unicode[STIX]{x1D6FC}=2\unicode[STIX]{x03C0}^{2}\unicode[STIX]{x1D70C}^{\ast }\unicode[STIX]{x1D6FF}\unicode[STIX]{x1D6FD}\sin \unicode[STIX]{x1D714}t-2\unicode[STIX]{x03C0}^{2}\unicode[STIX]{x1D6FD}^{2}\langle F_{y}^{\ast }\rangle x\cos \unicode[STIX]{x1D714}t,\end{eqnarray}$$
where
 $\unicode[STIX]{x1D70E}^{\ast }$
is the dimensionless damping coefficient and defined as
 $\unicode[STIX]{x1D70E}^{\ast }=2\unicode[STIX]{x1D709}\sqrt{(K^{\ast }\unicode[STIX]{x1D70C}^{\ast }\unicode[STIX]{x1D6FF})/3}$
. An insect wing is usually underdamped and the structural damping is negligible (Chen, Chen & Chou Reference Chen, Chen and Chou2008) and thus has been ignored in this study.
The solution to this ODE can be obtained by using the Laplace transformation (
 $LT$
) method (where the
 $LT$
of any function
 $f(t)$
is defined as
 ${\mathcal{L}}\{\,f(t)\}(s)=\int _{0}^{\infty }\text{e}^{-st}f(t)\,\text{d}t=F(s)$
such that
 ${\mathcal{L}}^{-1}\{F(s)\}=f(t)$
(see Adkins & Davidson Reference Adkins and Davidson2012)) and with initial conditions
 $\unicode[STIX]{x1D6FC}(0)=\dot{\unicode[STIX]{x1D6FC}}(0)=0$
,
 $$\begin{eqnarray}\unicode[STIX]{x1D6FC}(t^{\ast })=\unicode[STIX]{x1D6FC}_{0}\sin (2\unicode[STIX]{x03C0}t^{\ast }-\unicode[STIX]{x1D719}),\quad \text{where }\unicode[STIX]{x1D6FC}_{0}=\frac{3\unicode[STIX]{x1D6FD}(\unicode[STIX]{x1D713}^{2}+1)^{1/2}}{2[(\unicode[STIX]{x1D714}^{\ast })^{2}-1]},\end{eqnarray}$$
where
 $\unicode[STIX]{x1D714}^{\ast }=(1/2\unicode[STIX]{x03C0})\sqrt{3K^{\ast }/\unicode[STIX]{x1D70C}^{\ast }\unicode[STIX]{x1D6FF}}$
is the natural to plunging frequency ratio. Here
 $\unicode[STIX]{x1D6FC}_{0}$
is the amplitude of the angular deflection or passive pitching. Equation (4.10) shows that the passive pitching angle (
 $\unicode[STIX]{x1D6FC}$
) lags behind the plunging motion by a phase difference
 $\unicode[STIX]{x1D719}$
, given by
 $$\begin{eqnarray}\unicode[STIX]{x1D719}=\tan ^{-1}(\unicode[STIX]{x1D713}),\end{eqnarray}$$
where
 $\unicode[STIX]{x1D713}=\unicode[STIX]{x1D6FD}\langle F_{y}^{\ast }\rangle x/\unicode[STIX]{x1D70C}^{\ast }\unicode[STIX]{x1D6FF}$
. As evident from (4.9), the dynamics of passive bending of a plunging plate is governed by (i) the natural to plunging frequency ratio
 $\unicode[STIX]{x1D714}^{\ast }$
, and (ii) the parameter
 $\unicode[STIX]{x1D713}$
. The physical significance of this parameter will be discussed in the forthcoming sections. The drag coefficient
 $\langle F_{y}^{\ast }\rangle$
varied between 1.8 and 2.2 (based on surrogate models developed in Arora et al. (Reference Arora, Gupta, Sanghi, Aono and Shyy2016a
) for a rigid plate) and
 $x\approx 0.5$
for the range of parameters considered. However, this numerical observation of
 $\langle F_{y}^{\ast }\rangle x\approx 1$
is still applicable for small angular deflections (up to
 $15^{\circ }$
) which is within the limit of applicability of the phenomenological solution. The fact that the product of the COP moment arm and drag coefficient is approximately 1 leads to direct scope for comparison with input or design variables only and they are thereby excluded from the definition of the fluid–structure interaction (FSI) index which now becomes only a function of the kinematic parameter (
 $\unicode[STIX]{x1D6FD}$
) and structural parameters (
 $\unicode[STIX]{x1D70C}^{\ast }$
and
 $\unicode[STIX]{x1D6FF}$
). The parameter
 $\unicode[STIX]{x1D713}$
appears to have a close resemblance to the analytical solution obtained by Kang et al. (Reference Kang, Aono, Cesnik and Shyy2011) for maximum tip deflection (
 $\unicode[STIX]{x1D6F6}$
) which was shown to be a function of the aerodynamics, structural inertia, stiffness and added mass forces. The expression for
 $\unicode[STIX]{x1D6F6}$
for a given combination of stiffness and plunging frequency (or frequency ratio) was deduced as
 $$\begin{eqnarray}\unicode[STIX]{x1D6F6}\sim \frac{(1+A_{dd})St}{\unicode[STIX]{x1D70C}^{\ast }\unicode[STIX]{x1D6FF}k},\end{eqnarray}$$
where
 $A_{dd}=4\unicode[STIX]{x1D70C}^{\ast }\unicode[STIX]{x1D6FF}/\unicode[STIX]{x03C0}$
is the added mass for a flat plate and
 $k=St/\unicode[STIX]{x1D6FD}$
is the reduced frequency (according to the kinematics adopted in Kang et al. (Reference Kang, Aono, Cesnik and Shyy2011)). Note that when
 $A_{dd}$
is sufficiently small (i.e. for insects or flying animals), the above expression reduces to
 $$\begin{eqnarray}\unicode[STIX]{x1D6F6}\xrightarrow[{ignored}]{Added\;mass}\frac{St}{k\unicode[STIX]{x1D70C}^{\ast }\unicode[STIX]{x1D6FF}}\sim \frac{\unicode[STIX]{x1D6FD}}{\unicode[STIX]{x1D70C}^{\ast }\unicode[STIX]{x1D6FF}}=\unicode[STIX]{x1D713},\end{eqnarray}$$
which implies that the FSI index is a measure of tip deflection for the large amplitude considered herein. This substantiates the implications drawn from this work that large passive deformations are induced when aerodynamics dominates the structural inertia contribution (or
 $\unicode[STIX]{x1D713}$
increases). The parameter
 $\unicode[STIX]{x1D713}$
was also referred to as the ‘mass ratio’ in Thiria & Godoy-Diana (Reference Thiria and Godoy-Diana2010).
Rewriting (4.5), the following relationship between various moments governing the structural deformation is obtained,
 $$\begin{eqnarray}\underbrace{m\unicode[STIX]{x1D714}^{2}A\frac{C}{2}\sin \unicode[STIX]{x1D714}t}_{\mathit{Plunging}\;\mathit{inertia}\;\mathit{moment}}+\underbrace{(K-I\unicode[STIX]{x1D714}^{2})\unicode[STIX]{x1D6FC}_{0}\sin (\unicode[STIX]{x1D714}t-\unicode[STIX]{x1D719})}_{\mathit{Stiffness}\text{-}\mathit{inherent}\;\mathit{inertia}\;\mathit{moment}}-\underbrace{\unicode[STIX]{x1D70C}_{f}\unicode[STIX]{x1D714}^{2}A^{2}\frac{C^{2}}{2}\cos \unicode[STIX]{x1D714}t}_{\mathit{Aerodynamic}\;\mathit{moment}}=0.\end{eqnarray}$$
The structural inertia, stiffness and aerodynamics moments fluctuate at angular speed
 $\unicode[STIX]{x1D714}$
. The structural inertia moment is composed of two components: (i) plunging moment (
 $m\unicode[STIX]{x1D714}^{2}AC/2$
), which is always in phase with the plunging displacement
 $Y$
, and (ii) intrinsic inertia (
 $I\unicode[STIX]{x1D714}^{2}\unicode[STIX]{x1D6FC}_{0}$
), which happens to be in phase with the passive pitching angle
 $\unicode[STIX]{x1D6FC}$
. The stiffness moment (
 $K\unicode[STIX]{x1D6FC}_{0}$
) always opposes the angular displacement and thus leads pitching motion by a phase difference of
 $\unicode[STIX]{x03C0}$
(in phase with the pitching acceleration
 $\ddot{\unicode[STIX]{x1D6FC}}$
). The aerodynamic moment lags the plunging inertia or displacement by a phase difference of
 $\unicode[STIX]{x03C0}/2$
, as explained earlier. The phase difference
 $\unicode[STIX]{x1D719}$
ensures dynamic equilibrium and depends on the relative magnitude of the structural inertia and aerodynamics moment which is obtained as
 $$\begin{eqnarray}\tan \unicode[STIX]{x1D719}=\frac{\text{Aerodynamics}\;\text{moment}}{\text{Plunging}\;\text{inertia}\;\text{moment}}=\frac{\unicode[STIX]{x1D70C}_{f}\unicode[STIX]{x1D714}^{2}A^{2}\displaystyle \frac{C^{2}}{2}}{m\unicode[STIX]{x1D714}^{2}A\displaystyle \frac{C}{2}}=\frac{\unicode[STIX]{x1D6FD}}{\unicode[STIX]{x1D70C}^{\ast }\unicode[STIX]{x1D6FF}}=\unicode[STIX]{x1D713}.\end{eqnarray}$$
Hence, this non-dimensional number, the FSI index
 $\unicode[STIX]{x1D713}=\unicode[STIX]{x1D6FD}/\unicode[STIX]{x1D70C}^{\ast }\unicode[STIX]{x1D6FF}$
which is the ratio of aerodynamics to structural inertia moment, is a measure of fluid–structure interaction. The value of
 $\unicode[STIX]{x1D713}>1$
indicates a strong contribution of fluid forces in deforming the plate, whereas
 $\unicode[STIX]{x1D713}<1$
implies a weak interaction of the flexible body with the fluid;
 $\unicode[STIX]{x1D713}=0$
will be shown to represent no fluid interaction with the plunging plate. With reference to (4.13), the aerodynamics is involved in a twofold manner: (i) the horizontal component that is in phase with the structural damping introduces aerodynamic damping in the system (although this term has been ignored, but the structural damping vector
 $\unicode[STIX]{x1D70E}\unicode[STIX]{x1D714}\unicode[STIX]{x1D6FC}_{0}$
always leads the stiffness vector by
 $\unicode[STIX]{x03C0}/2$
and here the horizontal component of aerodynamics absorbs it), and (ii) the vertical component of the aerodynamics, moment which is in phase with the inherent inertia, assists wing deformation. The aerodynamics moment can thus be held responsible for inducing a phase difference between pitching and plunging (or in other words, between two components of the structural inertia moment). If the aerodynamics moment is negligible (
 $\unicode[STIX]{x1D713}\approx 0$
), the phase difference
 $\unicode[STIX]{x1D719}$
diminishes to zero and both the displacement and passive pitching come into phase. This can be further substantiated by demonstrating the behaviour of the phase difference
 $\unicode[STIX]{x1D719}$
with an increase in magnitude of
 $\unicode[STIX]{x1D713}$
and is elaborated in § A.1.
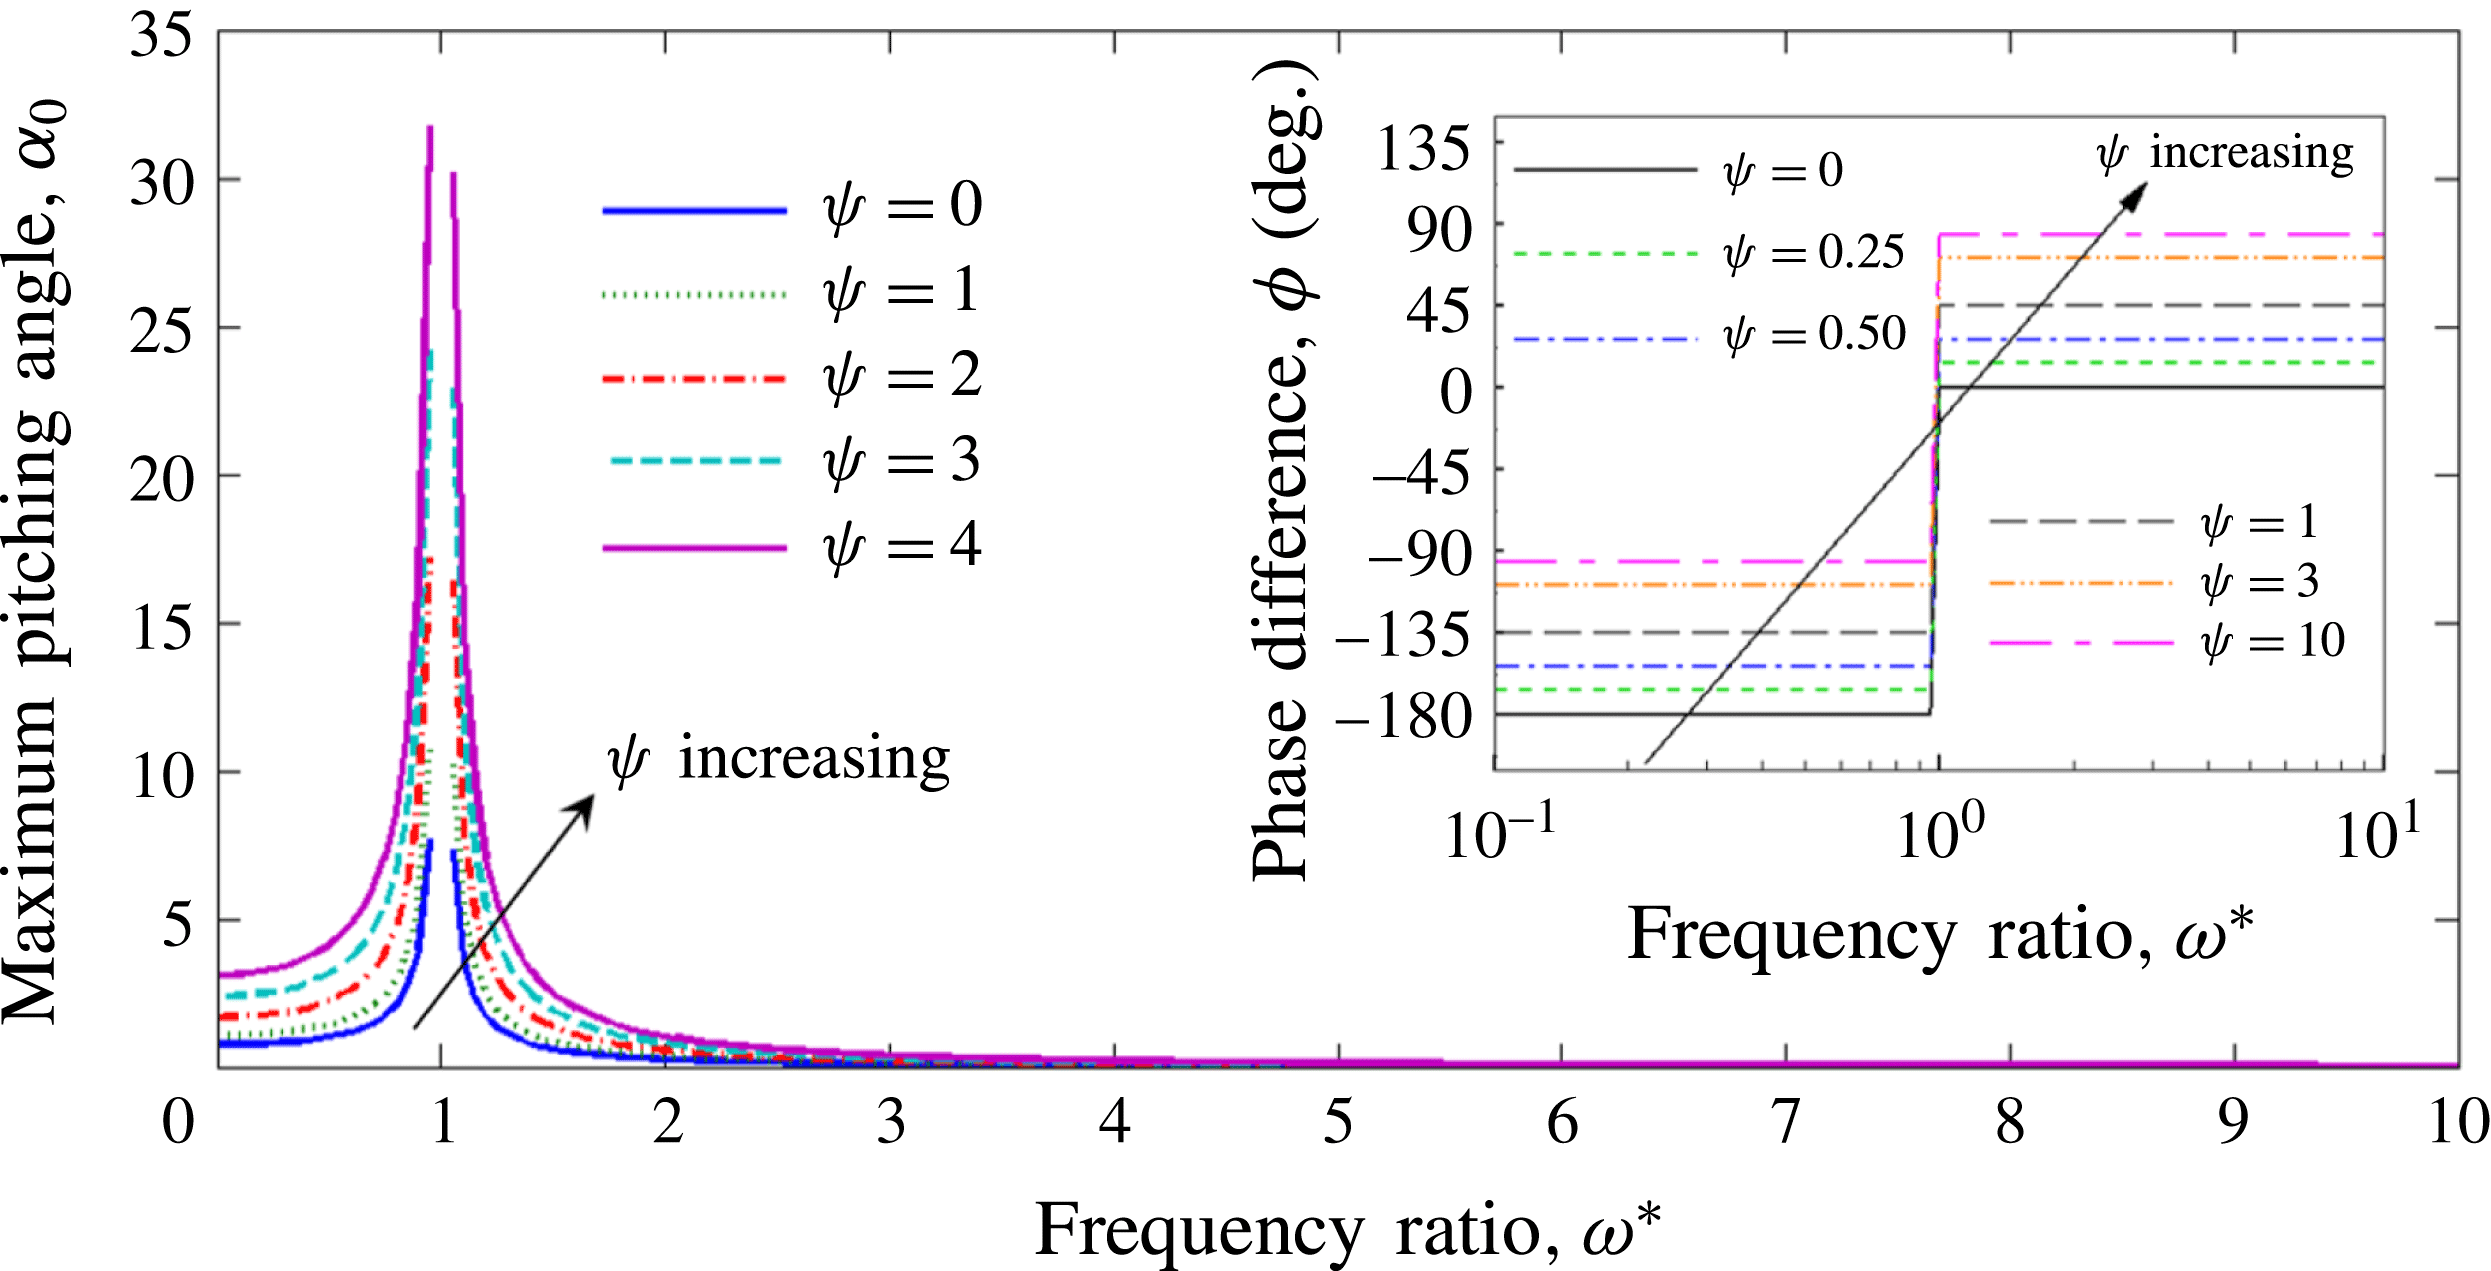
Comparison between phenomenological solution and numerical simulations of the maximum pitching angle
 $\unicode[STIX]{x1D6FC}_{0}$
as a function of frequency ratio and FSI index at
 $Re_{f}=20$
. Inset shows the numerically simulated phase difference
 $\unicode[STIX]{x1D719}$
as a function of
 $\unicode[STIX]{x1D714}^{\ast }$
and
 $\unicode[STIX]{x1D713}$
at
 $Re_{f}=40$
.
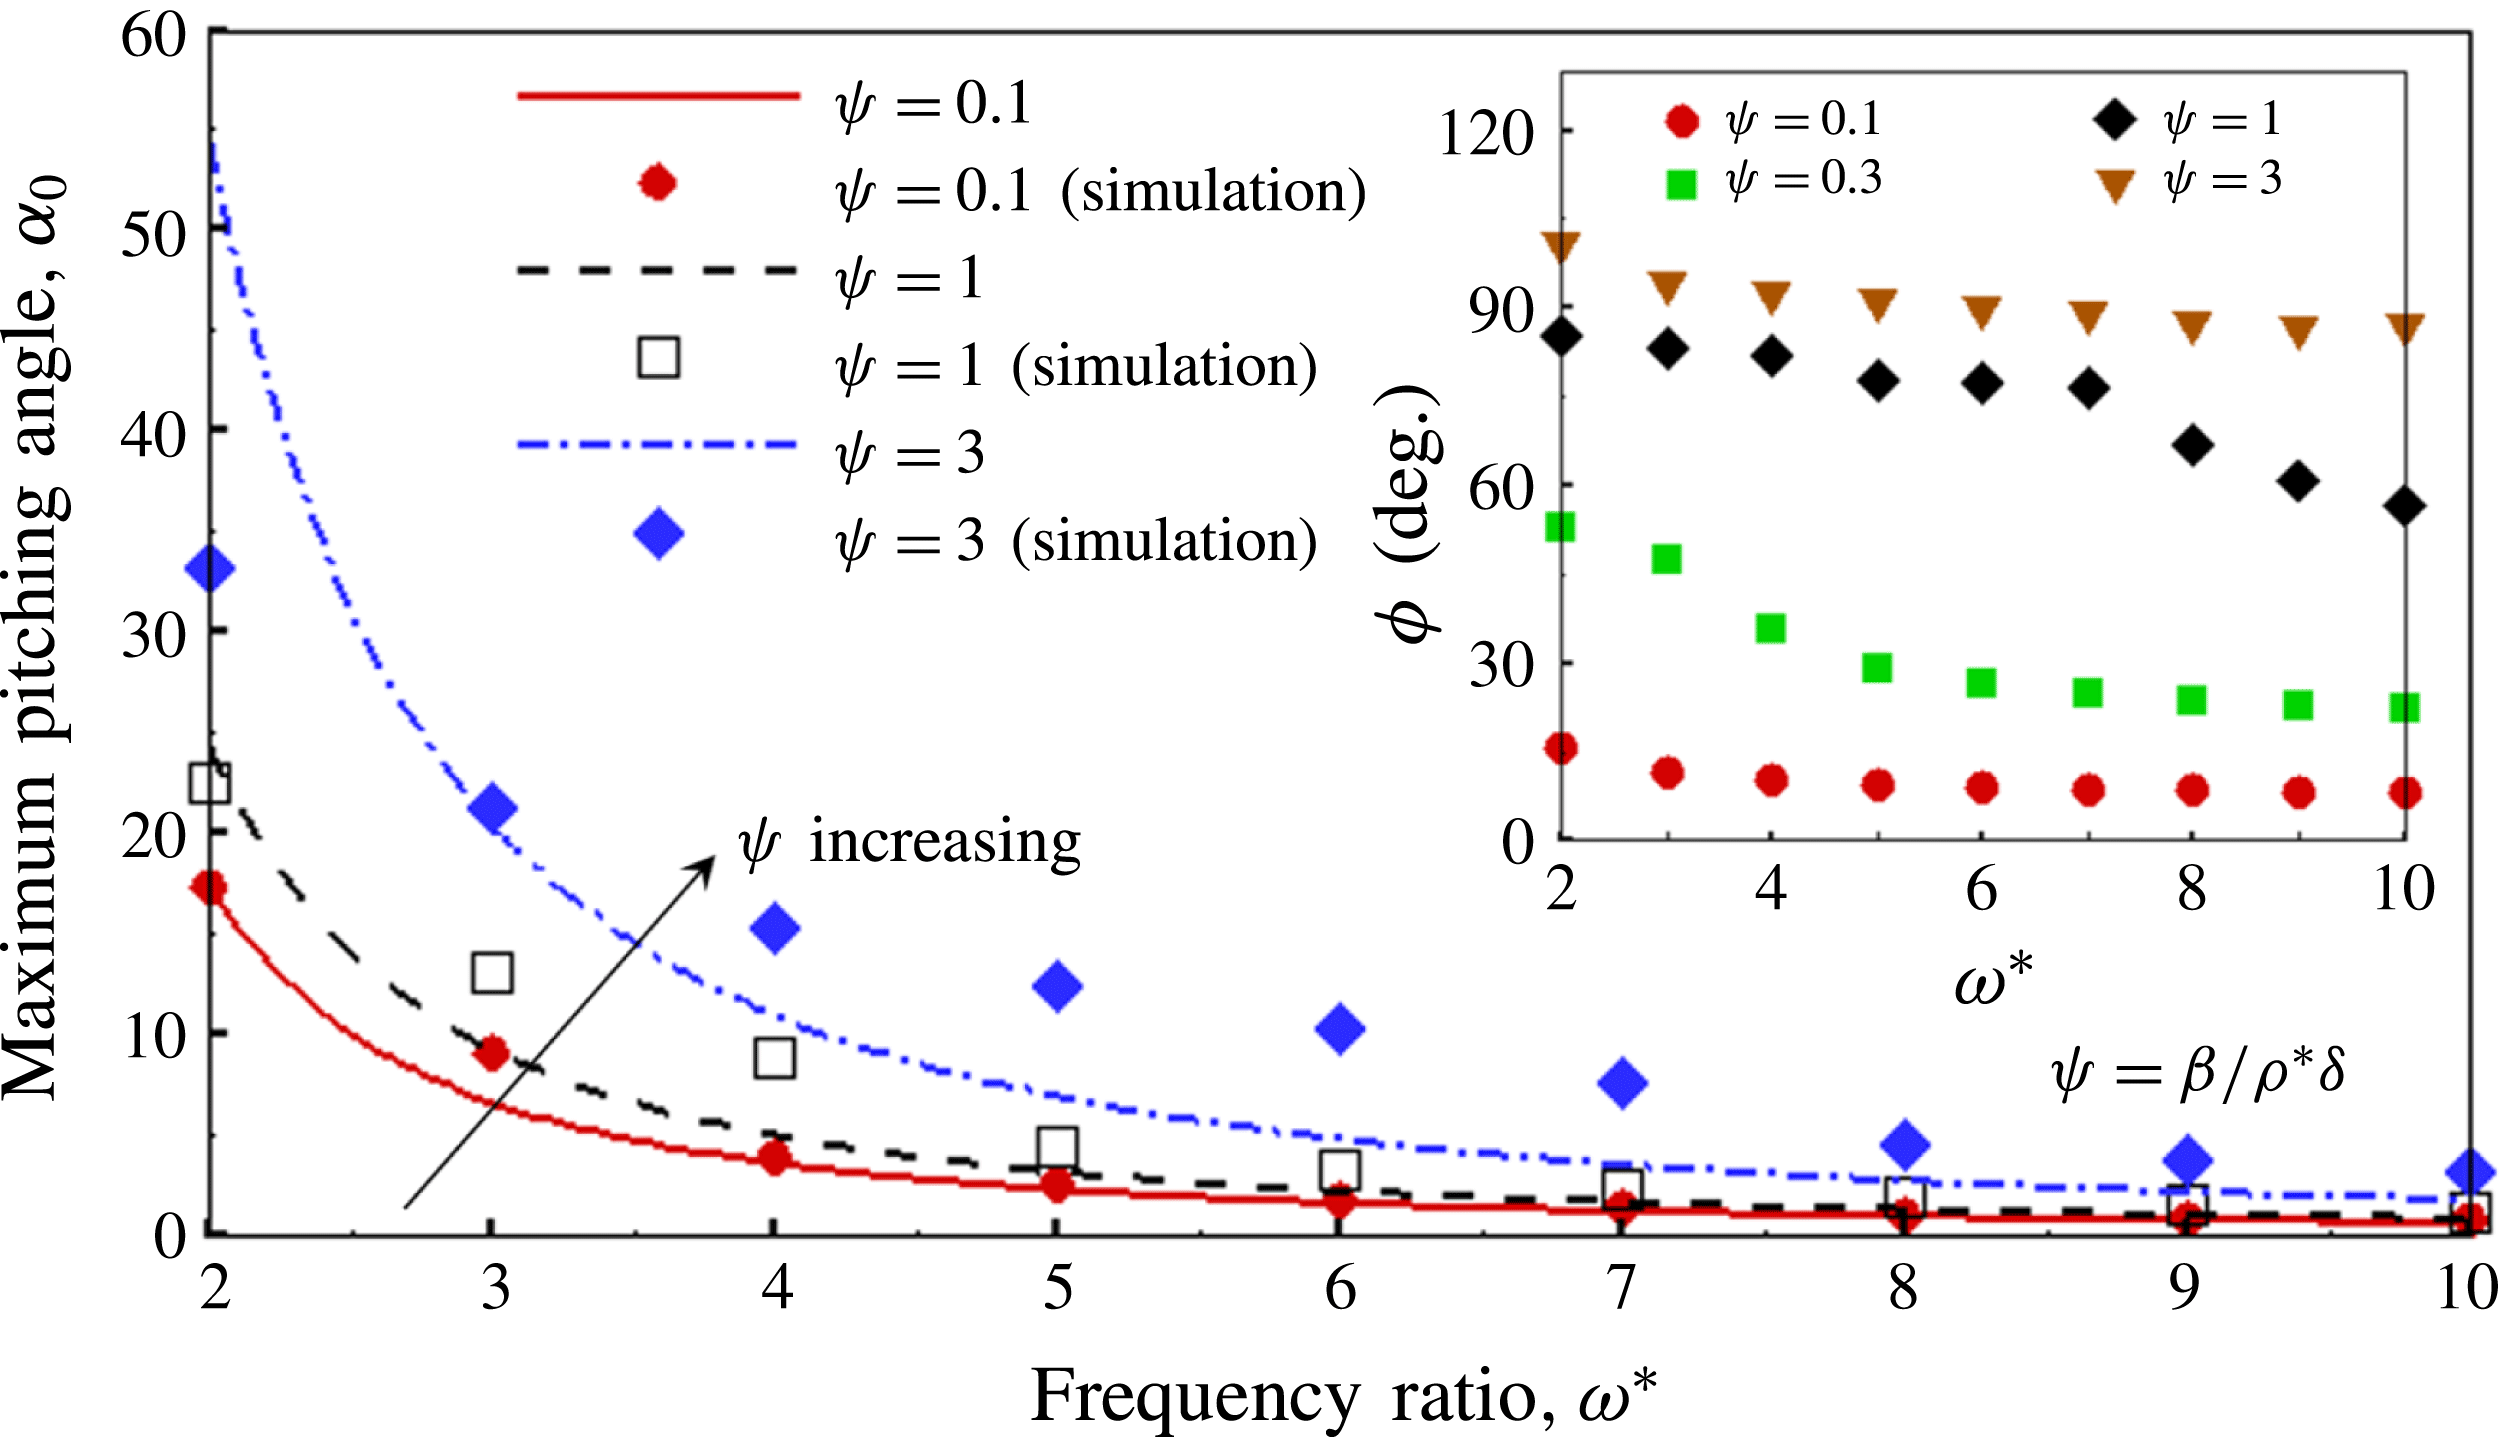
In order to corroborate the proposed phenomenological solution with the simulations, an assessment of the maximum pitching angle
 $\unicode[STIX]{x1D6FC}_{0}$
and phase difference
 $\unicode[STIX]{x1D719}$
as a function of
 $\unicode[STIX]{x1D714}^{\ast }$
was performed and is shown in figure 9. An excellent agreement between numerical and phenomenological solutions for
 $\unicode[STIX]{x1D6FC}_{0}$
is observed at
 $\unicode[STIX]{x1D713}=0.1$
. However, some deviation is witnessed at
 $\unicode[STIX]{x1D713}=1$
and
 $\unicode[STIX]{x1D713}=3$
, especially at intermediate values of the frequency ratio (i.e.
 $\unicode[STIX]{x1D714}^{\ast }\approx 3{-}4$
and
 $\unicode[STIX]{x1D714}^{\ast }\approx 4{-}6$
in the former and latter, respectively). Similar findings with the variation of
 $\unicode[STIX]{x1D6FC}_{0}$
were also reported by Hua et al. (Reference Hua, Zhu and Lu2013) where a larger passive pitching angle was attained at smaller bending modulus (i.e. higher flexibility or lower
 $\unicode[STIX]{x1D714}^{\ast }$
) and higher plunging amplitude (or higher
 $\unicode[STIX]{x1D713}$
). As far as
 $\unicode[STIX]{x1D719}$
is concerned, the appearance of a phase difference between the flapping and passive pitching was also supported by the experiments performed on a self-propelled insect model by Ramananarivo et al. (Reference Ramananarivo, Godoy-Diana and Thiria2011). Their results clearly indicate that
 $\unicode[STIX]{x1D719}$
is dictated by the aerodynamics to solid inertia ratio as variation occurs when the medium of flapping changes from a vacuum to air. Furthermore, and unlike the phenomenological solution derived in this work, their study revealed that the phase difference is also dependent on the frequency ratio that is also captured in our simulation results. However, this point of departure of our phenomenological solution could be attributed to two reasons: (i) inapplicability of the model for large pitching angles, and (ii) approximation on the aerodynamics moment which simplifies the definition of
 $\unicode[STIX]{x1D713}=(\unicode[STIX]{x1D6FD}\langle F_{y}^{\ast }\rangle x)/(\unicode[STIX]{x1D70C}^{\ast }\unicode[STIX]{x1D6FF})$
to
 $\unicode[STIX]{x1D713}=\unicode[STIX]{x1D6FD}/(\unicode[STIX]{x1D70C}^{\ast }\unicode[STIX]{x1D6FF})$
. In the latter form, the dependence on
 $\unicode[STIX]{x1D714}^{\ast }$
is not captured and is discussed in appendix A. Nevertheless, our numerical simulations do reveal the dependence of the phase difference on
 $\unicode[STIX]{x1D714}^{\ast }$
, as evident from the inset of figure 9.
The role of the amplitude ratio
 $\unicode[STIX]{x1D6FD}$
in the phase lag as described in this work is different from Moore (Reference Moore2014) and Medina & Kang (Reference Medina and Kang2018), where the phase lag was shown to be independent of the plunge amplitude. In Moore (Reference Moore2014) and Medina & Kang (Reference Medina and Kang2018), a uniform constant free stream was imposed on an oscillating wing. The independence of the phase lag from the plunge amplitude was also found in Kang et al. (Reference Kang, Cranford, Sridhar, Kodali, Landrum and Slegers2017), where a small-amplitude linearized aerodynamics model was used to model the coupled wing and body dynamics. In this work, on the other hand, the periodically varying horizontal propulsion velocity of the wing is computed as a result of the fluid–structure interaction. As described above, we have used
 $p_{dynamic}\sim \bar{u}^{2}\sim A^{2}\unicode[STIX]{x1D6FE}^{2}$
as the aerodynamic loading. Because of the dependence of the propulsive velocity
 $\bar{u}$
on the plunge amplitude
 $A$
, the resulting phase lag and, hence, the FSI index, also depend on
 $\unicode[STIX]{x1D6FD}$
.
4.2 Numerical simulations
4.2.1 Cruising velocity in forward flight
We now discuss the role of plunging parameters, i.e.
 $Re_{f}$
and
 $\unicode[STIX]{x1D713}$
on the cruising velocity of a flexible plate during forward flight for different values of the normalized frequency.
The non-dimensional frequency can be defined by normalizing the motion frequency with respect to either the characteristic structural resonance in a vacuum (
 $\unicode[STIX]{x1D714}_{n}$
) or in the presence of a fluid (FSI resonance frequency,
 $\unicode[STIX]{x1D714}_{n,fluid}$
). The resonance frequency in the fluid is supposed to be lower than that in a vacuum which is also indirectly corroborated by our results in figure 7 above. Further,
 $\unicode[STIX]{x1D714}_{n,fluid}$
has been defined in different forms in the literature: (i) based on the phase lag of
 $\unicode[STIX]{x03C0}/2$
between plunging and tip deflection (Yeh & Alexeev Reference Yeh and Alexeev2014); (ii) based on the frequency corresponding to maximum deflection; (iii) based on an analysis for
 $\unicode[STIX]{x1D6FD}\ll 1$
(Sader Reference Sader1998); or (iv) based on peak
 $\bar{U}$
. Before choosing a normalization definition, a new parameter, called the relative tip displacement,
 $\unicode[STIX]{x1D6E5}_{rel}=(\unicode[STIX]{x1D6E5}_{t}-\unicode[STIX]{x1D6E5}_{r})/A$
, is defined. The relative tip displacement is more meaningful than the absolute tip displacement as the latter can lead to erroneous interpretation of structural deformation when
 $\unicode[STIX]{x1D6FD}\simeq 1$
. However, the same is not a significant issue when
 $\unicode[STIX]{x1D6FD}\ll 1$
.
(a) Relative tip displacement (
 $\unicode[STIX]{x1D6E5}_{rel}$
) versus frequency ratio (
 $\unicode[STIX]{x1D714}_{fluid}^{\ast }$
) and (b) cruising velocity (
 $\bar{U}$
) versus relative tip displacement at different FSI indices (
 $\unicode[STIX]{x1D713}$
).
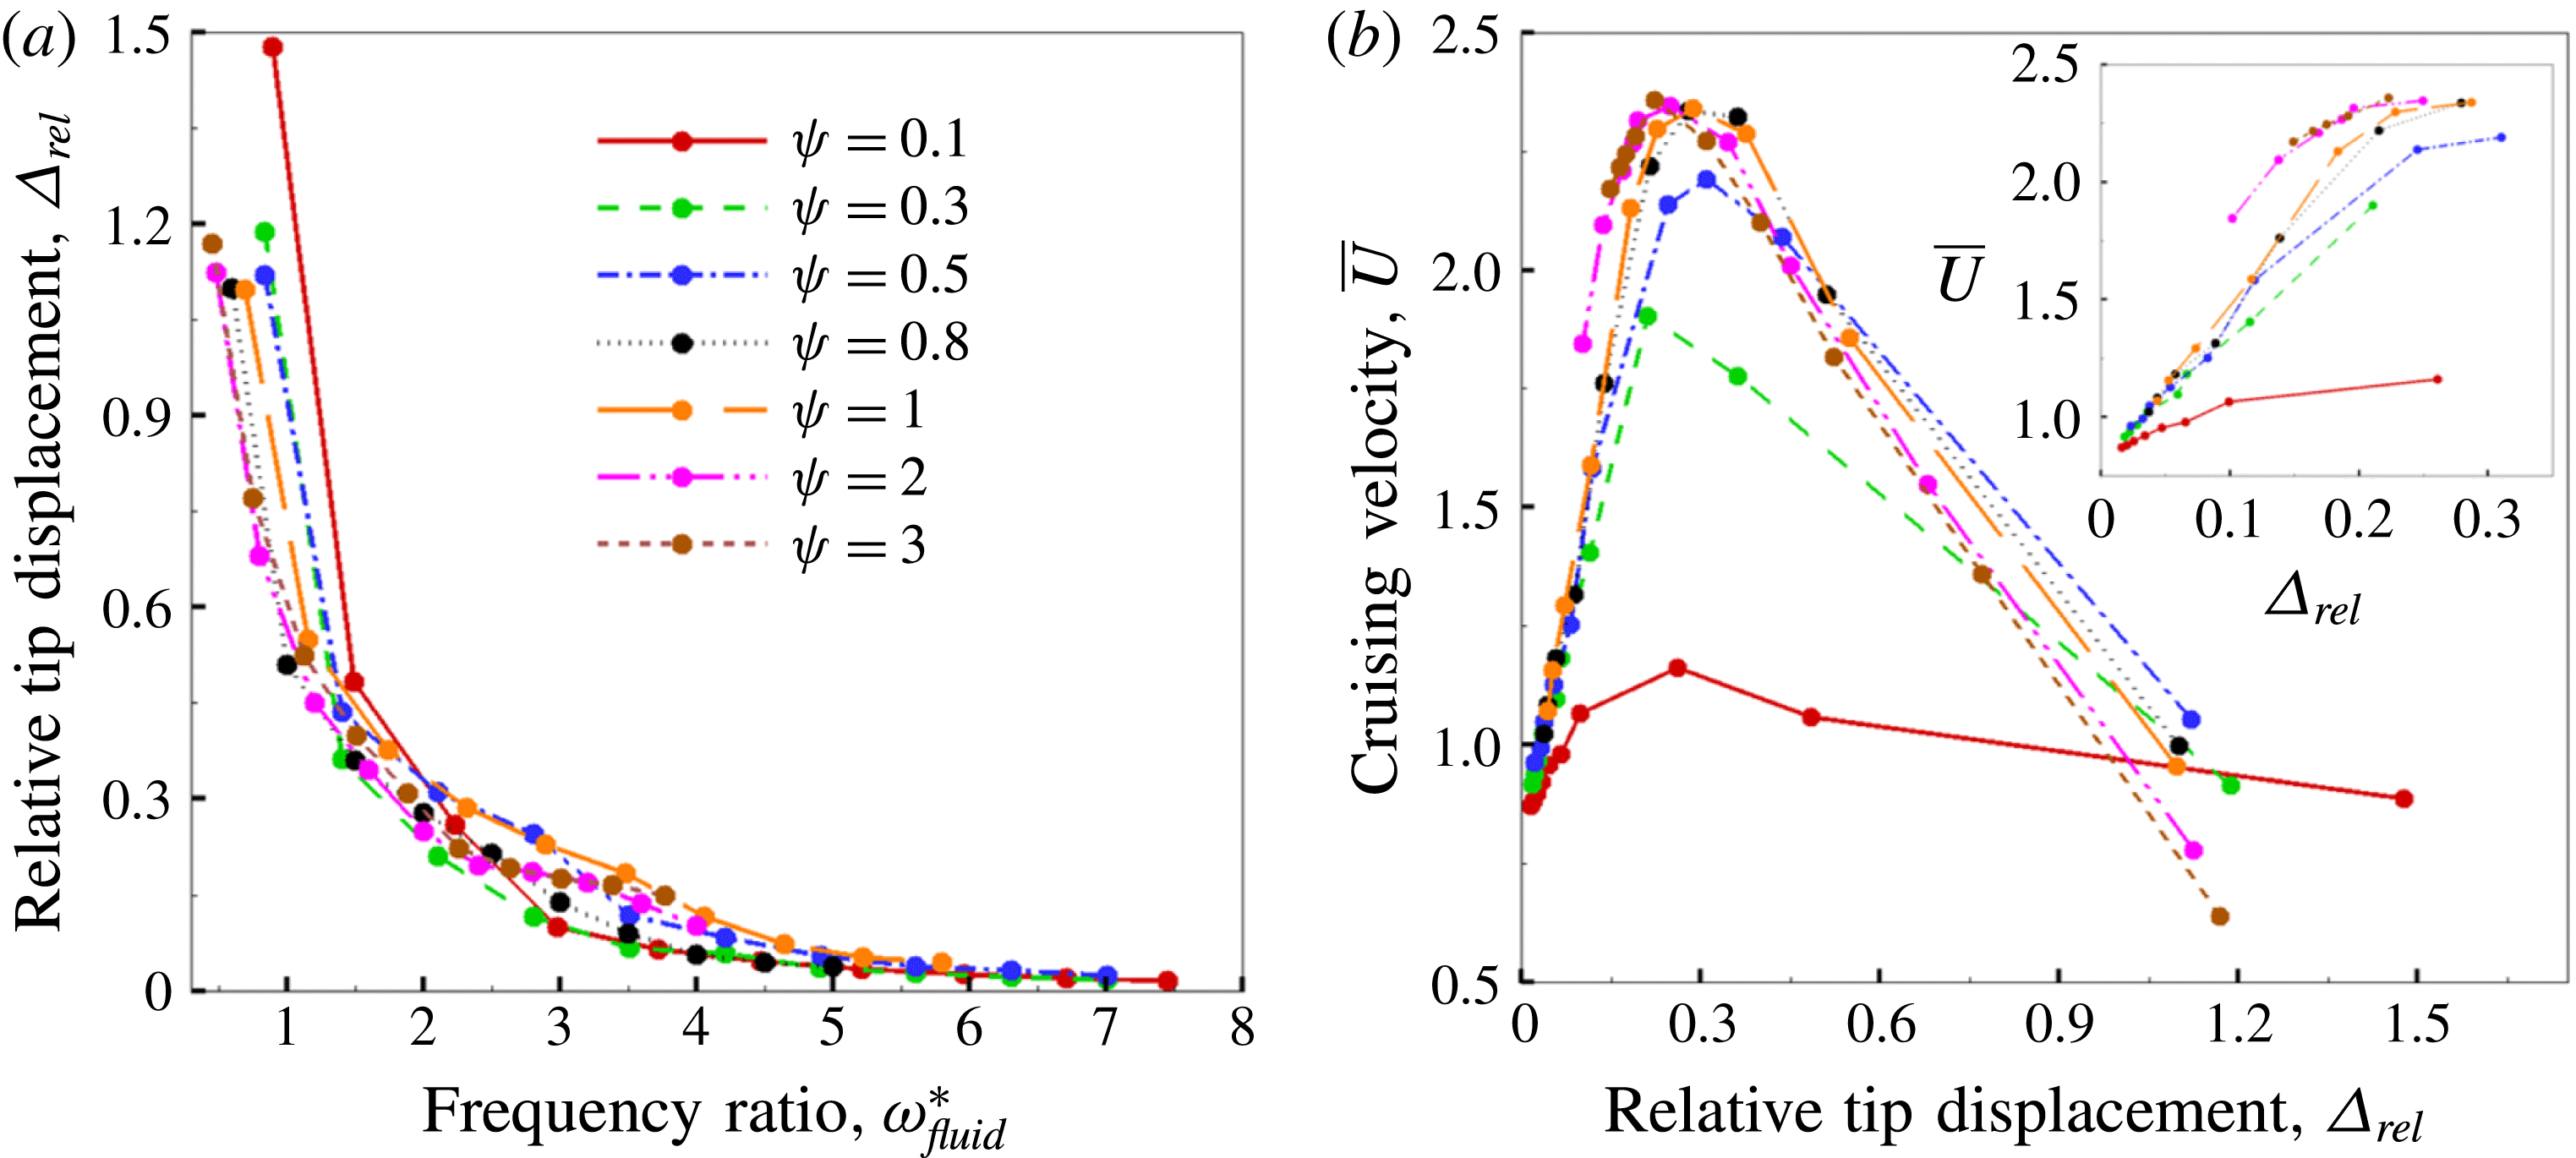
The relative displacement obtained through simulations as a function of
 $\unicode[STIX]{x1D714}_{fluid}^{\ast }$
for various values of the FSI index
 $\unicode[STIX]{x1D713}=\unicode[STIX]{x1D6FD}/(\unicode[STIX]{x1D70C}^{\ast }\unicode[STIX]{x1D6FF})$
is shown in figure 10(a). These calculations were done for
 $\unicode[STIX]{x1D6FD}=0.6$
. Clearly, the relative tip displacement keeps increasing as
 $\unicode[STIX]{x1D714}_{fluid}^{\ast }$
decreases. This is reasonable as the system appears to be reaching a state of uncontrollable excitation with a decrease in normalized frequency.
Figure 10(b) shows the maximum velocity versus relative tip displacement for different values of
 $\unicode[STIX]{x1D713}$
. This figure shows that the relative tip displacement increases till the maximum velocity is reached for a given
 $\unicode[STIX]{x1D713}$
, but decreases after any further increase in tip displacement. The analysis by Yeh & Alexeev (Reference Yeh and Alexeev2014) showed that the cruising velocity is directly proportional to the trailing-edge displacement by varying two parameters, namely ‘added mass’
 $T=\unicode[STIX]{x1D70C}_{f}L/\unicode[STIX]{x1D70C}_{s}b$
(
 $0.5\leqslant T\leqslant 7.5$
) and
 $\unicode[STIX]{x1D6F7}=\unicode[STIX]{x1D714}/\unicode[STIX]{x1D714}_{n,fluid}$
(
 $0.5\leqslant \unicode[STIX]{x1D6F7}\leqslant 2$
) for a plate plunging at a non-dimensional amplitude of
 $\unicode[STIX]{x1D6FD}=0.1$
. The simulation results presented herein correspond to
 $\unicode[STIX]{x1D6FD}=0.6$
and
 $0.17\leqslant T\leqslant 5$
(or
 $0.2\leqslant \unicode[STIX]{x1D70C}^{\ast }\unicode[STIX]{x1D6FF}\leqslant 6$
). An important thing to note is that our range of the added mass parameter falls into a regime that was previously unexplored, which is
 $0.17\leqslant T\leqslant 0.5$
(or
 $2\leqslant \unicode[STIX]{x1D70C}^{\ast }\unicode[STIX]{x1D6FF}\leqslant 6$
). This is a range which is dominated by inertia and hence is expected to have little influence from aerodynamics. Quite spectacularly, the maximum velocity seems to occur for the condition
 $\unicode[STIX]{x1D6E5}_{rel}\approx 0.3$
. Several snapshots showing plate bending patterns corresponding to
 $\unicode[STIX]{x1D713}=0.1$
obtained for different relative tip displacements are shown in figure 11.
Bending patterns at
 $\unicode[STIX]{x1D713}=0.1$
corresponding to relative tip deflections (a)
 $\unicode[STIX]{x1D6E5}_{rel}=0.07$
, (b)
 $\unicode[STIX]{x1D6E5}_{rel}=0.3$
, (c)
 $\unicode[STIX]{x1D6E5}_{rel}=0.5$
, (d)
 $\unicode[STIX]{x1D6E5}_{rel}=0.9$
and (e)
 $\unicode[STIX]{x1D6E5}_{rel}=1.5$
shown in figure 10. Black and red colours represent upstroke and downstroke, respectively.
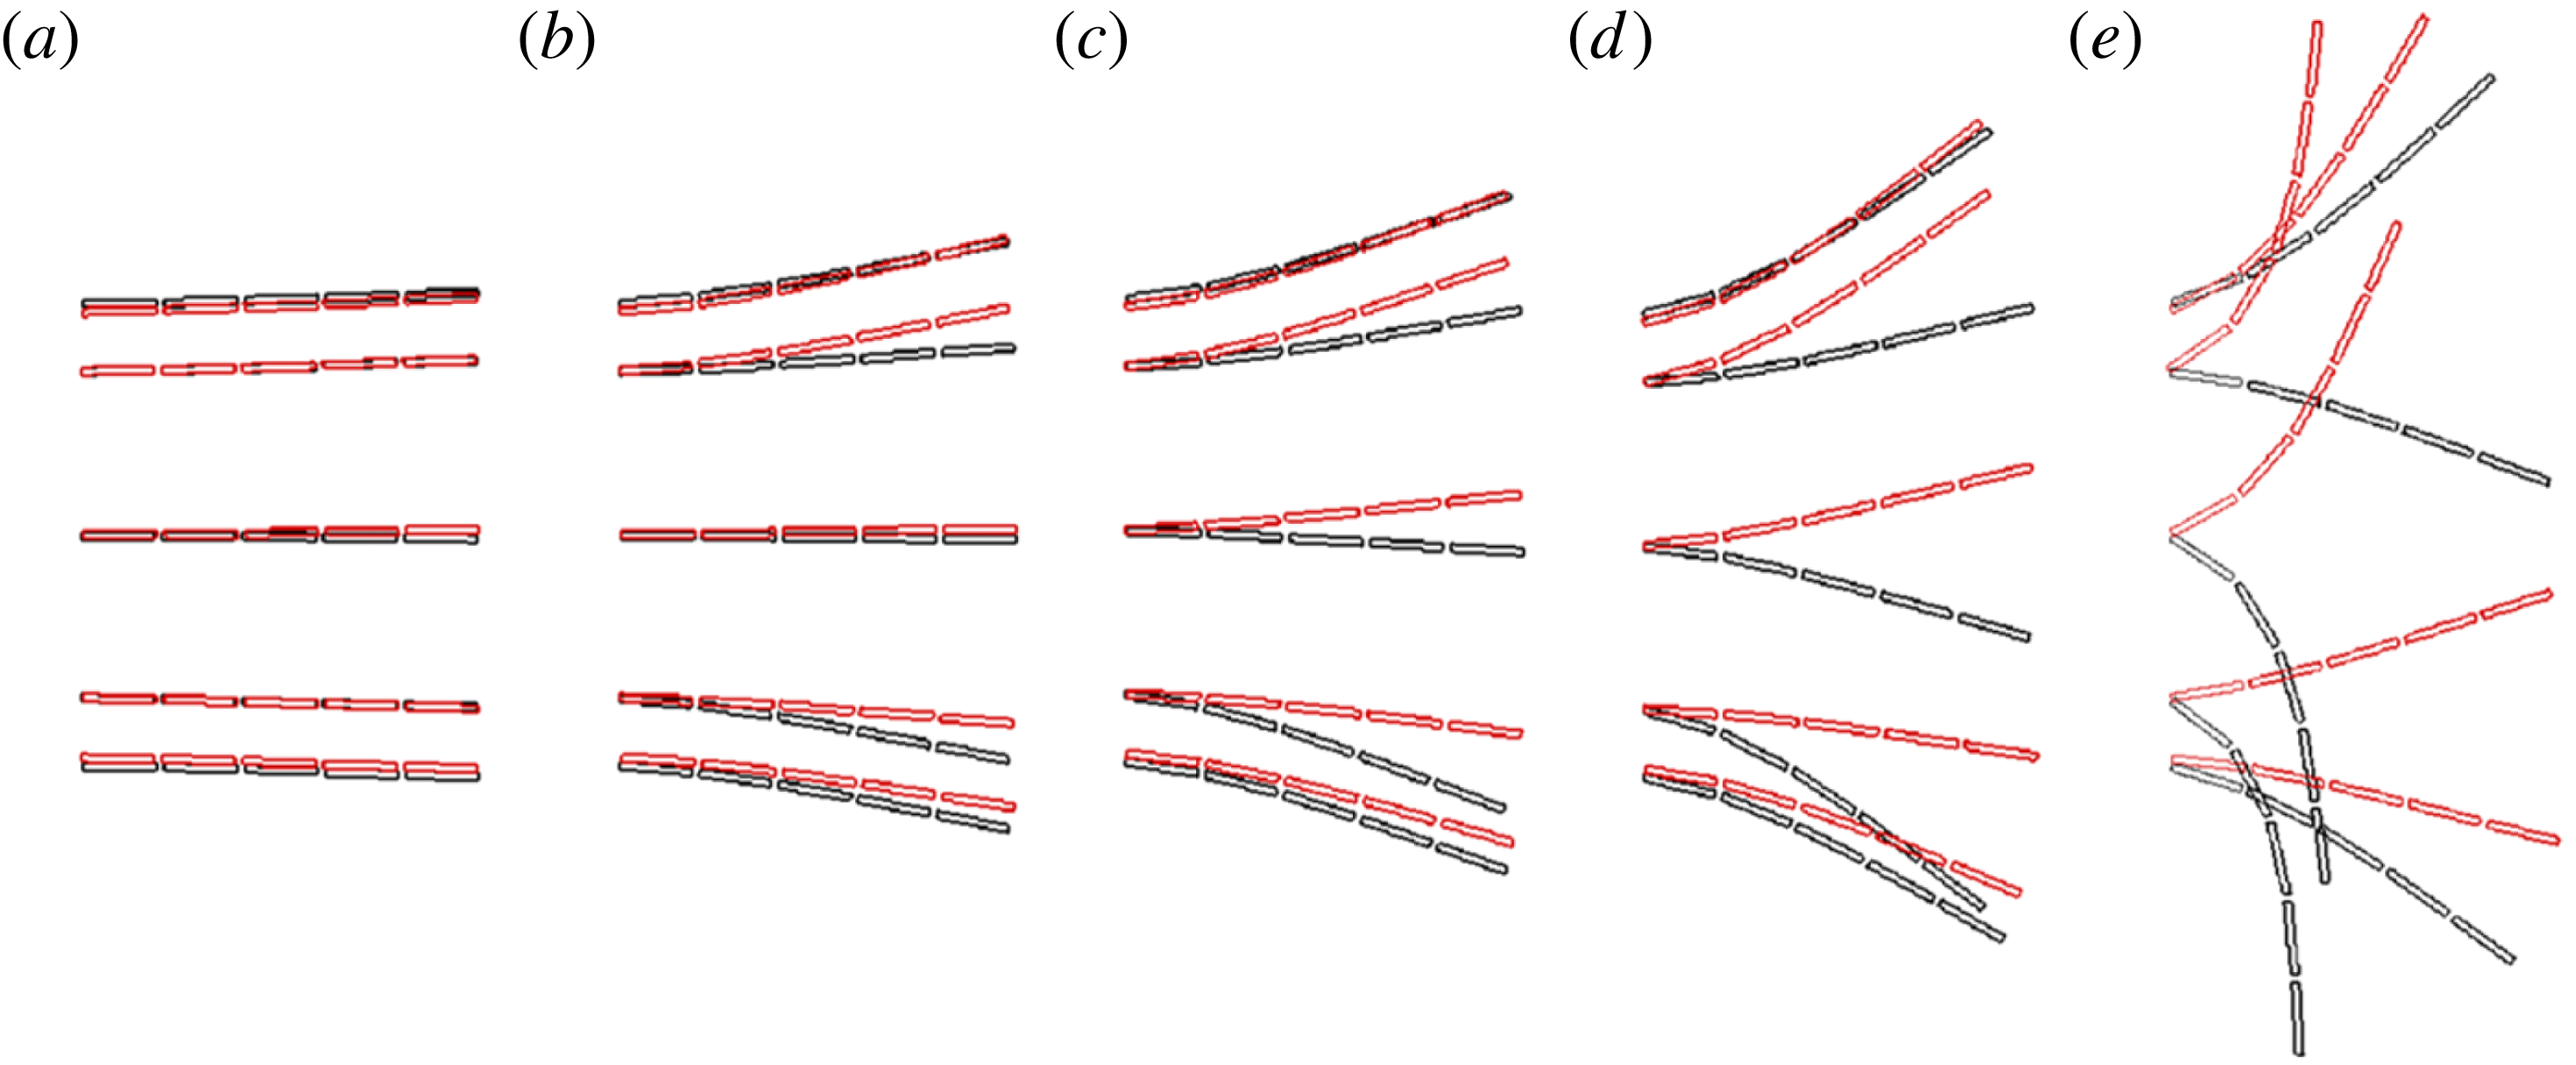
The phase difference between driving motion and the relative tip deflection for
 $\unicode[STIX]{x1D6E5}_{rel}\approx 0.3$
is further examined. Figure 12 shows the phase difference
 $\unicode[STIX]{x1D719}$
obtained from our simulations at the condition of maximum velocity by varying
 $\unicode[STIX]{x1D70C}^{\ast }\unicode[STIX]{x1D6FF}$
with
 $\unicode[STIX]{x1D6FD}=0.6$
. A significant deviation from a phase difference of
 $\unicode[STIX]{x03C0}/2$
occurs when the plunging inertia
 $\unicode[STIX]{x1D70C}^{\ast }\unicode[STIX]{x1D6FF}\geqslant 2$
, which represents inertia dominated scenarios. With reference to figure 10, it can be inferred that the resonance condition at large amplitudes is not characterized by the condition at which the driving sinusoidal motion and the resulting deflection exhibit a phase difference of
 $\unicode[STIX]{x03C0}/2$
. As figure 10(b) shows, the maximum velocity starts to decrease at
 $\unicode[STIX]{x1D6E5}_{rel}>0.3$
. As the relative tip deflection keeps increasing with a decrease in
 $\unicode[STIX]{x1D714}_{fluid}^{\ast }$
, it is possible that the phase difference
 $\unicode[STIX]{x1D719}$
approaches
 $\unicode[STIX]{x03C0}/2$
for very low values of
 $\unicode[STIX]{x1D714}_{fluid}^{\ast }$
. However, a shortcoming of our solver is that it no longer remains stable at such large tip displacements induced in the inertia dominated zone because of the structure turning onto itself, leading to an anomaly in the representation of the solid. Hence lower values of frequency ratio are not presented.
Phase difference (
 $\unicode[STIX]{x1D719}$
) corresponding to peak cruising velocity versus
 $\unicode[STIX]{x1D70C}^{\ast }\unicode[STIX]{x1D6FF}$
at
 $\unicode[STIX]{x1D6FD}=0.6$
.
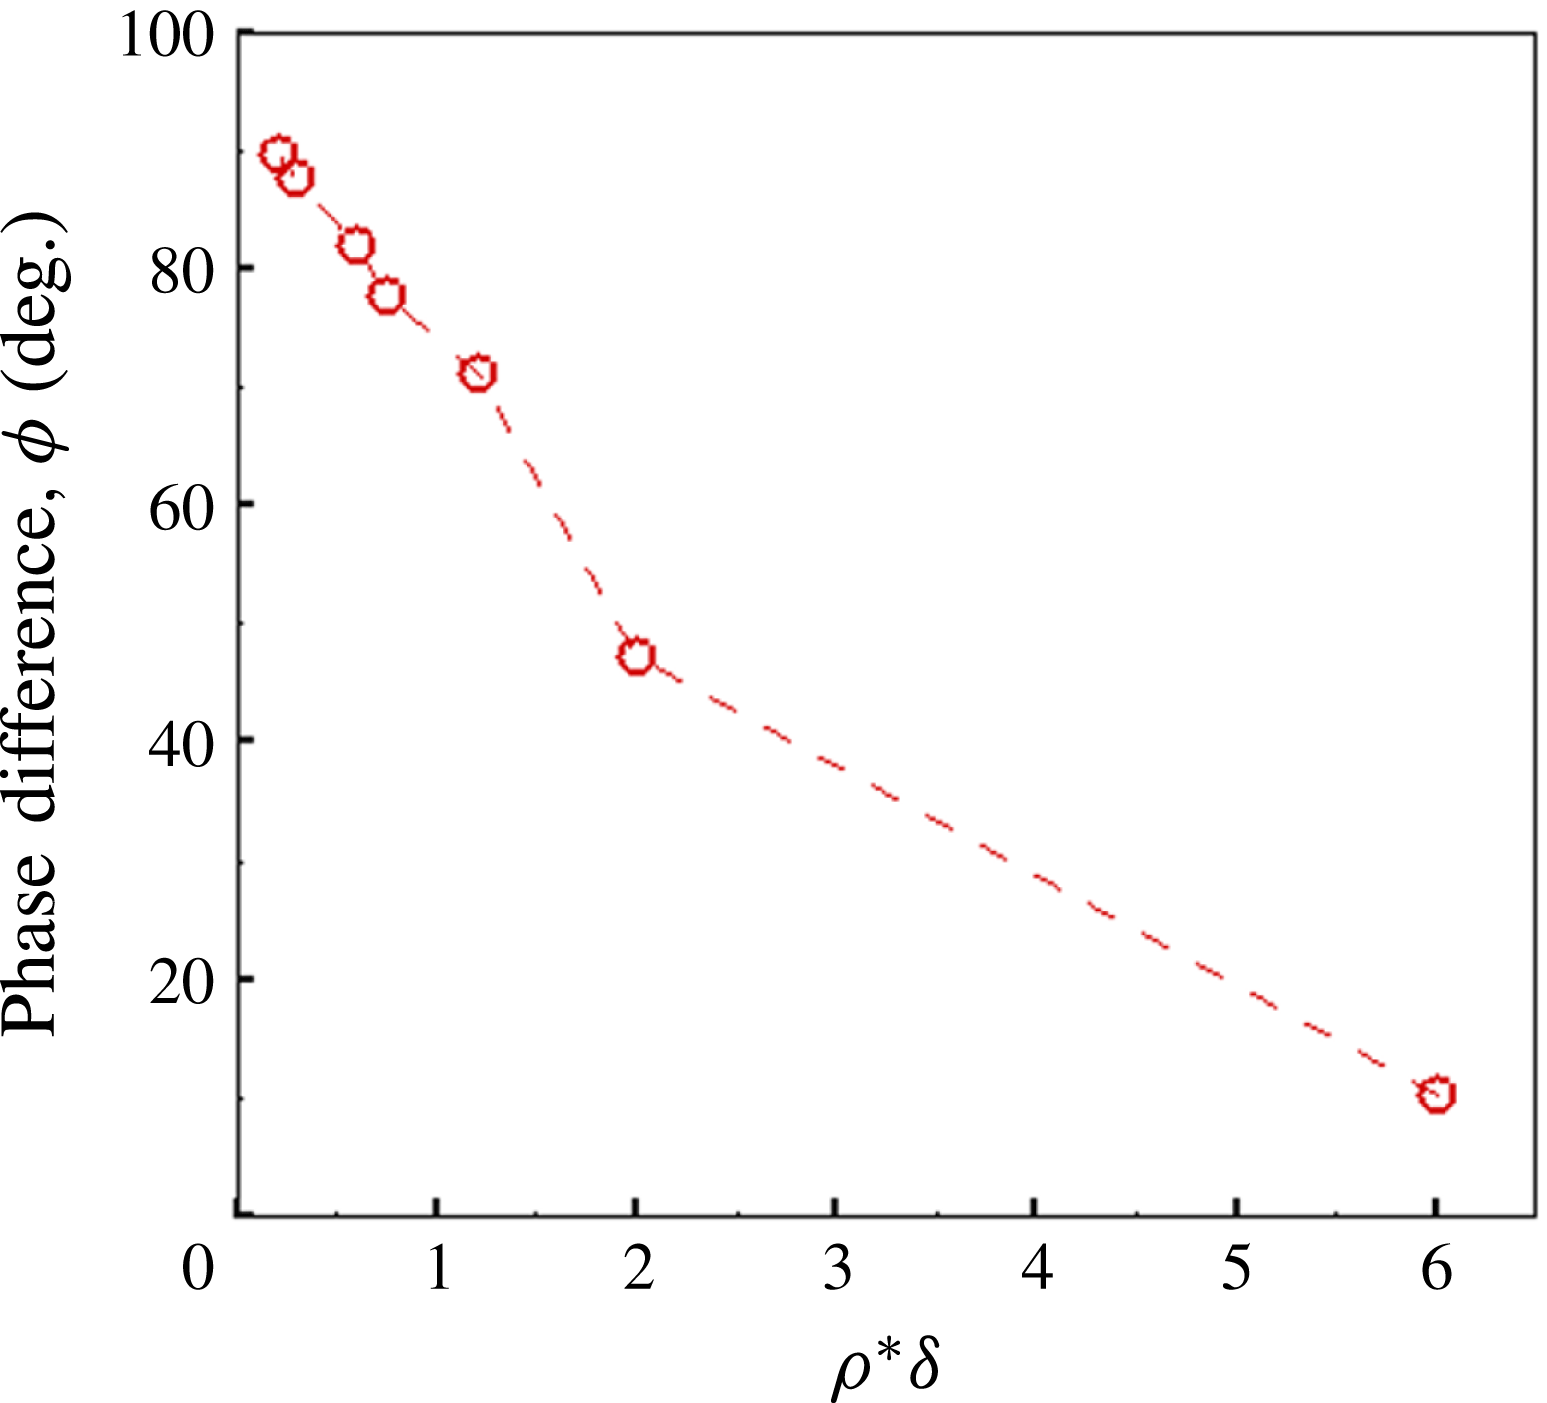
In summary, for the normalization of frequency the phase lag definition was not found to be appropriate in light of data obtained and shown in figure 12, the maximum defection in fluid definition was not considered due to the computational limitations of the solver for inertia dominated flows, and the analytical relationship given by Sader (Reference Sader1998) was not applicable since it is valid only for
 $\unicode[STIX]{x1D6FD}\ll 1$
motions. On the other hand, the frequency ratio based on the first natural frequency of the structure is uniquely defined and has been followed by many authors previously (Zhang et al.
Reference Zhang, Liu and Lu2010; Ramananarivo et al.
Reference Ramananarivo, Godoy-Diana and Thiria2011; Dai et al.
Reference Dai, Luo and Doyle2012; Hua et al.
Reference Hua, Zhu and Lu2013; Kang & Shyy Reference Kang and Shyy2013; Xiao et al.
Reference Xiao, Hu and Liu2014; Tang et al.
Reference Tang, Huang, Gao and Lu2016). Thus, we show results of frequency normalized using the structural resonance condition (i.e.
 $\unicode[STIX]{x1D714}^{\ast }=\unicode[STIX]{x1D714}_{n}/\unicode[STIX]{x1D714}$
) to provide the reader a clear way to reproduce our results.
Cruising velocity
 $\bar{U}$
as a function of
 $\unicode[STIX]{x1D714}^{\ast }$
at (a) different combinations of constant
 $Re_{f}$
and
 $\unicode[STIX]{x1D713}$
, (b) constant
 $\unicode[STIX]{x1D713}$
and different
 $Re_{f}$
and (c) constant
 $Re_{f}$
and different
 $\unicode[STIX]{x1D713}$
.
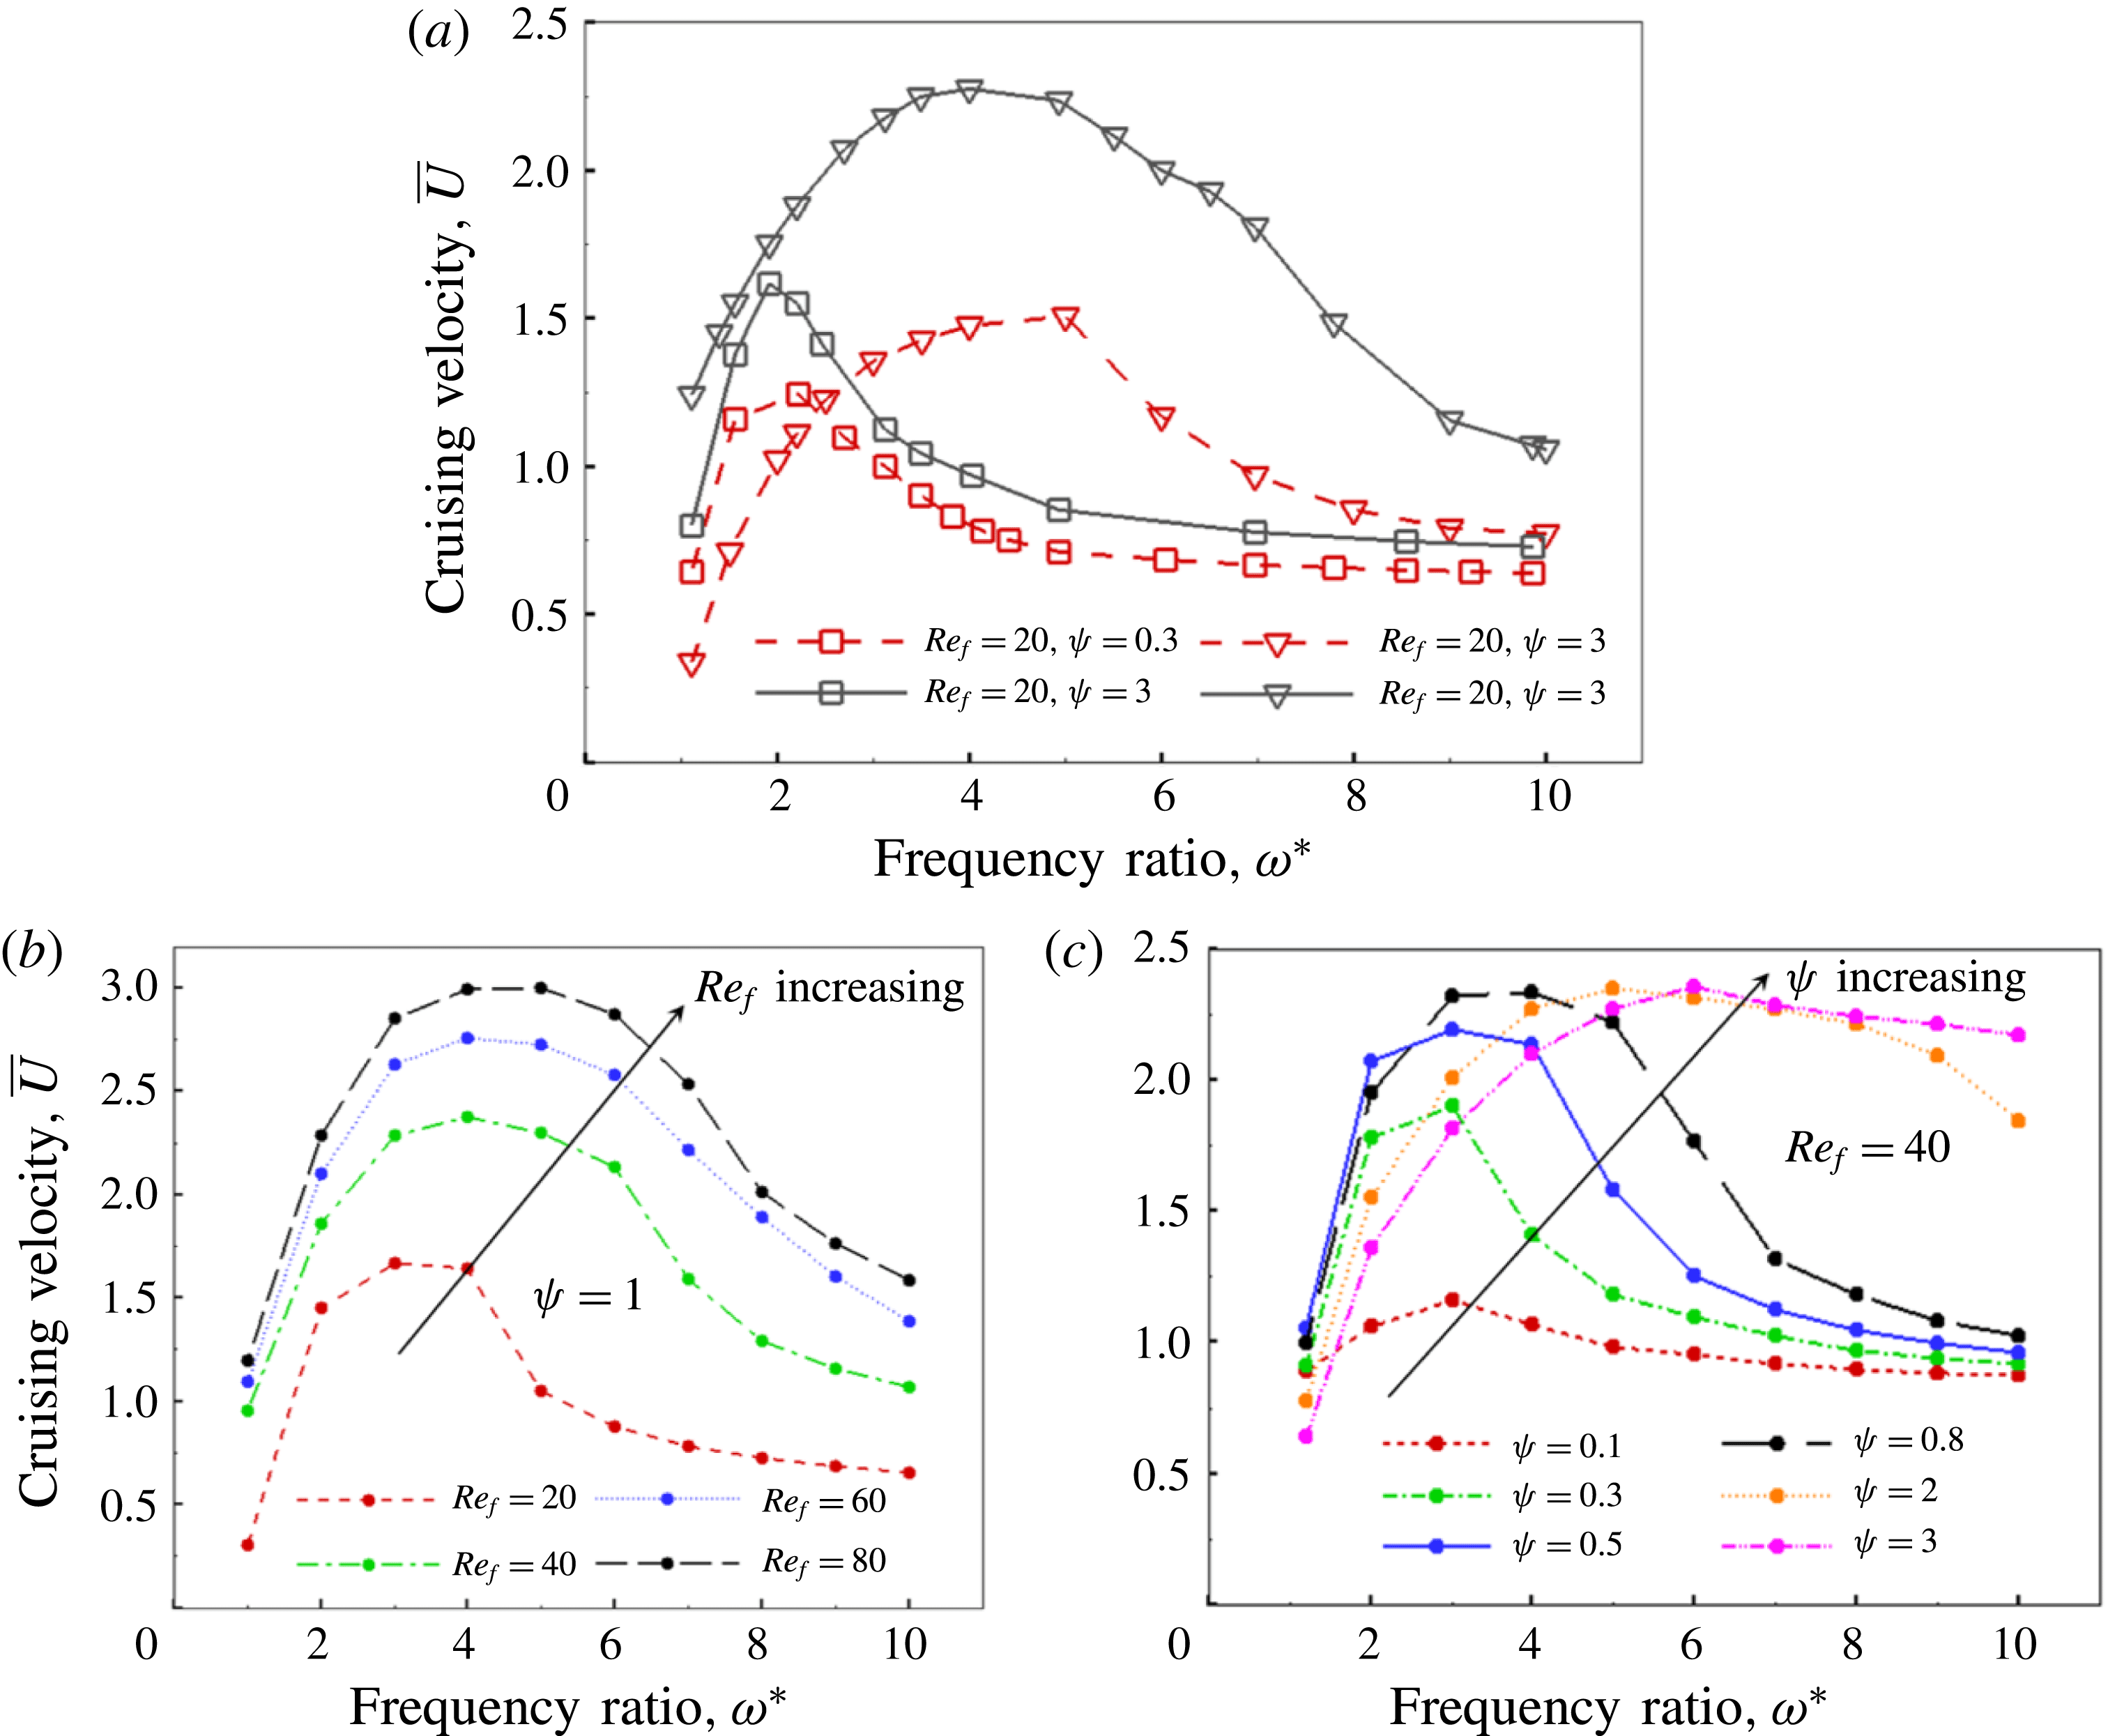
Figure 13(a) shows the variation in cruising velocity as a function of frequency ratio
 $\unicode[STIX]{x1D714}^{\ast }$
at different combinations of
 $Re_{f}$
(20 and 100) and FSI indices
 $\unicode[STIX]{x1D713}$
(0.1, 0.3 and 3). The selected values of FSI indices can be categorized as strong (weak), moderate (moderate) and weak (strong) for structural inertia (pressure) governed wing deformations. The dimensionless plunging amplitude
 $\unicode[STIX]{x1D6FD}$
and thickness ratio
 $\unicode[STIX]{x1D6FF}$
for all these simulations were kept constant at 0.6 and 0.02, respectively. The frequency ratio was varied between 1.1 and 10. The natural and post-natural frequencies (
 $\unicode[STIX]{x1D714}^{\ast }\leqslant 1$
) are not considered here and are dealt separately in the next section. Moreover, these frequencies are beyond the physical operating range of insects with the likelihood that energy calculations near resonance may convey incorrect propositions for comparison and quantification of propulsion performance in forward flight.
At a constant
 $Re_{f}$
and
 $\unicode[STIX]{x1D713}$
, the cruising velocity increases as
 $\unicode[STIX]{x1D714}^{\ast }$
decreases until the point of optimum flexibility is reached where
 $\bar{U}$
becomes maximum. However, the position of optimum differs depending on the parameters considered. As is noticeable, the location of the optimum keeps shifting towards unit frequency ratio (
 $\unicode[STIX]{x1D714}^{\ast }=1$
) with a decrease in
 $\unicode[STIX]{x1D713}$
(for
 $\unicode[STIX]{x1D713}=3$
, 0.3 and 0.1, the optimum is obtained at
 $\unicode[STIX]{x1D714}^{\ast }=5$
, 2.2 and 1.9 respectively at
 $Re_{f}=20$
). As stated earlier, the wing bending or deformation is predominantly structural inertia dominated at low FSI values which begins to shift towards aerodynamics subjugated with an increase in the FSI index. Both structural inertia and aerodynamics moments are directly proportional to
 $\unicode[STIX]{x1D714}^{2}$
and their magnitude increase with increase in plunging frequency. However, for structural inertia dominated flows, the flapping frequency has to be high or (in other words) closer to unit frequency ratio in order to produce substantial wing deformation for thrust generation. Whereas, for aerodynamics subjugated bending (
 $\unicode[STIX]{x1D713}>1$
), phenomenological results indicated that the structural deformation of the plate is much higher than for the solid inertia dominated case for a given frequency (with reference to figure 24). Therefore, high FSI flapping is actuated at a lower frequency (or high
 $\unicode[STIX]{x1D714}^{\ast }$
) as the lesser magnitude of the aerodynamics moment is sufficient to generate the desirable wing bending or requisite streamline shape that leads to maximum cruising velocity. Accordingly, the peaks in
 $\bar{U}$
are registered at high
 $\unicode[STIX]{x1D714}^{\ast }$
for aerodynamics dominated flows and keep shifting away from unit frequency ratio with further increase in
 $\unicode[STIX]{x1D713}$
. It should be noted that the peak velocity was found to occur for pre-resonance conditions (i.e.
 $\bar{\unicode[STIX]{x1D714}}_{f}=\unicode[STIX]{x1D714}/\unicode[STIX]{x1D714}_{n}\approx 0.6{-}0.7$
) in the experiments of Ramananarivo et al. (Reference Ramananarivo, Godoy-Diana and Thiria2011) as well. Our simulations indicate that this phenomenon is primarily due to the high-amplitude motion considered in this work. Further, occurrence of maximum velocity at pre-resonance conditions is also in accordance with the analytical solution obtained by Moore (Reference Moore2015) where the peaks in power and thrust shifted away from unit frequency ratio as the mass density ratio decreased or aerodynamics dominated. The shifting of optimum away from unit frequency ratio with an increase in
 $\unicode[STIX]{x1D713}$
could be explained in connection with the theoretical analysis of the flapping wing model of Moore (Reference Moore2015). It was shown in their study that maximum thrust generation (or optimum) always occurs at the resonant frequency in a fluid (
 $\unicode[STIX]{x1D714}_{n,fluid}$
) for all density ratios. According to Moore (Reference Moore2015), the frequency ratio measured against the structural resonance and resonance in the fluid are related through a correction factor by
 $$\begin{eqnarray}\unicode[STIX]{x1D714}_{vacuum}^{\ast }=\unicode[STIX]{x1D714}_{fluid}^{\ast }\sqrt{1+I_{a}^{\ast }},\quad \text{where }I_{a}^{\ast }=\frac{27\unicode[STIX]{x03C0}\unicode[STIX]{x1D713}}{128\unicode[STIX]{x1D6FD}}.\end{eqnarray}$$
Parameter
 $I_{a}^{\ast }$
is the dimensionless added fluid moment of inertia which is directly proportional to the FSI index (for a fixed amplitude). Clearly, this expression also adds credence to our key inference that the phenomenon of optimum shifting with a change in density ratio (or
 $\unicode[STIX]{x1D713}$
) is justified if the structural resonance is used for describing the frequency ratio. To elaborate, according to this relationship, the peak cruising velocity should occur at
 $\unicode[STIX]{x1D714}_{vacuum}^{\ast }=2.1$
for
 $\unicode[STIX]{x1D713}=3$
, whereas the numerically simulated maximum is attained at
 $\unicode[STIX]{x1D714}_{vacuum}^{\ast }\approx 4$
. The disagreement in the exact value can be attributed to the following assumptions in the earlier model (Moore Reference Moore2015): (i) infinitesimal amplitude (
 $\unicode[STIX]{x1D6FD}\ll 1$
), (ii) inviscid fluid, (iii) added mass approximated for a rigid plate and (iv) non-propelled motion of wing. Nevertheless, the analytical model of Moore (Reference Moore2015) strongly substantiates our findings on FSI index as it is primarily the normalization of resonant frequency which differentiates the location of the optimum frequency ratio.
As shown in figure 14, the peaks in velocity coincided at
 $\unicode[STIX]{x1D714}_{fluid}^{\ast }\approx 2$
when the data for cruising velocity (
 $\bar{U}$
) were plotted as a function of
 $\unicode[STIX]{x1D714}_{fluid}^{\ast }$
for all
 $\unicode[STIX]{x1D713}$
. This behaviour of maximum velocity occurring at the same value of
 $\unicode[STIX]{x1D714}_{fluid}^{\ast }$
is in concurrence with Yeh & Alexeev (Reference Yeh and Alexeev2014). This occurred even though the wing bending pattern at
 $\unicode[STIX]{x1D6FD}=0.6$
and
 $\unicode[STIX]{x1D6FD}=0.1$
was similar for the maximum velocity state for aerodynamics dictated situations (i.e.
 $\unicode[STIX]{x1D70C}^{\ast }\unicode[STIX]{x1D6FF}<1$
).
Cruising velocity
 $\bar{U}$
as a function of
 $\unicode[STIX]{x1D714}_{fluid}^{\ast }$
at (a) different combinations of constant
 $Re_{f}$
and
 $\unicode[STIX]{x1D713}$
, (b) constant
 $\unicode[STIX]{x1D713}$
and different
 $Re_{f}$
and (c) constant
 $Re_{f}$
and different
 $\unicode[STIX]{x1D713}$
.
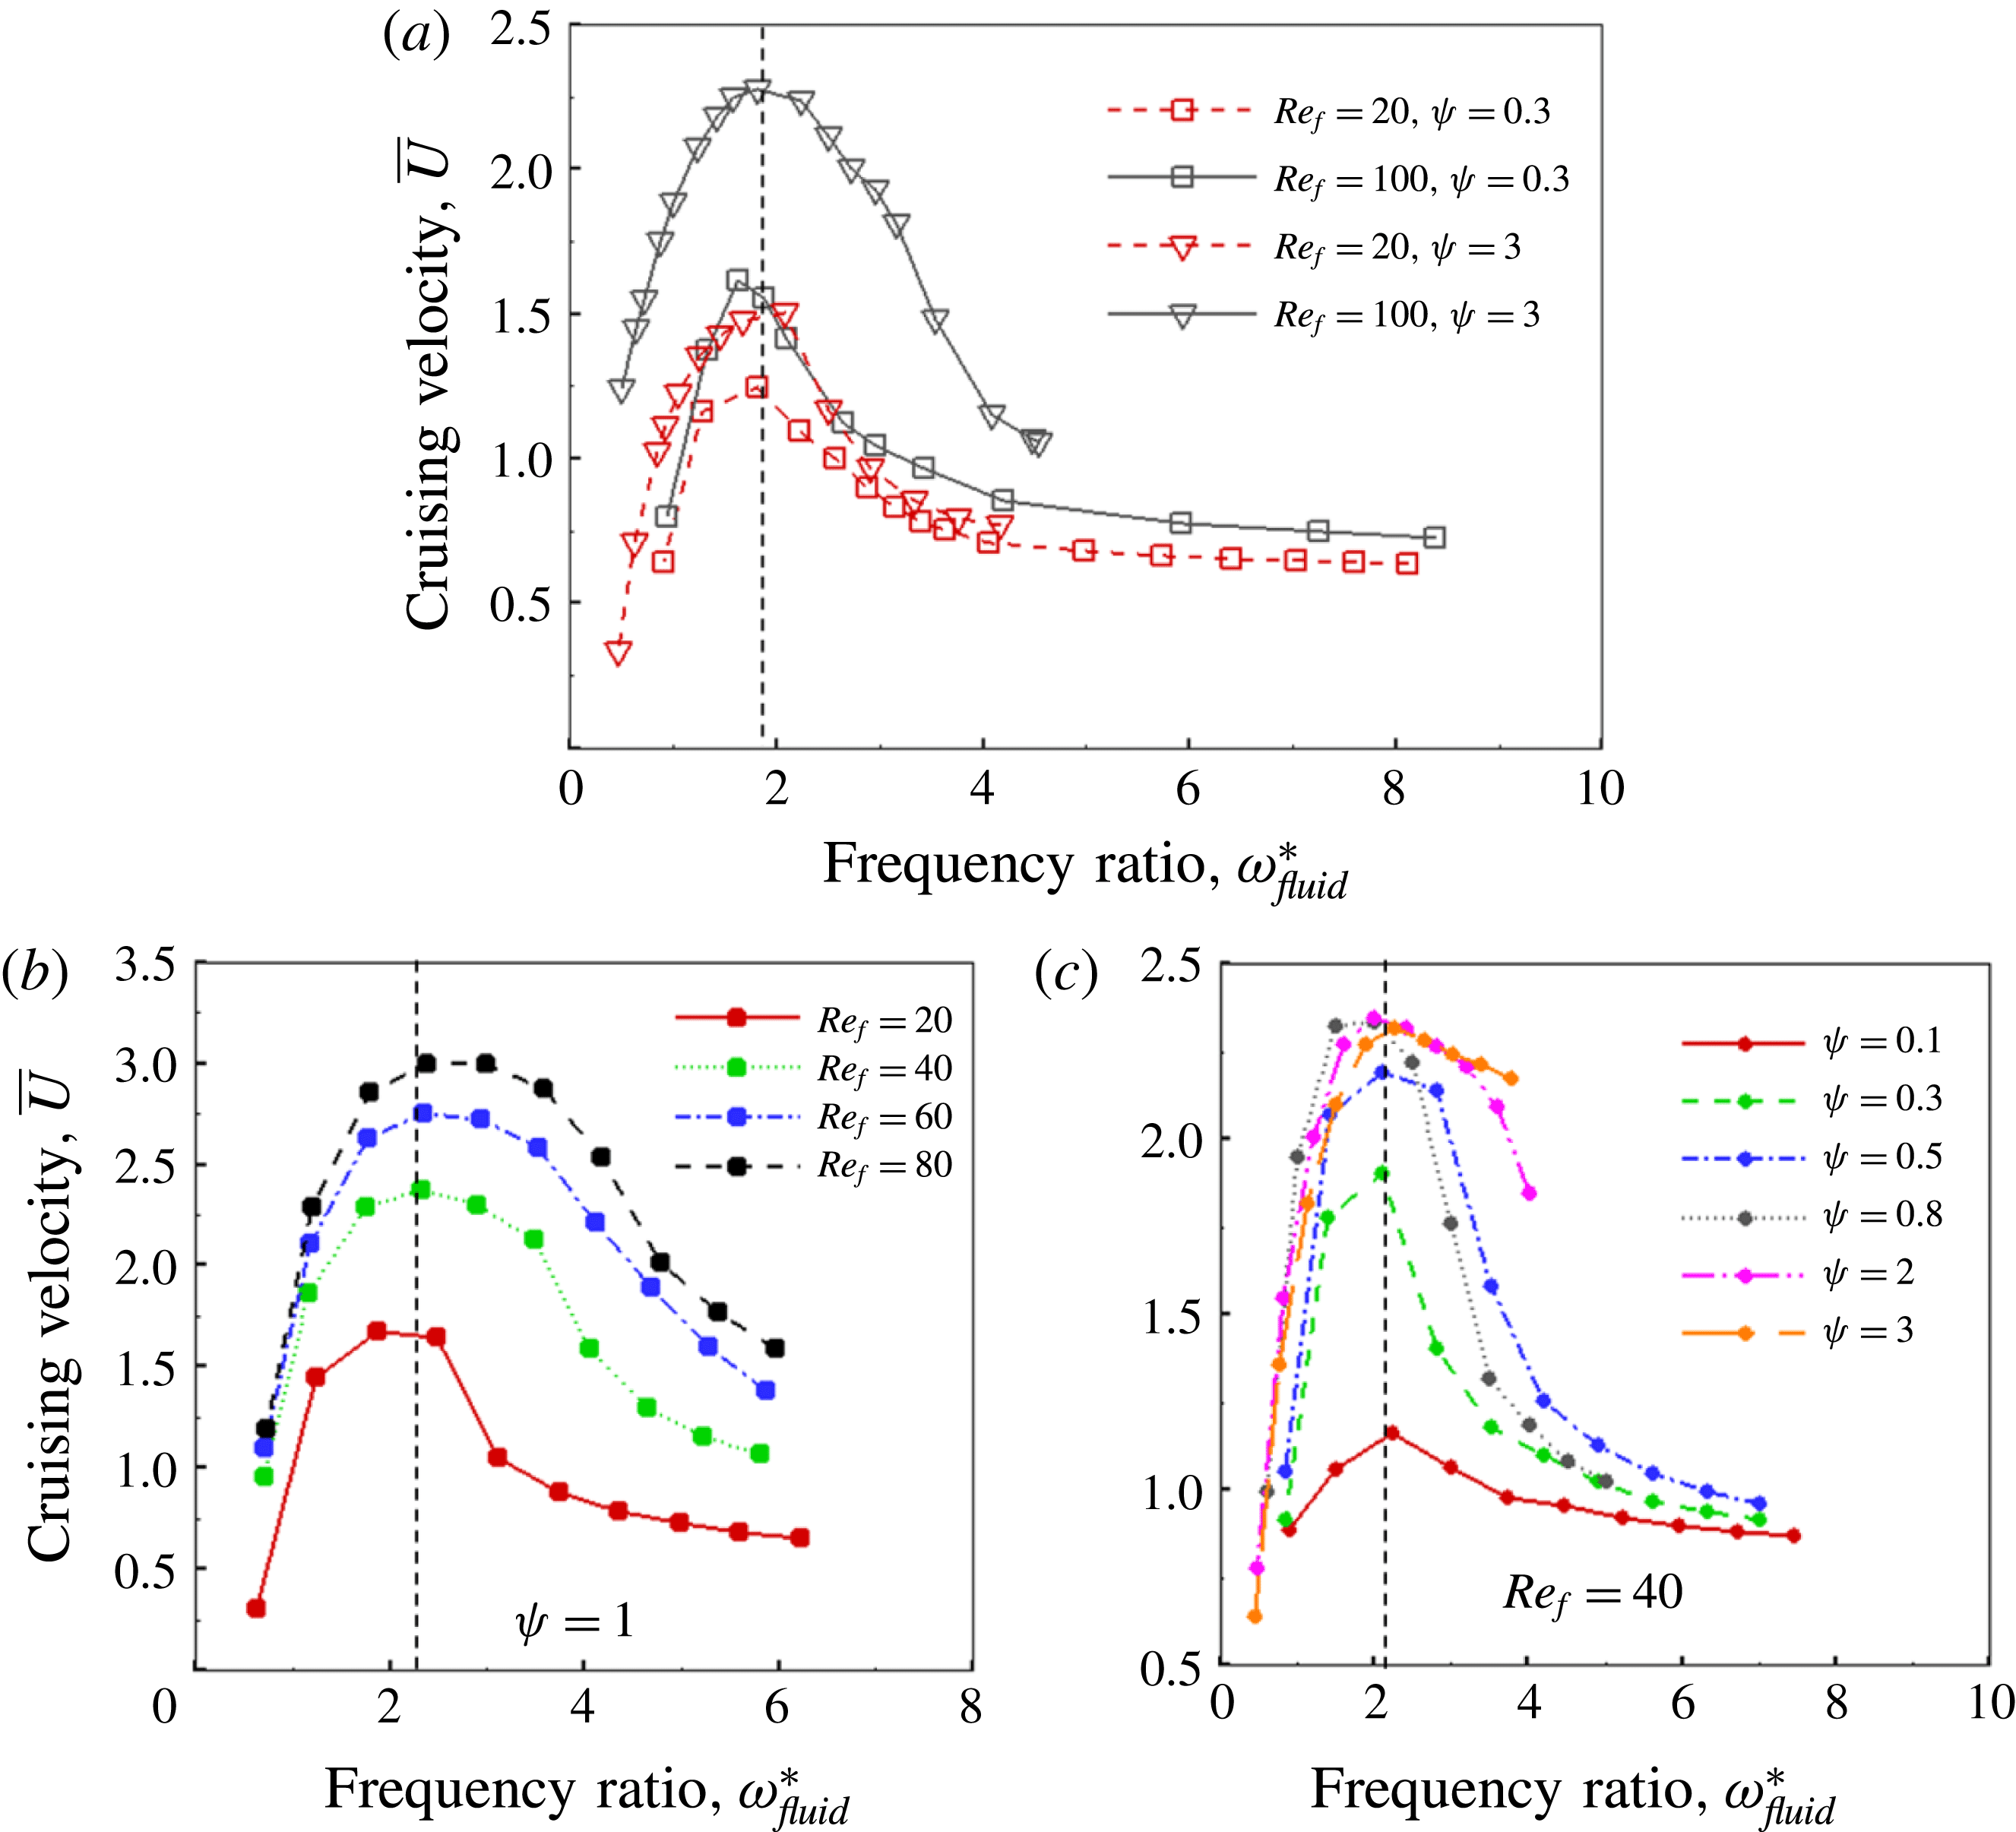
To further observe the behaviour of
 $\bar{U}$
individually with
 $Re_{f}$
and
 $\unicode[STIX]{x1D713}$
, additional simulations were performed and results are shown in figures 13(b) and 13(c), respectively. The trends of cruising velocity in figure 13(c) reiterate the earlier claim that the peak or maximum velocity is registered at higher
 $\unicode[STIX]{x1D714}^{\ast }$
with an increase in FSI index. It has been found that hawkmoth (Manduca sexta) and dragonfly (Orthetrum pruinosum and Orthetrum sabina) are two insect species whose passive pitching motions can be separately categorized into structural inertia dominated (
 $\unicode[STIX]{x1D713}\approx 0.3$
) and aerodynamics dominated (
 $\unicode[STIX]{x1D713}\approx 2$
), respectively (Chen et al.
Reference Chen, Chen and Chou2008; Shyy et al.
Reference Shyy, Aono, Chimakurthi, Trizila, Kang, Cesnik and Liu2010, Reference Shyy, Aono, Kang and Liu2013). Further, it was reported that the former operates at
 $\unicode[STIX]{x1D714}^{\ast }\approx 1.8{-}2.2$
, whereas the latter has
 $\unicode[STIX]{x1D714}^{\ast }\approx 4{-}6$
, clearly indicating a direct relationship between the optimum functioning zone of insects and their FSI indices. Thus, our findings have close similarities with flapping locomotion endowed by nature.
Moreover, with reference to figure 13(a), it is clearly evident that the magnitude of the maximum cruising velocity
 $\bar{U}$
increases with an increase in both
 $\unicode[STIX]{x1D713}$
and
 $Re_{f}$
. Further, for
 $\unicode[STIX]{x1D713}>1$
the effect of
 $Re_{f}$
is even more pronounced. On the other hand, a negligible and moderate increase in cruising velocity is recorded for
 $\unicode[STIX]{x1D713}=0.1$
and
 $\unicode[STIX]{x1D713}=0.3$
, respectively. With an increase in
 $Re_{f}$
, the change in
 $\bar{U}$
is marginal, significant and extremely large as
 $Re_{f}$
increases from 20 to 100 for
 $\unicode[STIX]{x1D713}=0.1$
, 0.3 and 3, respectively. In addition, at high values of stiffness (
 $\unicode[STIX]{x1D714}^{\ast }\approx 10$
) with flow scenarios corresponding to fixed
 $Re_{f}$
, the cruising velocity becomes nearly independent of the FSI index. For
 $\unicode[STIX]{x1D713}=3$
, the velocity seems to be slightly higher than that for lower FSI indices for the chosen frequency ratio range but was observed to approach the same value at a greater
 $\unicode[STIX]{x1D714}^{\ast }$
(
 $\unicode[STIX]{x1D714}^{\ast }\approx 15$
, not shown). Thus, the cruising velocity at a fixed
 $Re_{f}$
for a wing with high stiffness is not greatly influenced by changes in structural inertia and aerodynamics, which is also shown in our earlier publication (Arora et al.
Reference Arora, Gupta, Sanghi, Aono and Shyy2016a
).
4.2.2 Comparison of peak
 $\bar{U}$
at different
$\unicode[STIX]{x1D713}$


In order to understand the reasons for the improvement in cruising velocity with an increase in the FSI index, comparisons are drawn between the respective peak velocities at
 $\unicode[STIX]{x1D713}=0.1$
and
 $\unicode[STIX]{x1D713}=3$
at
 $Re_{f}=100$
. In this regard, the evolution of tip deflection, instantaneous shape and flow field for these two cases are examined. Figure 15(a) shows the behaviour of tip deflection
 $\unicode[STIX]{x1D6FC}$
as a function of time for the two cases. Corresponding wing shapes at the marked time instants are compared in figure 15(b). As shown, different bending patterns are exhibited by the plunging wing for
 $\unicode[STIX]{x1D713}=0.1$
and
 $\unicode[STIX]{x1D713}=3$
when it propels with the maximum velocity. The main difference between the two structural modes is that the maximum deflection of the wing happens to occur at the middle of the stroke for
 $\unicode[STIX]{x1D713}=3$
, whereas it is at the end of the stroke for
 $\unicode[STIX]{x1D713}=0.1$
. This difference in bending pattern is solely due to inertia dominating over aerodynamics for
 $\unicode[STIX]{x1D70C}^{\ast }\unicode[STIX]{x1D6FF}\geqslant 2$
flows and is the key finding of this work. Further, the magnitude of wing bending is larger for
 $\unicode[STIX]{x1D713}=3$
, which manifests in the maximum thrust and highest cruising velocity amongst all the numerical simulations performed. This aspect is better understood by studying the phase difference induced between plunging and passive pitching motions at
 $\unicode[STIX]{x1D713}=3$
, whose existence was also revealed by the phenomenological solution. When compared, the pitching and plunging motions are almost in phase as their respective maxima and minima coincide in time (shown by instants a,e,i in figure 15
a) for
 $\unicode[STIX]{x1D713}=0.1$
, whereas the maxima and minima of the tip deflection are coincident with zero plunging displacement for
 $\unicode[STIX]{x1D713}=3$
. The latter observation confirms a phase difference of approximately
 $\unicode[STIX]{x03C0}/2$
between plunging and pitching displacements which was shown in figure 12 as well.
As per the universal conventions with respect to pitching, the
 $\unicode[STIX]{x1D713}=0.1$
case represents an advanced rotation mode as against the delayed or nearly synchronous rotation for
 $\unicode[STIX]{x1D713}=3$
. Dai et al. (Reference Dai, Luo and Doyle2012) also indicated that the presence of a phase difference between plunging and passive pitching under hovering-type flapping motion was accountable for better aerodynamic performance of flexible low mass ratio wings (fluid force dominated) compared to high mass ratio wings (structural inertia dominated). It was reported that pitching, which happened to be advanced for high mass ratios, transformed to slightly delayed for low mass ratios during stroke reversals. Earlier studies (Kang & Shyy Reference Kang and Shyy2013, Reference Kang and Shyy2014) also concluded that the maximum lift occurs for a synchronized mode of rotation. The phase difference
 $\unicode[STIX]{x1D719}$
in our simulations also indirectly confirms these results. It is clear that this understanding of the phase difference between plunging and pitching can influence the choice of kinematics necessary for highest thrust generation.
(a) Tip deflection,
 $\unicode[STIX]{x1D6FC}$
as a function of time at
 $\unicode[STIX]{x1D713}=0.1$
and
 $\unicode[STIX]{x1D713}=3$
with
 $Re_{f}=100$
along with instantaneous plunging displacement. A schematic diagram illustrating the tip deflection of the plate is shown in the inset. (b) The shape of the wing at different time instants during downstroke and upstroke at the time instants represented by dotted lines in (a).
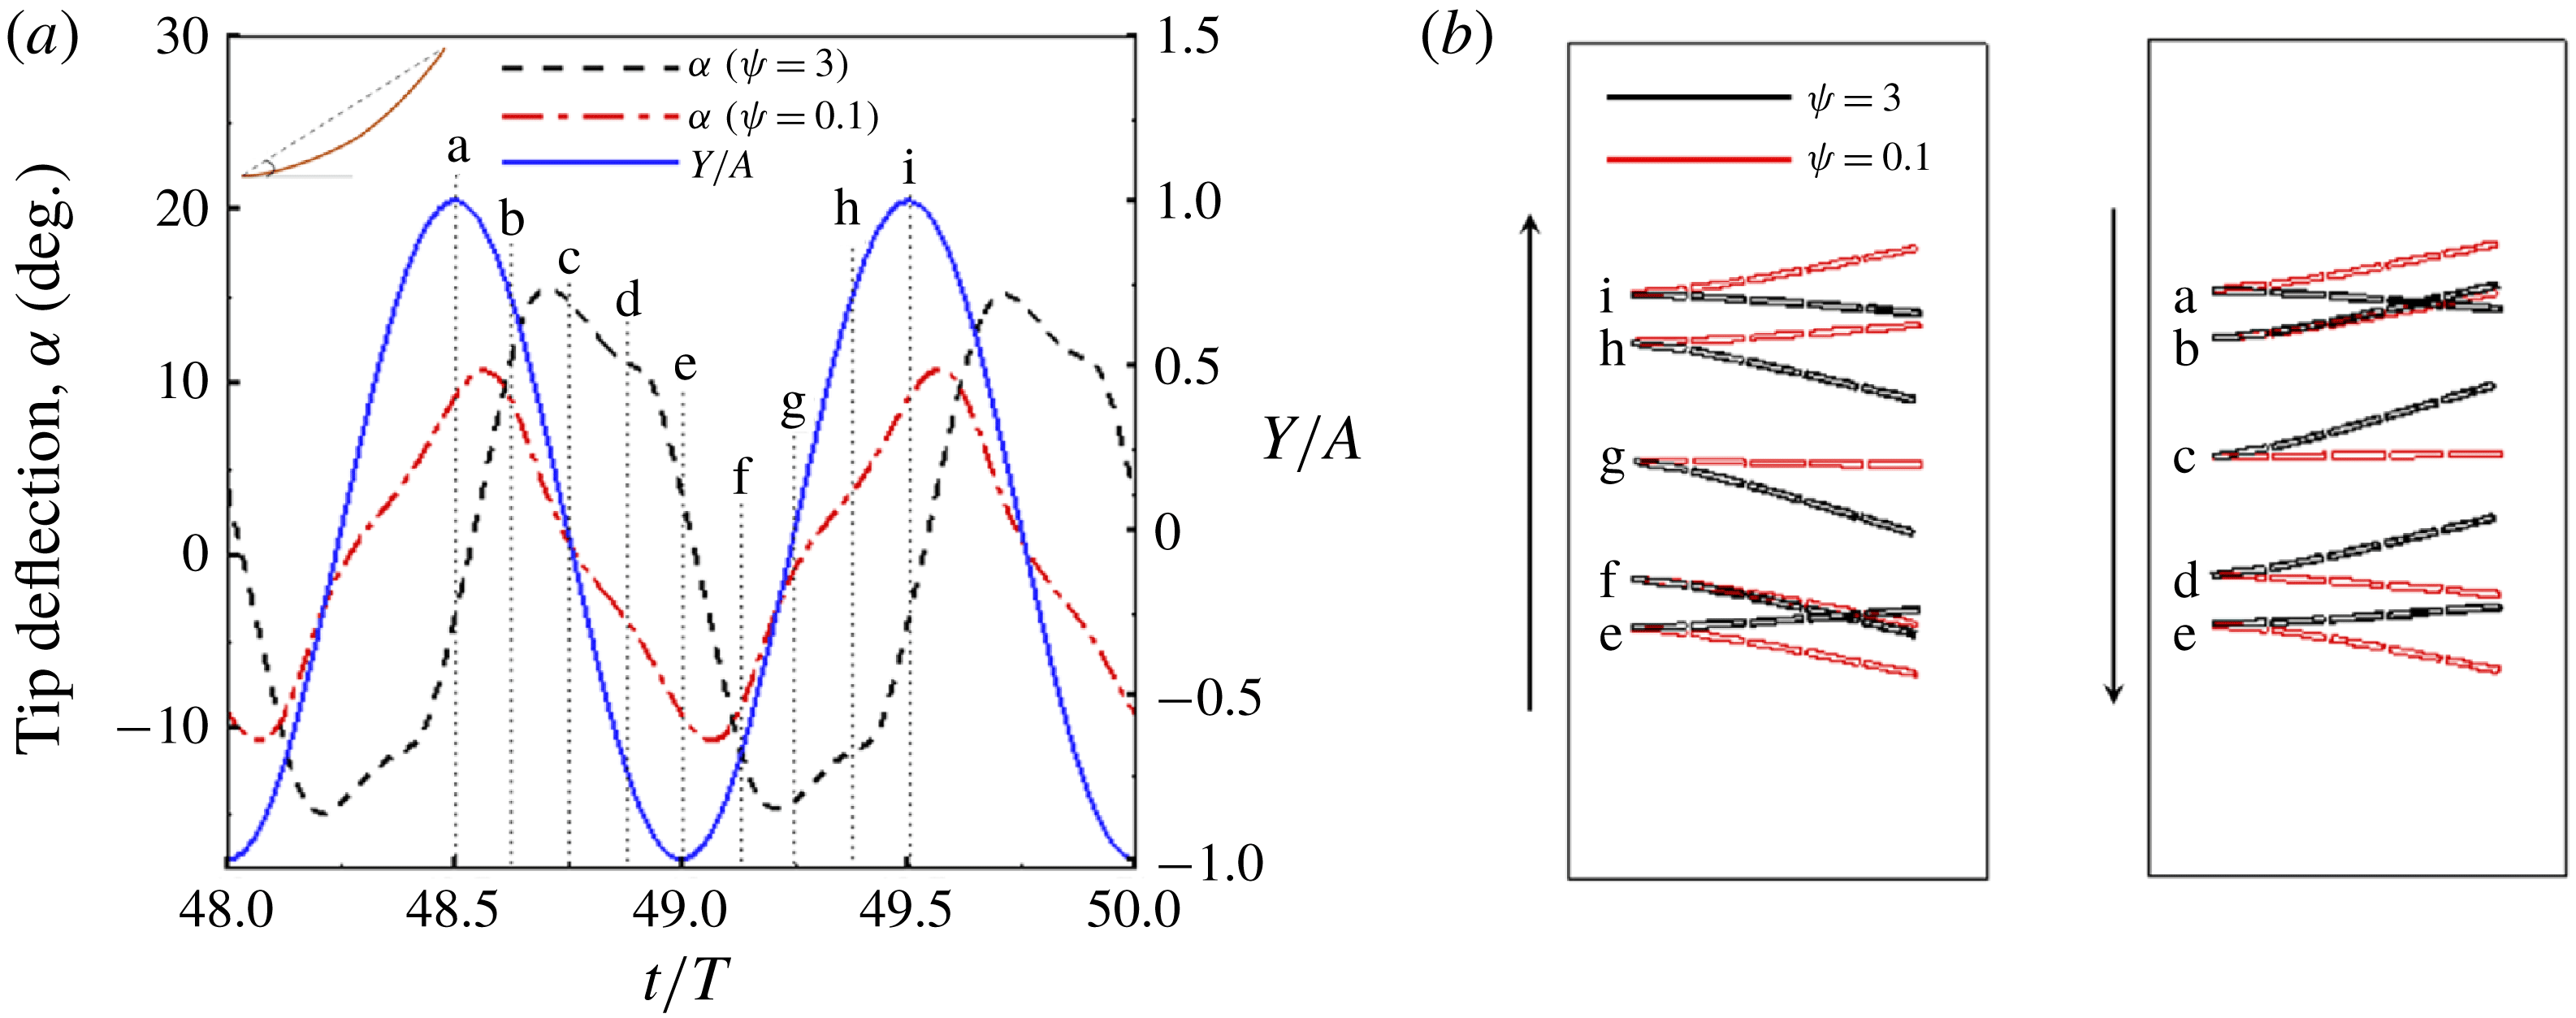
Another crucial observation is made with reference to the rate of change of angular deflection shown in figure 15(b). For
 $\unicode[STIX]{x1D713}=3$
, it is remarkably high during stroke reversals and very modest during the stroke, i.e. the plate changes its concavity almost instantaneously (from a to b and e to f) and maintains the shape during the remaining half-stroke (b to d and f to h). On the other hand, the rate of bending remains unchanged during the stroke reversals and is moderate during the half-stroke for
 $\unicode[STIX]{x1D713}=0.1$
. The time taken by the plate for adapting to a new concave shape at
 $\unicode[STIX]{x1D713}=3$
(a to b) is appreciably lower than for
 $\unicode[STIX]{x1D713}=0.1$
(a to e).
In order to probe the relationship between plunging and passive pitching in terms of propulsion performance, a comparison of thrust and drag coefficients for these two cases is shown in figure 16. As anticipated, the thrust coefficient is significantly higher and, simultaneously, the drag coefficient is surprisingly smaller at
 $\unicode[STIX]{x1D713}=3$
. Analogous to plunging and passive pitching motions, peaks in the thrust coefficients are temporally displaced as well with a phase difference of
 ${\sim}\unicode[STIX]{x03C0}/2$
. Additionally, the maximum thrust occurs at the mean positions of both the half-strokes when the wing has a maximum deflection, i.e. at time instants or positions (c,g). For
 $\unicode[STIX]{x1D713}=0.1$
, the maximum thrust is recorded at the end of the stroke (between positions a,b during the downstroke and e,f during the upstroke). Thus, the peak thrust for both cases is registered at wing positions corresponding to maximum angular deflection. Interestingly, the drag coefficient seems to be unaffected (except the magnitude) as both the curves are in phase and their peaks coincide in time. Hence, for scenarios with high FSI index, it can be inferred that the wing responds quickly during stroke reversals as its shape gets aligned in compliance with the aerodynamic forces that maximize the aerodynamic thrust and minimize drag, and the induced phase difference between plunging and pitching has a large role in determining this.
A comparison of instantaneous (a) thrust and (b) drag coefficients for
 $\unicode[STIX]{x1D713}=0.1$
and
 $\unicode[STIX]{x1D713}=3$
with
 $Re_{f}=100$
.
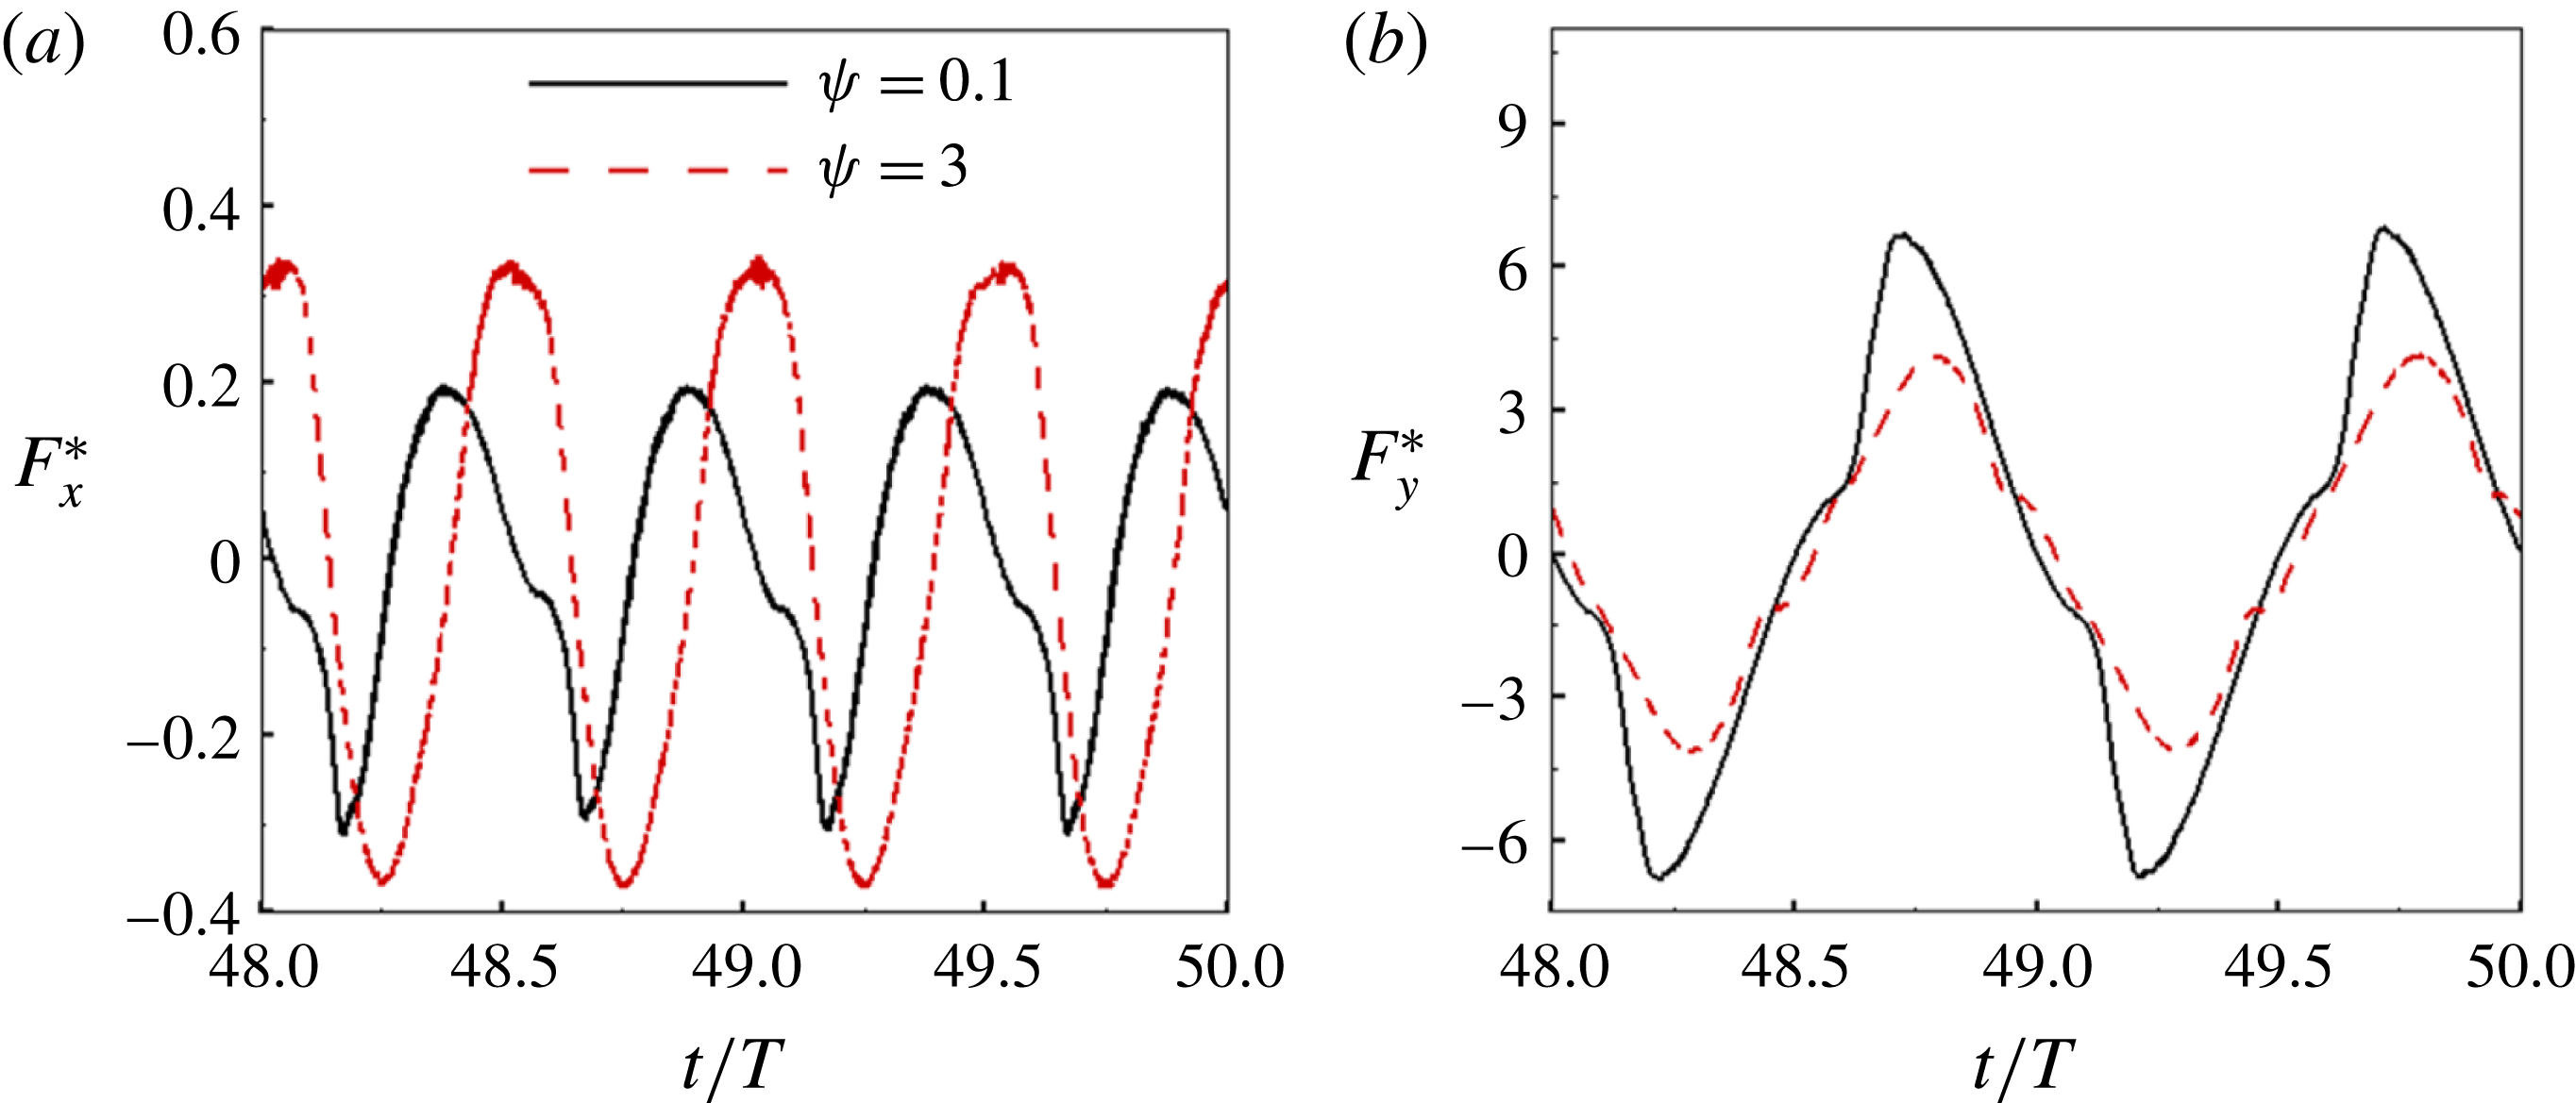
4.2.3 Cruising performance
The cruising power coefficient
 $\langle P_{i}\rangle$
as a function of
 $\unicode[STIX]{x1D714}^{\ast }$
at different combinations of
 $Re_{f}$
and
 $\unicode[STIX]{x1D713}$
is plotted in figure 17. Analogous to the cruising velocity, the input power coefficient initially increases, reaches a maximum and subsequently decreases with a decrease in
 $\unicode[STIX]{x1D714}^{\ast }$
for a fixed
 $Re_{f}$
and
 $\unicode[STIX]{x1D713}$
. Also, the location of the maximum
 $\langle P_{i}\rangle$
shifts away from unit frequency ratio with an increase in
 $\unicode[STIX]{x1D713}$
. Finally, for
 $\unicode[STIX]{x1D713}=3$
the sensitivity to
 $Re_{f}$
is apparent as the input power coefficient increases with increasing
 $Re_{f}$
.
Cruising power
 $\langle P_{i}\rangle$
as a function of
 $\unicode[STIX]{x1D714}^{\ast }$
at
 $Re_{f}=20$
and
 $Re_{f}=100$
with
 $\unicode[STIX]{x1D713}=0.1$
, 0.3 and 3.
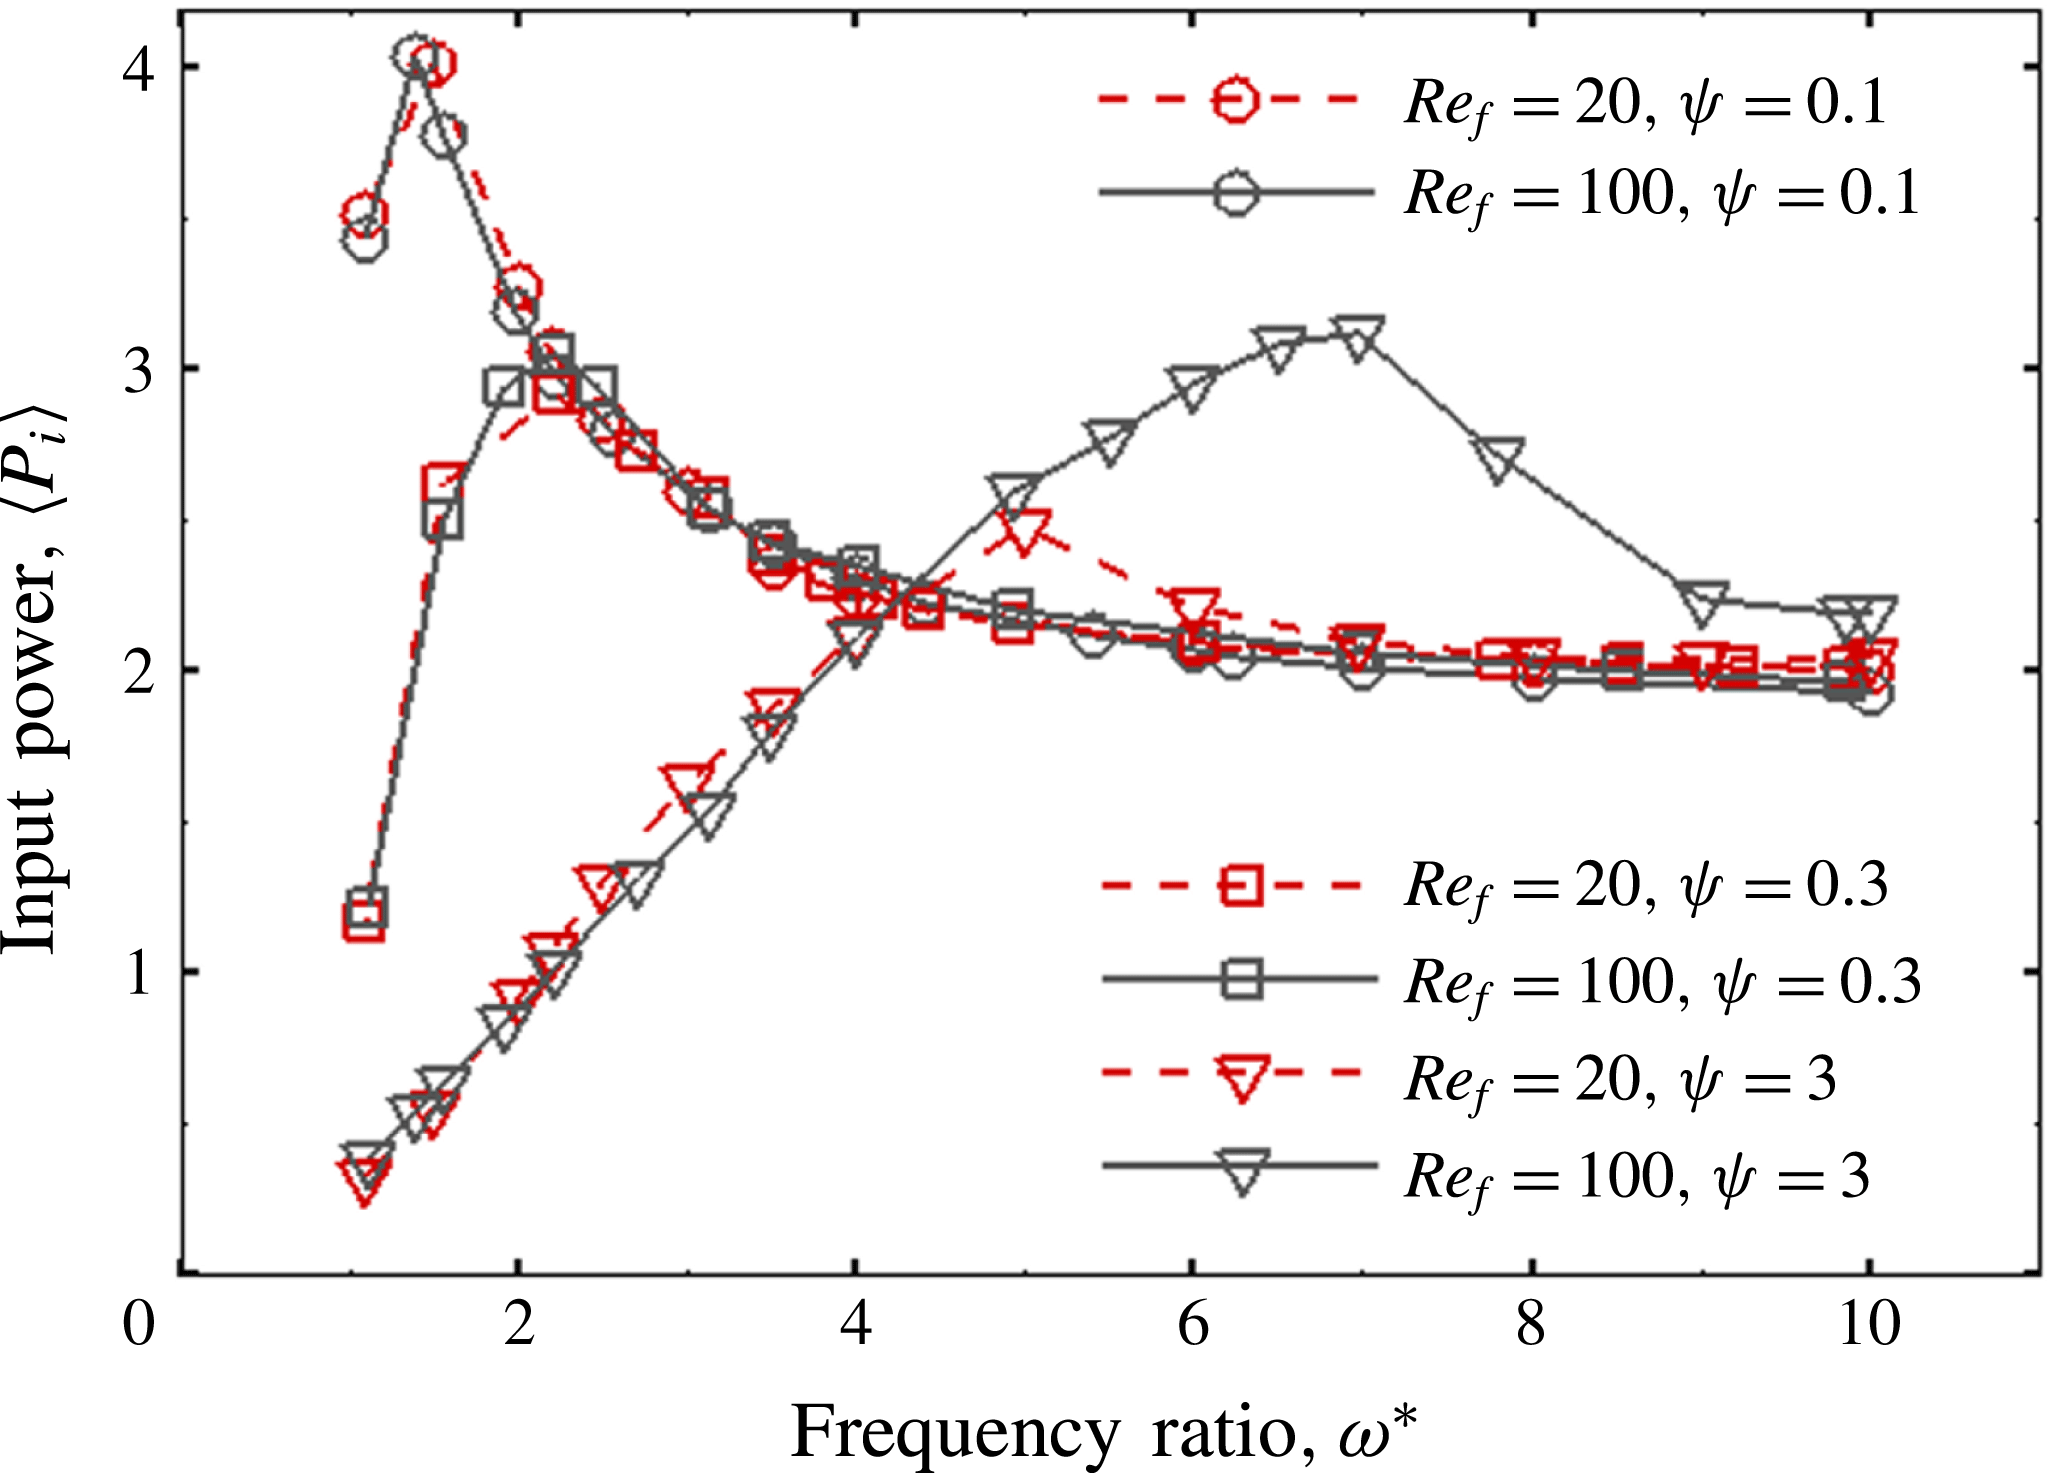
As shown in figure 17, the input power decreases with an increase in
 $\unicode[STIX]{x1D713}$
with the maximum and minimum power coefficients observed for
 $\unicode[STIX]{x1D713}=0.1$
and
 $\unicode[STIX]{x1D713}=3$
, respectively. Although the maximum input power at
 $\unicode[STIX]{x1D713}=3$
(for
 $Re_{f}=100$
) is quite comparable with that at
 $\unicode[STIX]{x1D713}=0.3$
, the maximum cruising velocity attained in the former case is significantly higher than in the latter. Although efficiency can be used to evaluate propulsion performance in self-propelled studies, it can be shown from a simple scaling analysis that efficiency is dependent upon the system variable
 $\unicode[STIX]{x1D713}$
(i.e.
 $\langle \unicode[STIX]{x1D702}\rangle \propto \bar{U}^{2}/[\langle P_{i}\rangle \unicode[STIX]{x1D713}]$
). Realizing that drawing comparisons using this definition may not be the most unbiased procedure for evaluating performance in the current scenario, another parameter, known as effectiveness and used by Yeh & Alexeev (Reference Yeh and Alexeev2014, Reference Yeh and Alexeev2016), has been used. This parameter is given by
 $$\begin{eqnarray}\unicode[STIX]{x1D716}=\frac{\bar{U}}{\langle P_{i}\rangle },\end{eqnarray}$$
where
 $\unicode[STIX]{x1D716}$
represents the distance covered per unit work and is independent of the aerodynamics to structural inertia ratio.
Cruising performance
 $\unicode[STIX]{x1D716}$
as a function of frequency ratio at (a) different
 $Re_{f}$
with constant
 $\unicode[STIX]{x1D713}$
and (b) different
 $\unicode[STIX]{x1D713}$
with constant
 $Re_{f}$
.
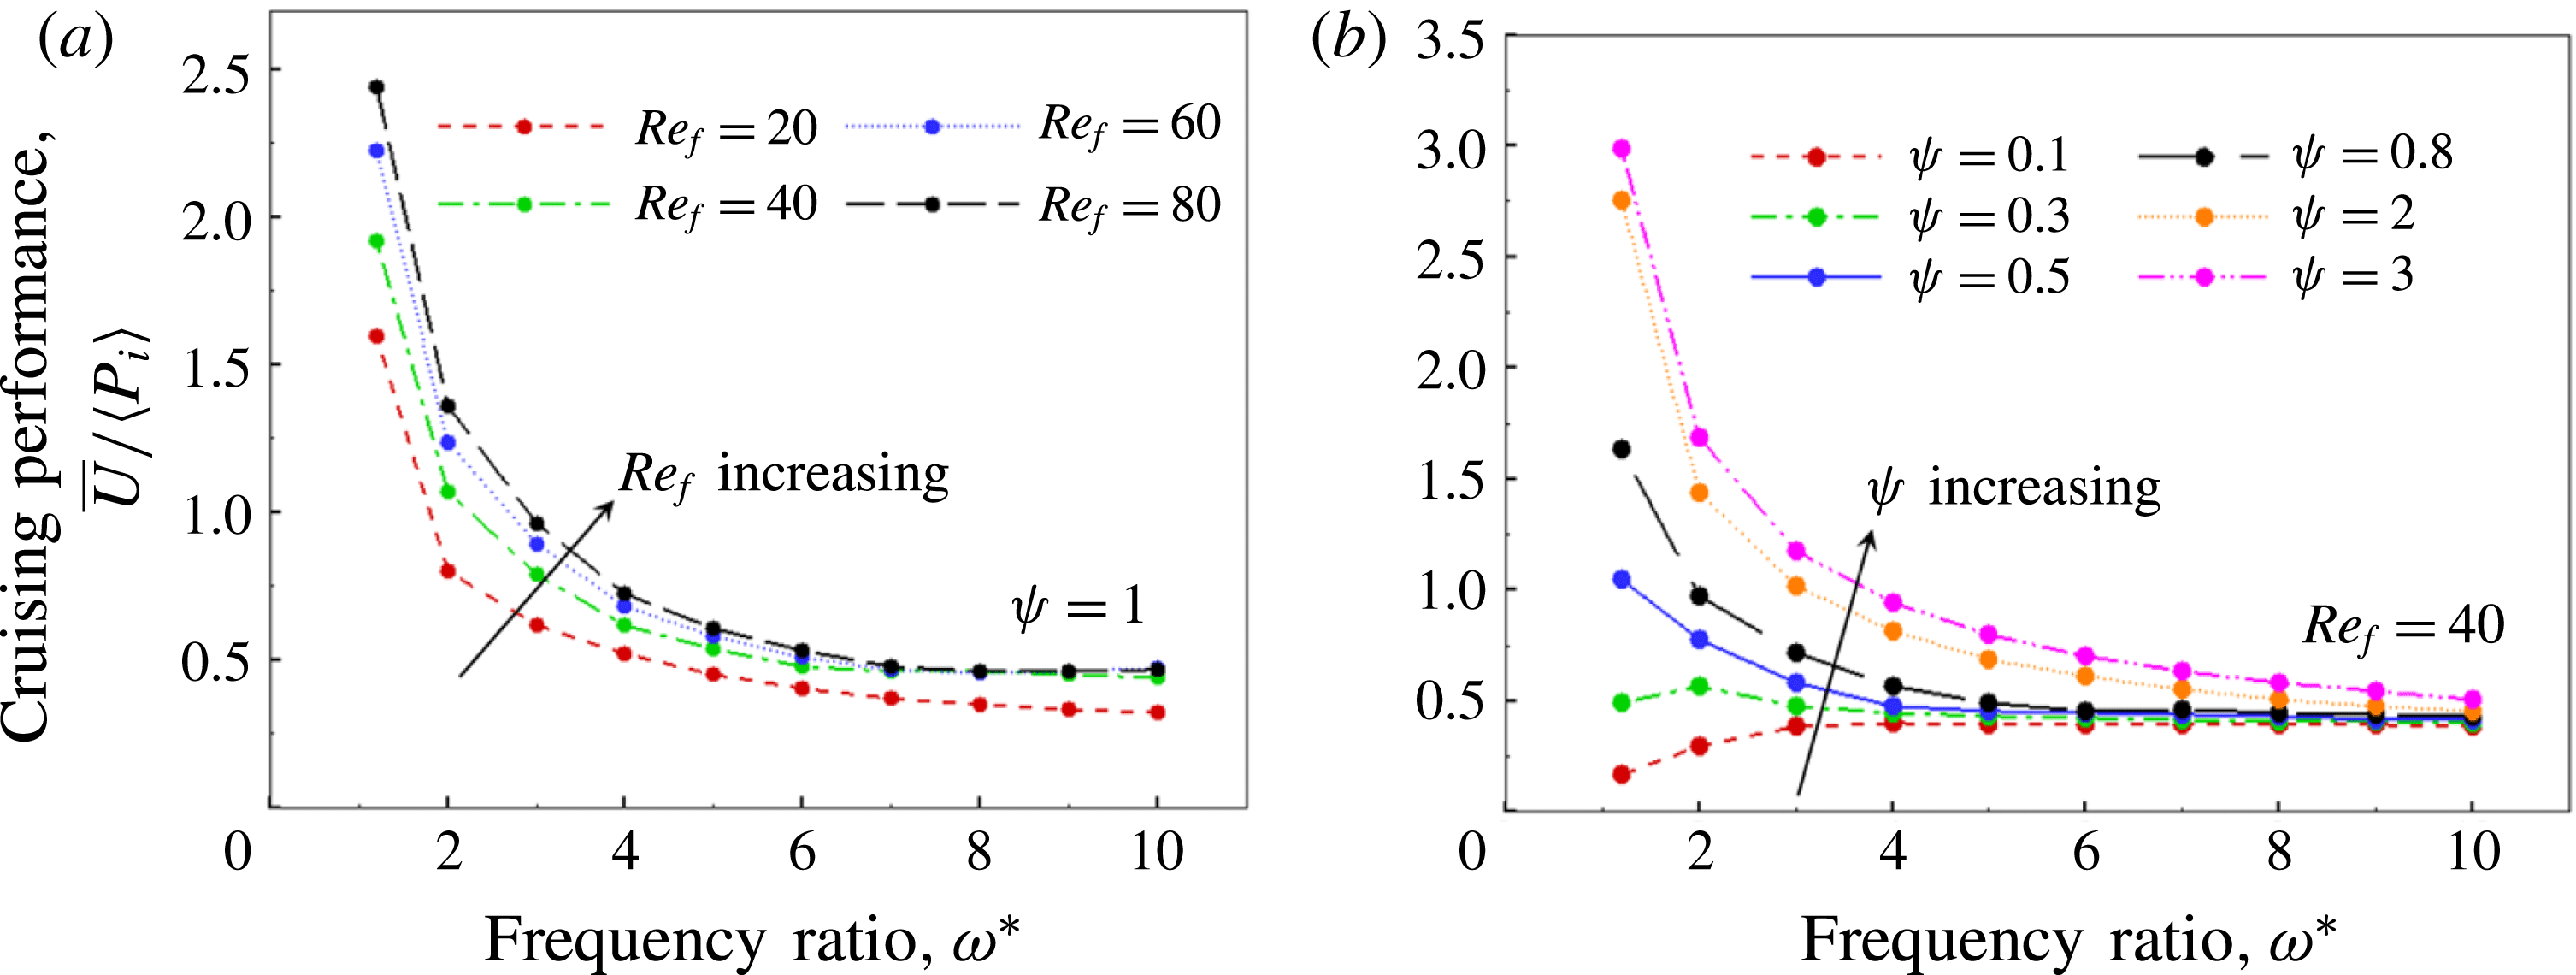
To illustrate its characteristics, figure 18(a) shows the variation of
 $\unicode[STIX]{x1D716}$
with
 $\unicode[STIX]{x1D714}^{\ast }$
for various
 $Re_{f}$
and
 $\unicode[STIX]{x1D713}$
. In general, cruising performance increases with an increase in
 $Re_{f}$
for all
 $\unicode[STIX]{x1D714}^{\ast }$
considered. As far as
 $\unicode[STIX]{x1D713}$
is concerned, the cruising performance results provide valuable insight that aerodynamics dominated deformation results in better mileage or distance travelled per unit input work as compared to structural inertia administered deformations (figure 18
b). For low values of
 $\unicode[STIX]{x1D713}$
(i.e.
 $\unicode[STIX]{x1D713}\leqslant 0.3$
), an optimum stiffness up to which a marginal improvement in performance with a decrease in
 $K^{\ast }$
(or decrease in
 $\unicode[STIX]{x1D714}^{\ast }$
) is noticeable. At
 $\unicode[STIX]{x1D713}=0.1$
, the performance deteriorates for
 $\unicode[STIX]{x1D714}^{\ast }<3$
and even falls below that of the highly stiff case (i.e.
 $\unicode[STIX]{x1D714}^{\ast }=10$
).
4.2.4 Role of structural resonance
For the sake of comparison with earlier studies and qualitative learning regarding the role of structural resonance in propulsion for flows with weak aerodynamic influence, additional simulations were performed with the plunging conditions of
 $Re_{f}=40$
and
 $\unicode[STIX]{x1D713}=0.25$
. Due to the limitations already described with a multiple-spring system plunging at frequency ratios near
 $\unicode[STIX]{x1D714}^{\ast }=1$
, simulations were conducted with a single-spring-link system. Three values of
 $K^{\ast }$
or frequency ratios
 $\unicode[STIX]{x1D714}^{\ast }$
encompassing different flow behaviours and patterns were selected and the corresponding instantaneous propulsion velocities are compared in figure 19. As
 $\unicode[STIX]{x1D714}^{\ast }$
increases, the magnitude of the quasi-steady velocity also increases. Nevertheless, the maximum fluctuations are observed for
 $\unicode[STIX]{x1D714}^{\ast }=0.95$
, which is understandable with the wing heaving near the structural resonance frequency. Another key observation relates to the direction of propagation of the velocity. For
 $\unicode[STIX]{x1D714}^{\ast }=0.95$
and
 $\unicode[STIX]{x1D714}^{\ast }=2$
, the plate propagated in the forward direction (towards the left or inlet of the computational domain), whereas for
 $\unicode[STIX]{x1D714}^{\ast }=0.5$
the plate moved in the backward direction (towards the right or outlet). For all of those cases where the wing translated in a manner opposite to the anticipated direction, the boundary conditions, i.e. inlet and outlet, were reversed to ensure that far upstream of the wing the flow velocity remained zero. Zhang et al. (Reference Zhang, Liu and Lu2010) in their study had reported a similar reversal in the movement of the plate from forward to backward at
 $\unicode[STIX]{x1D714}^{\ast }<1$
. Moreover, Spagnolie et al. (Reference Spagnolie, Moret, Shelley and Zhang2010) observed three different regimes of horizontal velocity corresponding to different flapping frequencies: zones of outperformance (higher cruising velocity) and underperformance, and a zone of hysteric locomotion in which the wing can move either forward or backward.
Dimensionless horizontal velocity of the flexible plunging airfoil as a function of time at
 $\unicode[STIX]{x1D714}^{\ast }=0.5$
, 0.95 and 2 for
 $Re_{f}=40$
and
 $\unicode[STIX]{x1D713}=0.25$
.
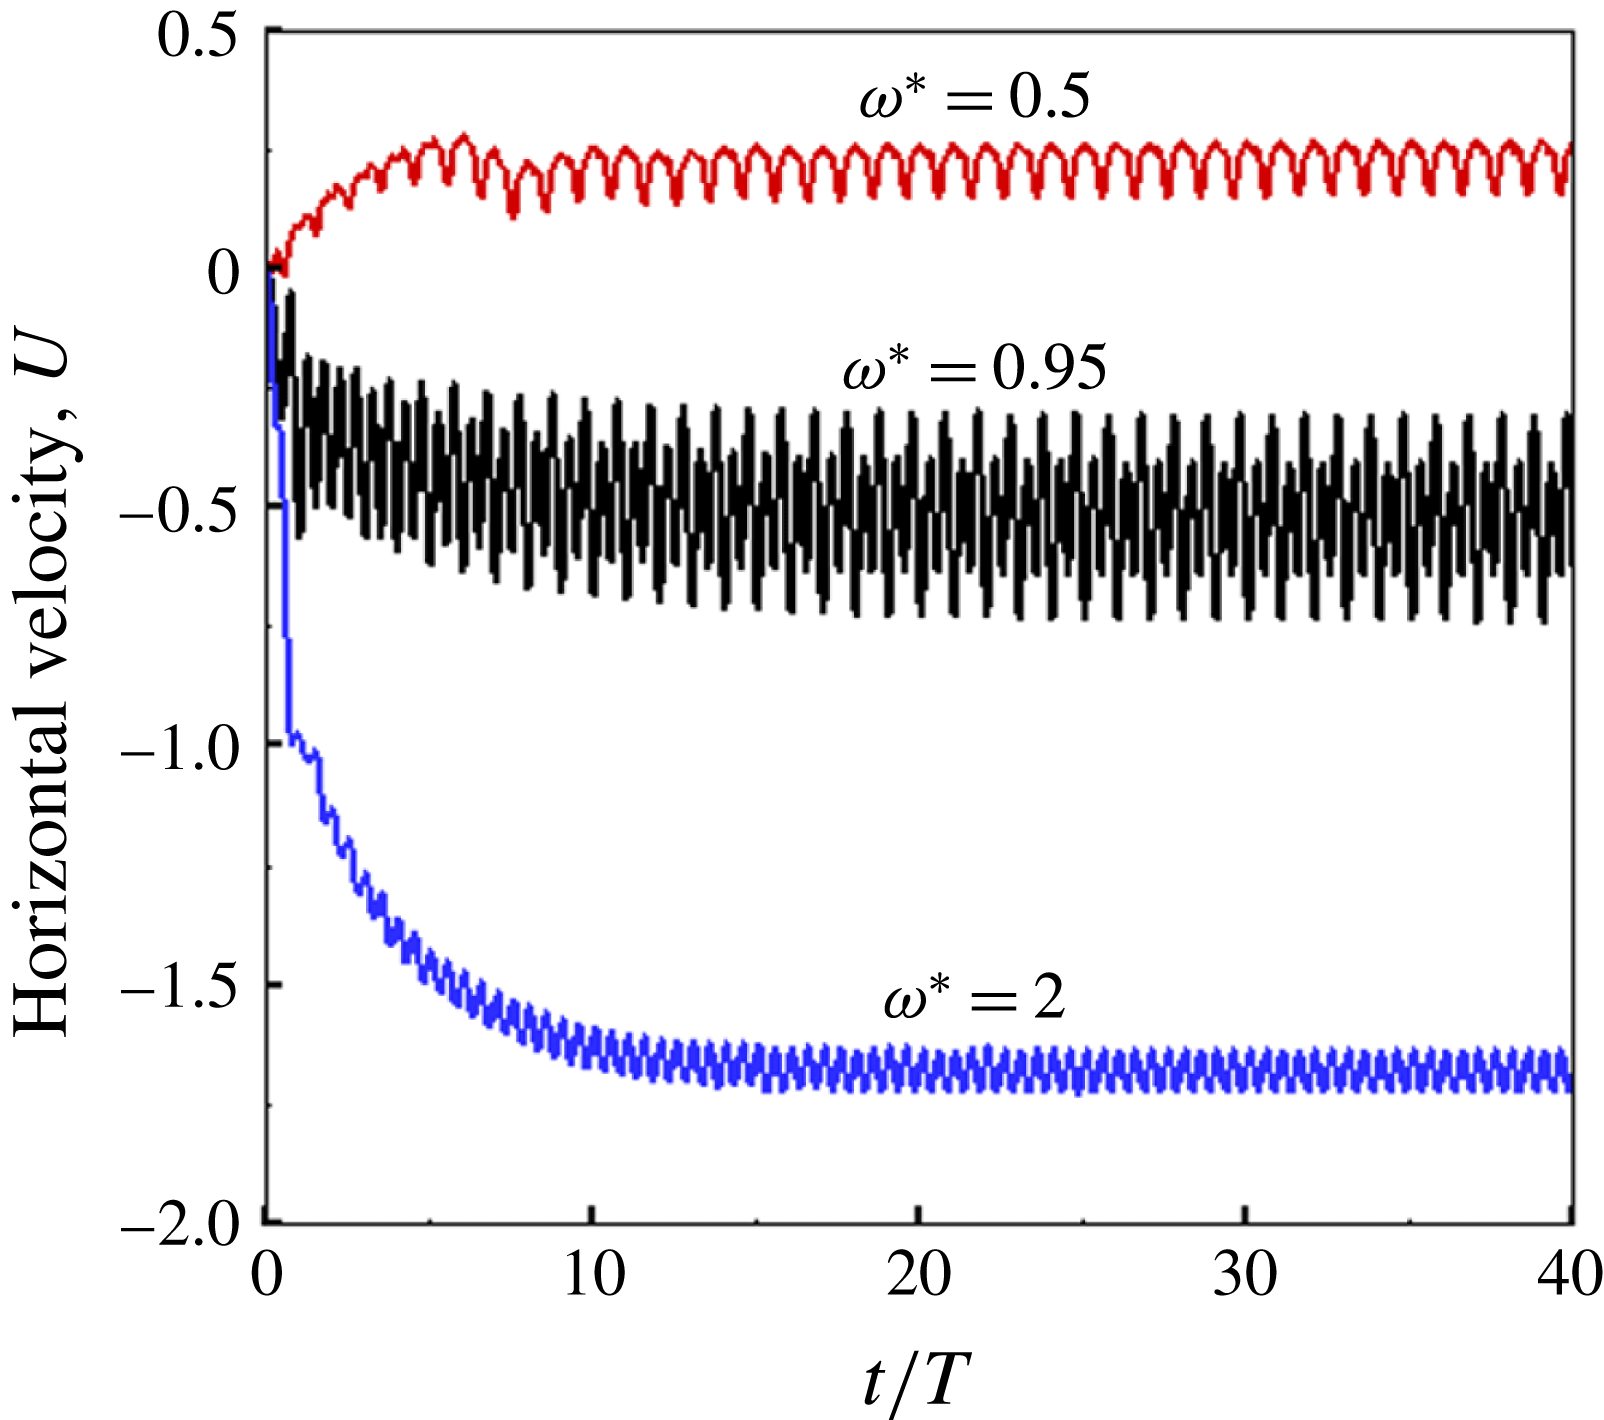
Figure 20 shows the variation of pitching angle
 $\unicode[STIX]{x1D6FC}$
with time for different values of
 $\unicode[STIX]{x1D714}^{\ast }$
. Amongst the three cases, the plate undergoes minimum passive pitching at
 $\unicode[STIX]{x1D714}^{\ast }=2$
, with
 $\unicode[STIX]{x1D6FC}$
varying between
 $-15^{\circ }$
and
 $15^{\circ }$
. At
 $\unicode[STIX]{x1D714}^{\ast }=0.95$
the angular deflection increases greatly as
 $\unicode[STIX]{x1D6FC}$
varies between
 $-60^{\circ }$
and
 $60^{\circ }$
. This happens since the plate was heaving in the inertia dominated regime near unit frequency ratio. As opposed to these two cases where the mean pitching angle was zero,
 $\unicode[STIX]{x1D6FC}$
varied between
 $-60^{\circ }$
and
 $15^{\circ }$
at
 $\unicode[STIX]{x1D714}^{\ast }=0.5$
. This peculiar occurrence can be better explained by the cycle-averaged pitching angle
 $\langle \unicode[STIX]{x1D6FC}\rangle$
(where
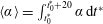 $\langle \unicode[STIX]{x1D6FC}\rangle =\int _{t_{0}^{\ast }}^{t_{0}^{\ast }+20}\unicode[STIX]{x1D6FC}\,\text{d}t^{\ast }$
is defined exactly like
 $\langle P_{i}\rangle$
). The value of
 $\langle \unicode[STIX]{x1D6FC}\rangle$
becomes non-zero (or the neutral axis of angular deflection becomes inclined to the horizontal) for the case of
 $\unicode[STIX]{x1D714}^{\ast }=0.5$
. The neutral pitching axis is marked for all three cases in the plots of tip deflection in figure 20(a–c) and a representative sketch illustrating this concept with respect to the pitching wing is shown in figure 20(d). Also plotted is the vertical displacement,
 $Y$
, to gauge the phase difference,
 $\unicode[STIX]{x1D719}$
, between the plunging and pitching motions. The phenomenological solution indicates that, for inertia dominated flows, the plunging and pitching are nearly synchronous, i.e.
 $\unicode[STIX]{x1D719}=\tan ^{-1}(0.25)=14^{\circ }$
for pre-natural frequency (
 $\unicode[STIX]{x1D714}^{\ast }>1$
), and become asynchronous (
 $\unicode[STIX]{x1D719}=\unicode[STIX]{x03C0}-\tan ^{-1}(0.25)\approx 166^{\circ }$
, see appendix A) at natural and post-natural frequencies (
 $\unicode[STIX]{x1D714}^{\ast }\leqslant 1$
). The numerical simulations confirm these outcomes as plunging and pitching are almost synchronous for
 $\unicode[STIX]{x1D714}^{\ast }=2$
(figure 20
a) with
 $\unicode[STIX]{x1D719}\approx 10^{\circ }$
. Although minor disagreements are expected, nevertheless the phenomenological solution does provide a qualitative picture for the phase difference as a function of
 $\unicode[STIX]{x1D714}^{\ast }$
and
 $\unicode[STIX]{x1D713}$
, and its further implications will be discussed in the forthcoming section. The backward movement of the wing at
 $\unicode[STIX]{x1D714}^{\ast }=0.5$
can thus be attributed to the out-of-phase plunging and pitching and suggests that biological flyers may operate at
 $\unicode[STIX]{x1D714}^{\ast }<1$
to decelerate or come to a halt while perching. This is also consistent with the results reported by Spagnolie et al. (Reference Spagnolie, Moret, Shelley and Zhang2010) and Zhang et al. (Reference Zhang, Liu and Lu2010) who stated that the phase relationship between heaving and pitching varies with plunging frequency and the wing translates in the backward direction when
 $\unicode[STIX]{x1D719}\geqslant 180^{\circ }$
.
Pitching angle
 $\unicode[STIX]{x1D6FC}$
(in degrees) and dimensionless vertical position
 $Y$
(non-dimensionalized by chord
 $C$
) versus plunging cycle at (a)
 $\unicode[STIX]{x1D714}^{\ast }=2$
, (b)
 $\unicode[STIX]{x1D714}^{\ast }=0.95$
and (c)
 $\unicode[STIX]{x1D714}^{\ast }=0.5$
for
 $Re_{f}=40$
and
 $\unicode[STIX]{x1D713}=0.25$
. The dotted lines represent time instants during upstroke at which the flow field around the wing is shown in figure 21. Also, the neutral pitching axis is marked for all three cases. (d) A representative illustration for zero and non-zero cycle-averaged pitching.
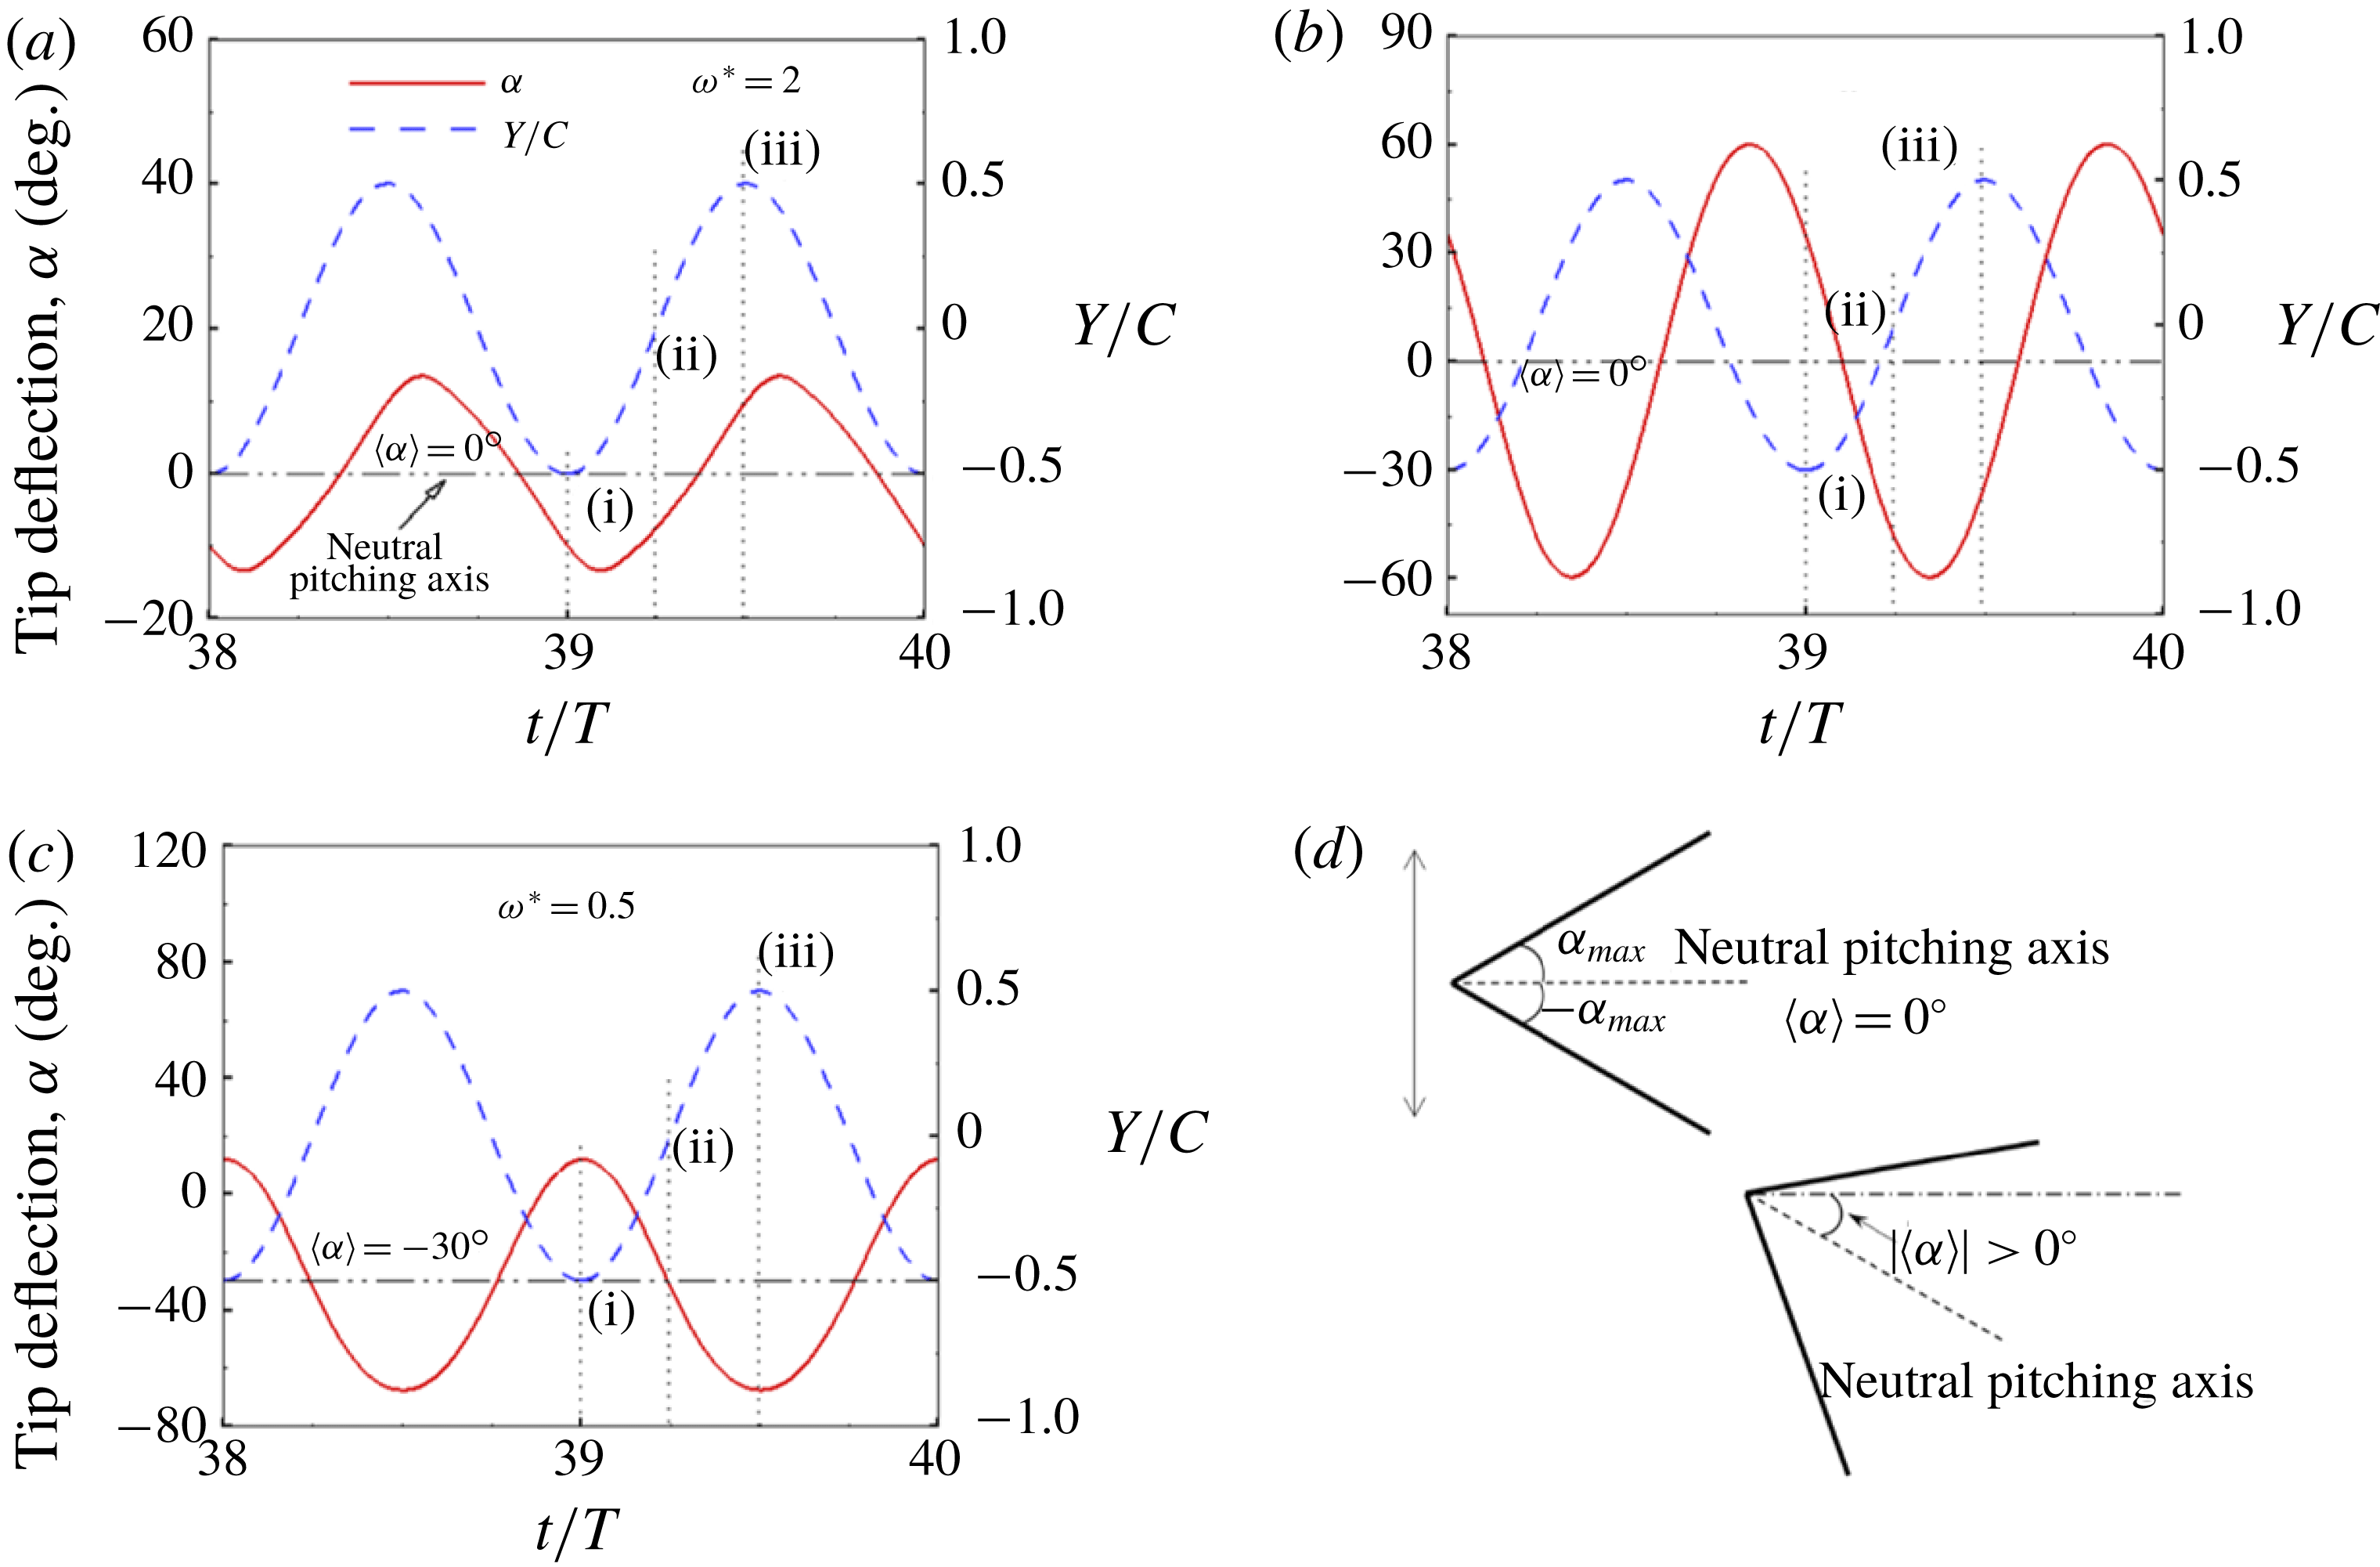
The flow fields around the plunging flat plate at quasi-steady state for
 $\unicode[STIX]{x1D714}^{\ast }=2$
, 0.95 and 0.5 are shown in figures 21(a), 21(b) and 21(c), respectively. As was shown in figure 20(a), at
 $\unicode[STIX]{x1D714}^{\ast }=2$
the wake pattern is symmetric. Two oppositely directed vortices, one during upstroke and the other during downstroke, are shed from the leading edge that advect downstream and form a visible wake. At
 $\unicode[STIX]{x1D714}^{\ast }=0.95$
and
 $\unicode[STIX]{x1D714}^{\ast }=0.5$
, the wake pattern obtained is deflected. For
 $\unicode[STIX]{x1D714}^{\ast }=0.5$
, the neutral pitching axis is inclined to the horizontal. A closer scrutiny of the flow field around the wing for
 $\unicode[STIX]{x1D714}^{\ast }=0.95$
revealed that, despite
 $\langle \unicode[STIX]{x1D6FC}\rangle$
being zero, the vortex shedding was not identical during the two half-strokes, leading to a deflected wake. At the beginning of the downstroke, a leading-edge vortex (LEV) in nascent form is shed that traverses downstream and pushes the oppositely rotating vortex from the trailing edge. Nevertheless, no LEV is shed at the beginning of the upstroke that could shear the trailing-edge vortex (TEV), prolonging the latter’s duration of attachment. Thus, the TEV is shed much earlier during the downstroke and this premature disengagement results in an upward deflected wake. As the TEV is detached intermediate of the downstroke, the narrow layer that connects the TEV to the trailing edge gets assimilated into a feeble tail which is deflected downward. It was observed that the direction of the deflected wake reverses on altering the plunging kinematics (i.e. the upward directed wake obtained with initial displacement
 $y^{\ast }=-\unicode[STIX]{x1D6FD}\sin (2\unicode[STIX]{x03C0}t^{\ast })$
transformed into a downward directed wake with displacement
 $y^{\ast }=\unicode[STIX]{x1D6FD}\sin (2\unicode[STIX]{x03C0}t^{\ast })$
).
Wake patterns for a single torsion spring plate plunging at (a)
 $\unicode[STIX]{x1D714}^{\ast }=2$
, (b)
 $\unicode[STIX]{x1D714}^{\ast }=0.95$
and (c)
 $\unicode[STIX]{x1D714}^{\ast }=0.5$
for
 $Re_{f}=40$
and
 $\unicode[STIX]{x1D713}=0.25$
at cruising condition (40th cycle). The vorticity scale chosen for non-dimensionalization is
 $\unicode[STIX]{x1D701}_{c}=2\unicode[STIX]{x03C0}\unicode[STIX]{x1D6FD}\unicode[STIX]{x1D6FE}$
. Red and blue colours indicate anti-clockwise (out of the plane of the paper) and clockwise rotation (into the plane of the paper), respectively. The arrow indicates the direction of movement of the wing.
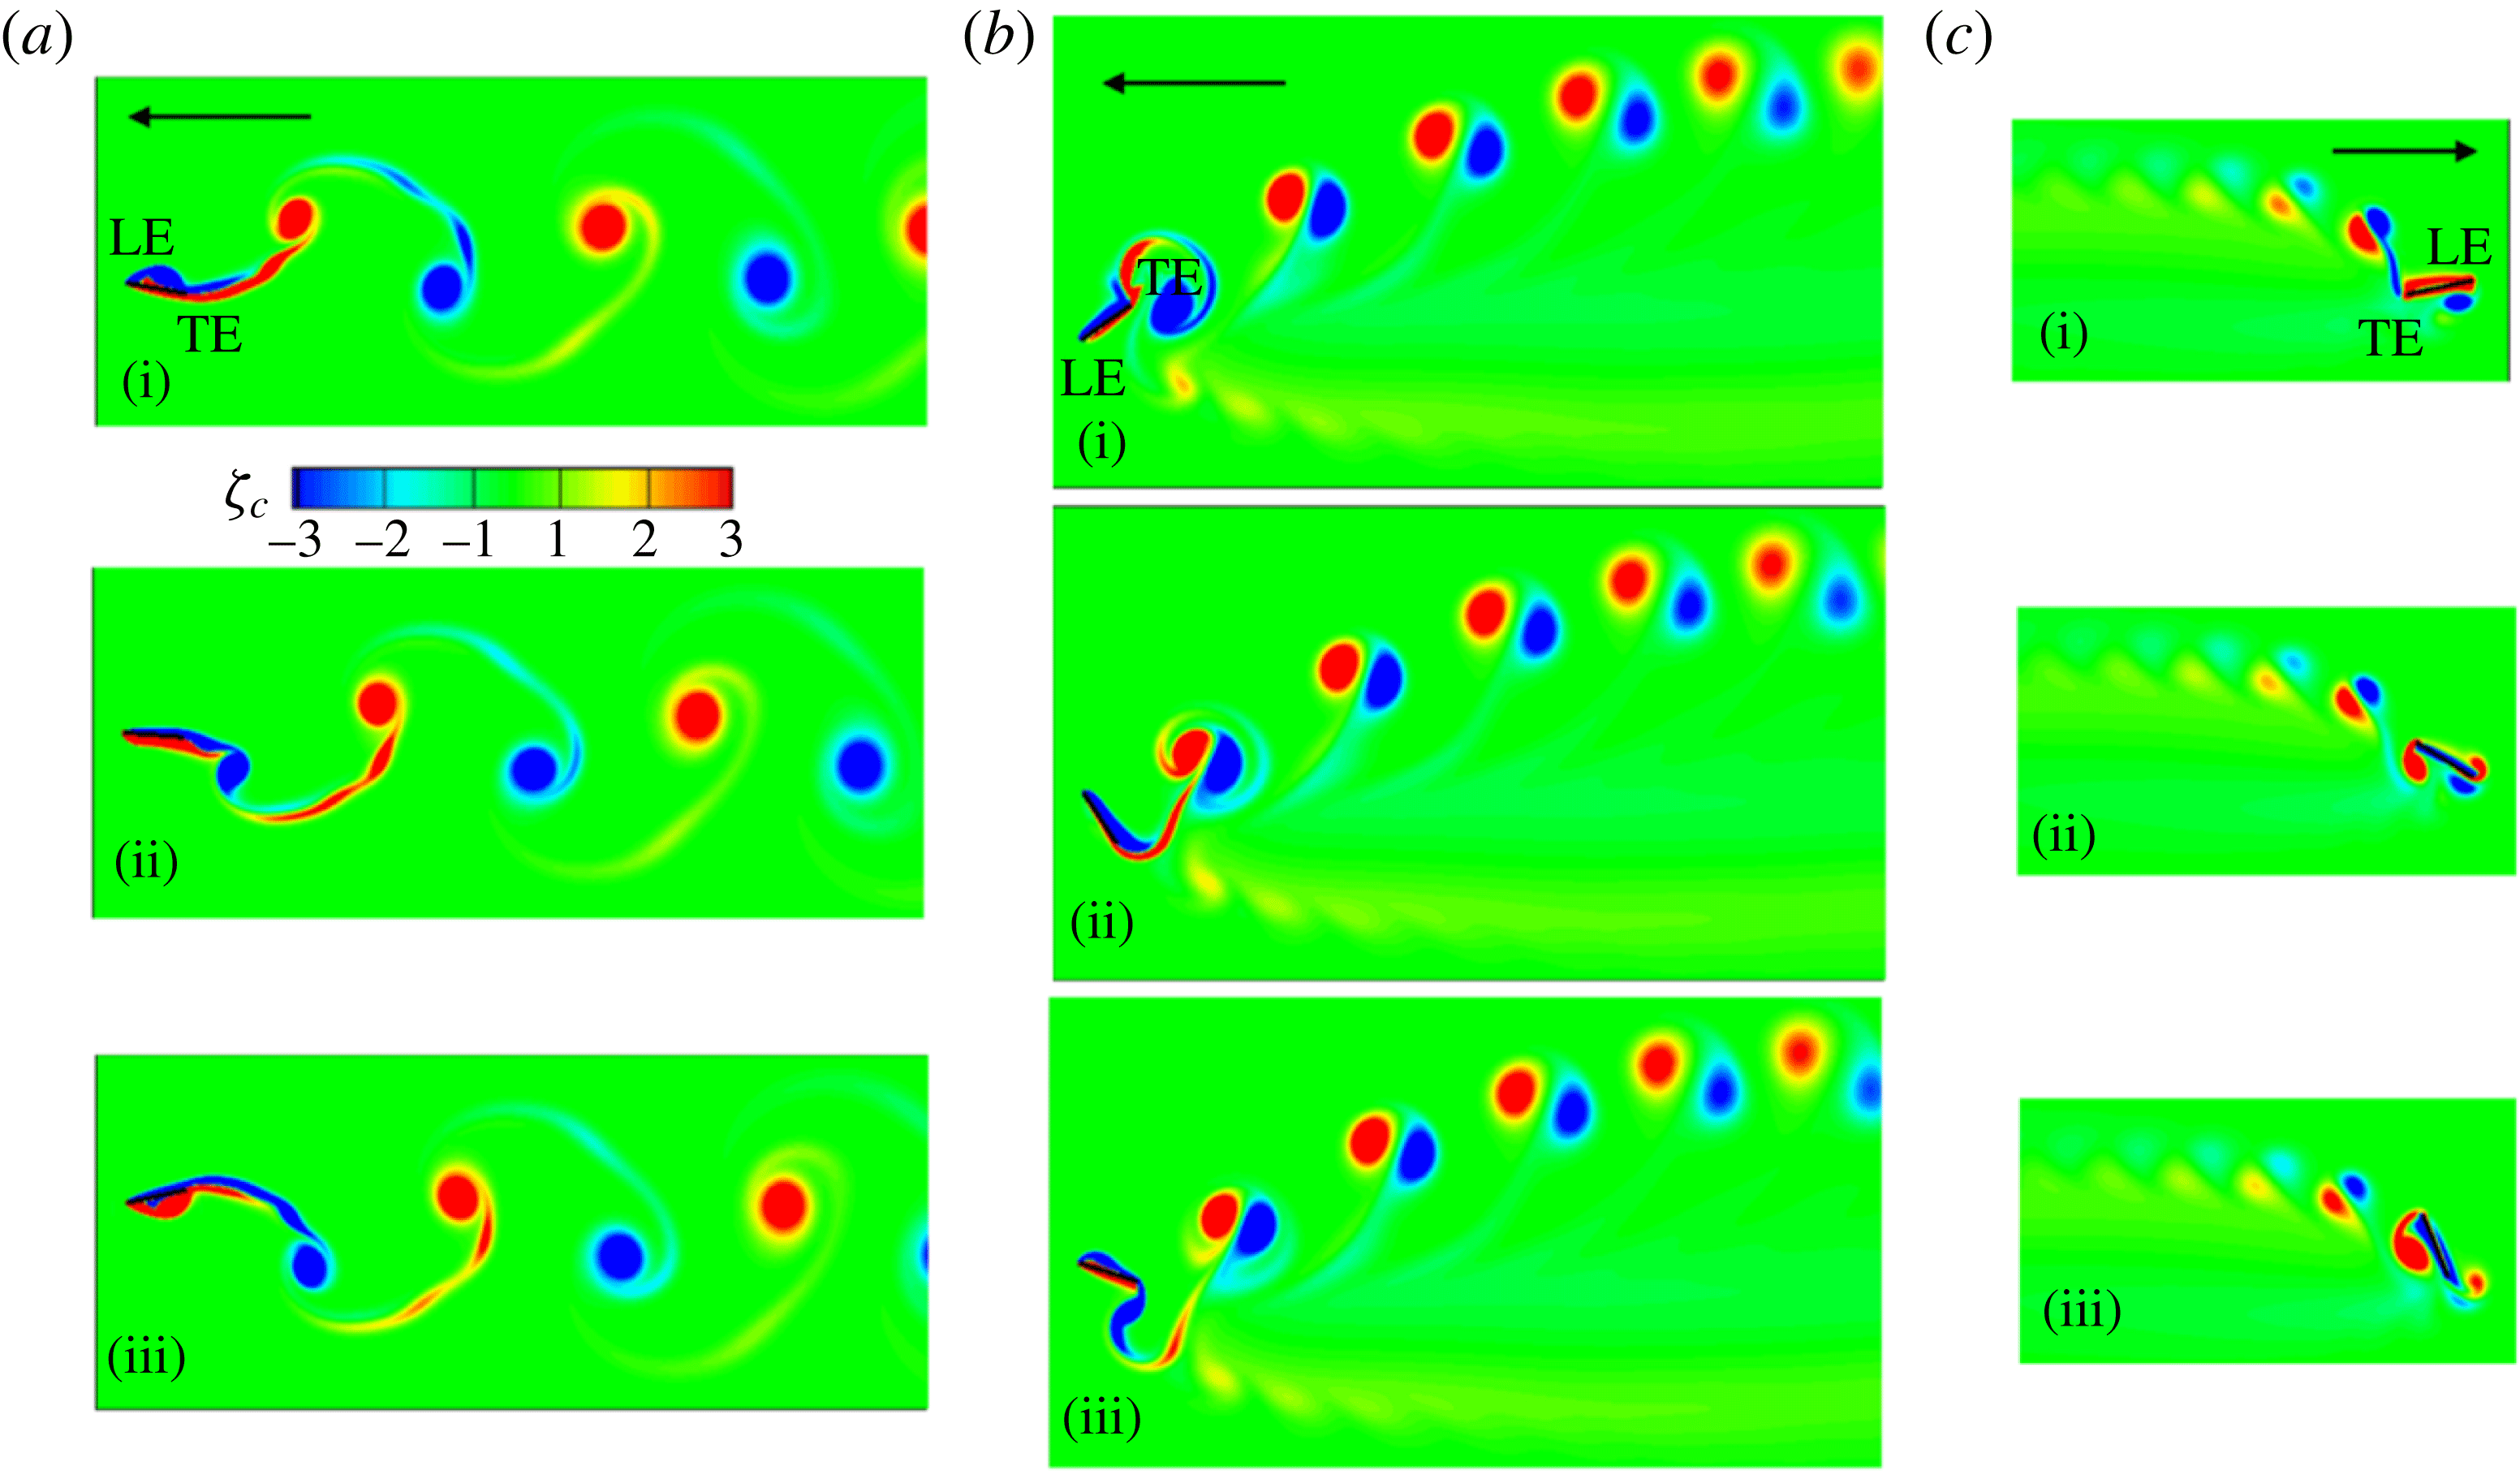
In addition, the highest thrust was noted at
 $\unicode[STIX]{x1D714}^{\ast }=0.95$
, as is shown in figure 22(a) where instantaneous thrust profiles for all three cases are compared. Thus, it can be inferred that the magnitude of thrust does not dictate the propulsion velocity only, rather the timing of the peaks in thrust and its relationship with the plunging motion have the bigger roles in influencing the forward velocity. More importantly, this occurrence also sheds light on the contradicting theories that are prevalent encompassing thrust and propulsion performance at structural resonance as discussed in § 1. Most of these studies were conducted by implementing hovering kinematics and hence could not envisage the manifestation of thrust converting into a propulsion velocity. Thus, the importance of our work on a self-propelled wing is apparent in revealing that although maximum thrust is generated at structural resonance, due to a phase difference between plunging and passive pitching, this is not converted into a high propulsion velocity. Moreover, as evident in figure 22(a), the frequency of thrust oscillations reduced from
 $2\unicode[STIX]{x1D6FE}$
at
 $\unicode[STIX]{x1D714}^{\ast }=2$
to
 $\unicode[STIX]{x1D6FE}$
at
 $\unicode[STIX]{x1D714}^{\ast }=0.5$
with an intermediate value at
 $\unicode[STIX]{x1D714}^{\ast }=0.95$
(which was also confirmed by the fast Fourier transform (FFT) analysis of these time varying signals). Thus, the deflection of the wake and sudden increase in thrust magnitude with a change in
 $\unicode[STIX]{x1D714}^{\ast }$
for a flexible wing marks the onset of reversal of the propulsion direction and can be referred to as the transition zone. A similar phenomenon of wake deflection was also reported for a rigid plunging plate (Arora et al.
Reference Arora, Gupta, Sanghi, Aono and Shyy2016a
) which characterized the alteration from aperiodic to periodic vortex shedding.
A comparison of instantaneous (a) thrust and (b) drag profiles at
 $\unicode[STIX]{x1D714}^{\ast }=2$
,
 $\unicode[STIX]{x1D714}^{\ast }=0.95$
and
 $\unicode[STIX]{x1D714}^{\ast }=0.5$
for
 $Re_{f}=40$
and
 $\unicode[STIX]{x1D713}=0.25$
.
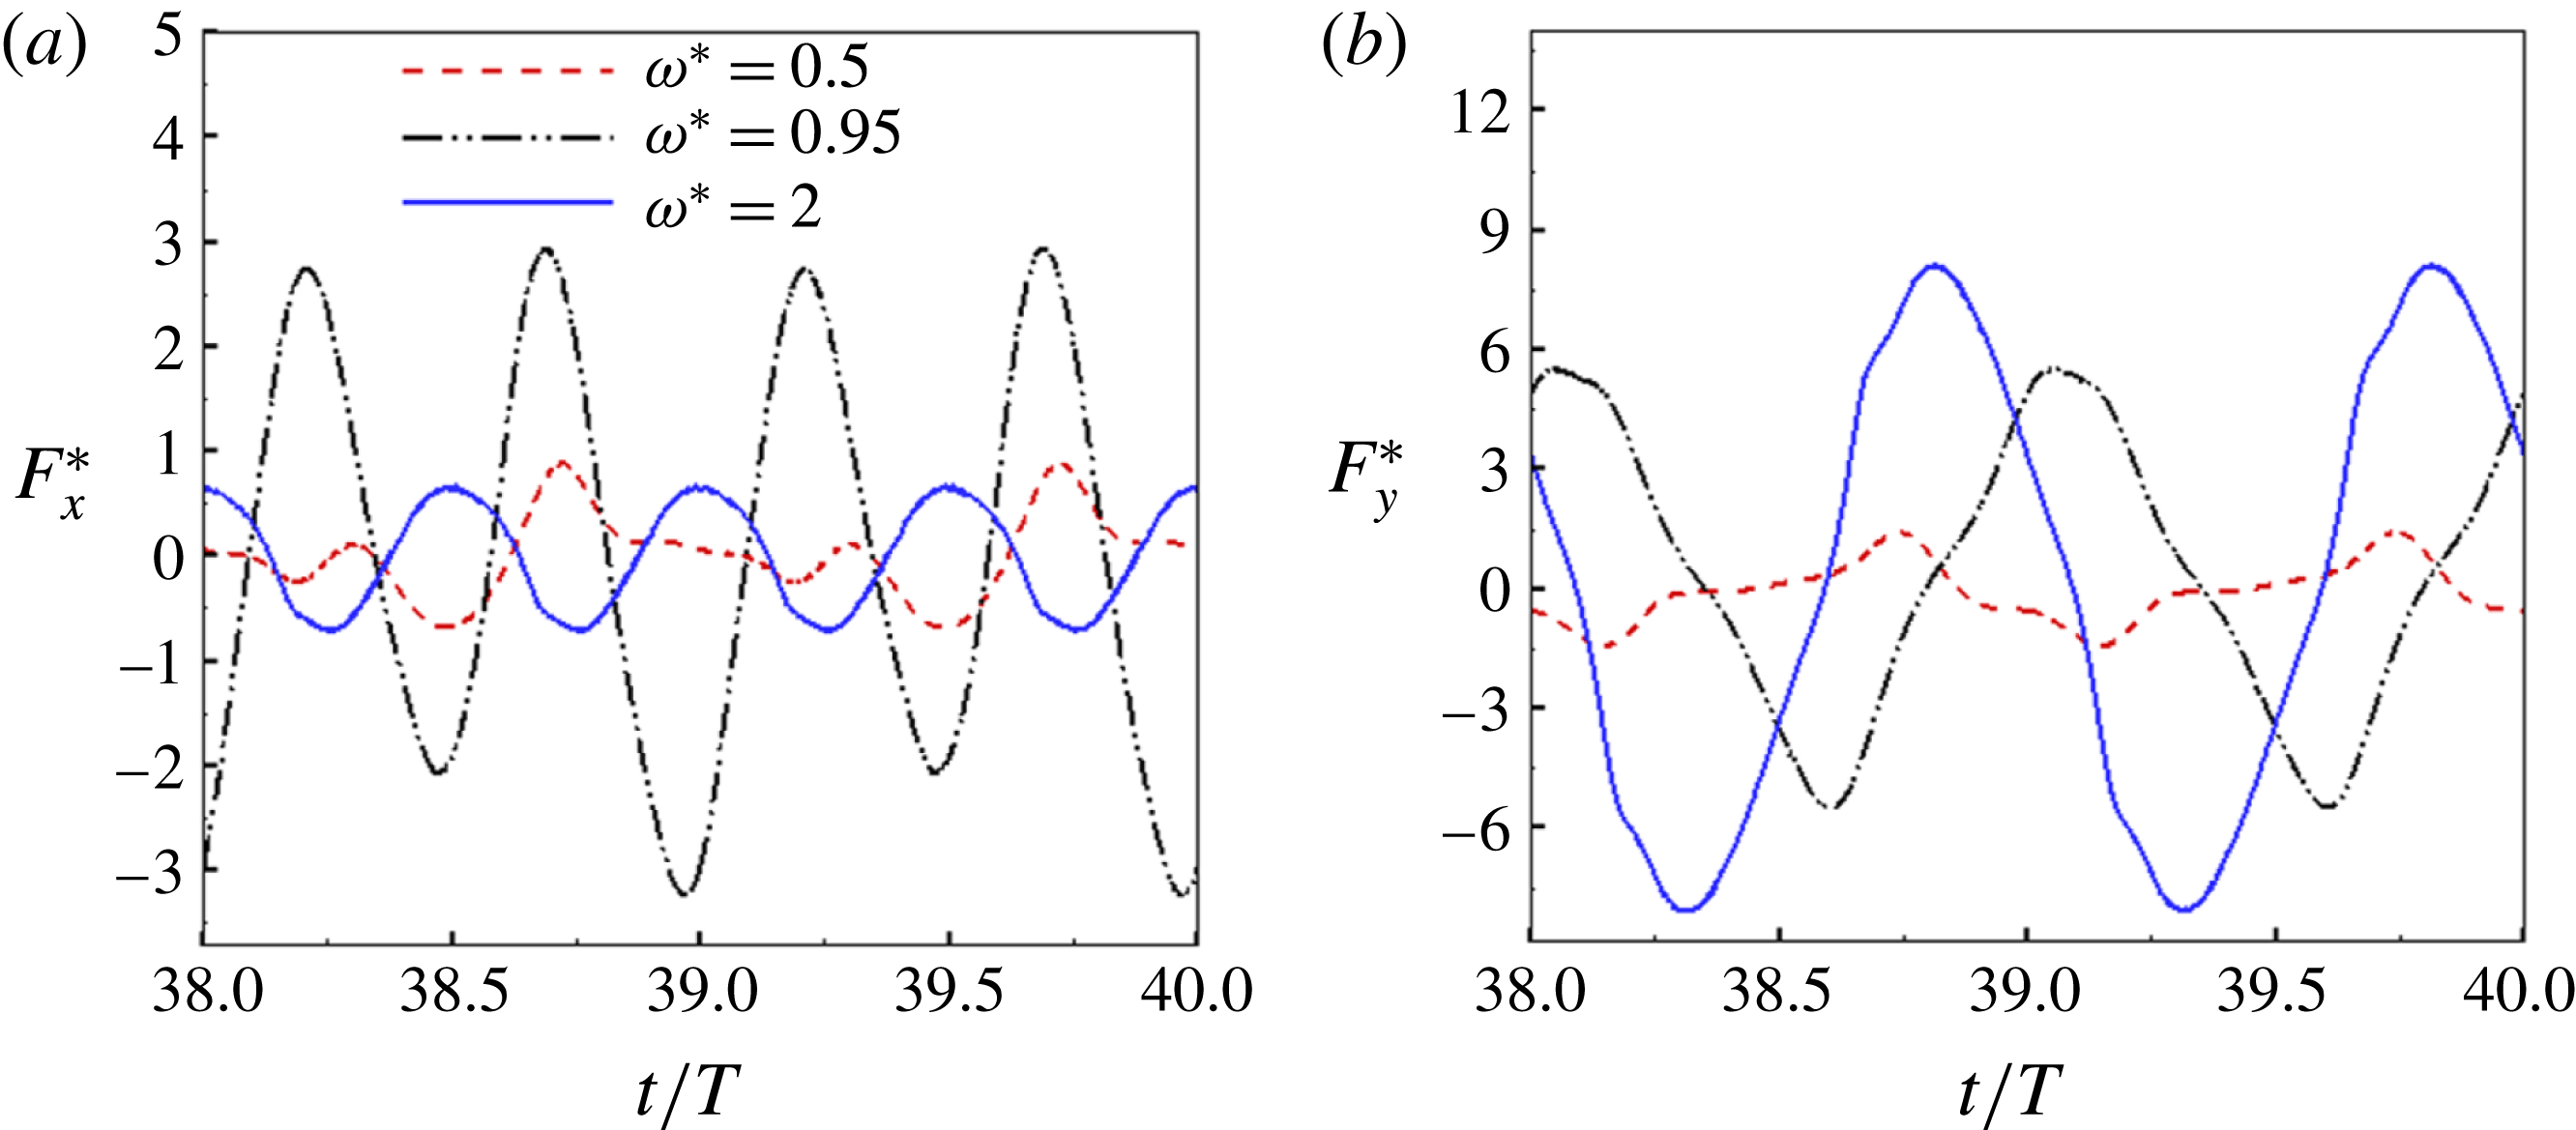
Another key observation regarding these wake patterns is the separation of vortex shedding, which increases with an increase in
 $\unicode[STIX]{x1D714}^{\ast }$
from 0.5 to 2. As stated earlier, the separation between vortices of opposite rotation is inversely proportional to the reduced frequency (
 $k$
) (where
 $k=\unicode[STIX]{x1D6FE}C/\bar{u}=St/2\unicode[STIX]{x1D6FD}$
) which is recorded to be 0.18, 0.64 and 1.38 for cases (a), (b) and (c), with reference to figure 21 respectively. Thus, the phenomenon of annihilation of vortices is much stronger for
 $\unicode[STIX]{x1D714}^{\ast }=0.5$
than for
 $\unicode[STIX]{x1D714}^{\ast }=2$
, which is why the vortex trail is missing or nearly absent in the former case (also indicative of low propulsion velocity). In addition, for
 $\unicode[STIX]{x1D714}^{\ast }=0.5$
the vortices formed at the leading edge are dissipated before merging downstream with the wake, unlike in cases (a) and (b). Thus, no contribution from the leading edge in the formation of the wake can be observed at
 $\unicode[STIX]{x1D714}^{\ast }=0.5$
.
4.3 Comparison with flying/swimming animals
Based upon the various system (or performance) parameters considered and derived, such as the frequency ratio
 $\unicode[STIX]{x1D714}^{\ast }$
, FSI index
 $\unicode[STIX]{x1D713}$
(or the phase difference between plunging and passive pitching
 $\unicode[STIX]{x1D719}$
) and Strouhal number
 $St$
, we now present their association with animal locomotion. With the help of morphological information of insects available in the literature, i.e. flapping frequency, flexural rigidity and mass loading of an insect wing, etc. their operating frequency ratios can be calculated. It was reported in the literature (Chen et al.
Reference Chen, Chen and Chou2008; Shyy et al.
Reference Shyy, Aono, Chimakurthi, Trizila, Kang, Cesnik and Liu2010, Reference Shyy, Aono, Kang and Liu2013) that the hawkmoth (Manduca sexta) and dragonfly (Orthetrum pruinosum and Orthetrum sabina) are two insect species whose passive pitching motions can be separately categorized into structural inertia dominated (
 $\unicode[STIX]{x1D713}\simeq 0.3$
) and aerodynamics dominated (
 $\unicode[STIX]{x1D713}\simeq 2$
), respectively. As stated earlier in this study, the frequency ratio for the optimum cruising velocity increases with an increase in
 $\unicode[STIX]{x1D713}$
. This finding is analogous to the flapping locomotion endowed by nature as the hawkmoth usually operates at a frequency ratio (
 $\unicode[STIX]{x1D714}^{\ast }\simeq 1.8{-}2.2$
), whereas the dragonfly has a plying frequency ratio (
 $\unicode[STIX]{x1D714}^{\ast }\simeq 4{-}5$
).
For the connections of phase difference, experimental investigation of a harmonically flapping foil mimicking the locomotion of the tail-fins of swimming animals (Anderson et al.
Reference Anderson, Streitlien, Barrett and Triantafyllou1998; Triantafyllou, Triantafyllou & Yue Reference Triantafyllou, Triantafyllou and Yue2000; Zhang et al.
Reference Zhang, Liu and Lu2010) showed that (
 $\unicode[STIX]{x1D719}$
) is approximately
 $75^{\circ }$
to obtain maximum propulsive performance. Moreover, the examination of kinematic data of the free flight of a dragonfly (Anax parthenope julius) and a damselfly (Ceriagrion melanurum) revealed that
 $\unicode[STIX]{x1D719}$
lies in the range
 $70^{\circ }{-}90^{\circ }$
(Azuma & Watanabe Reference Azuma and Watanabe1988; Zhao et al.
Reference Zhao, Huang, Deng and Sane2010) which can be considered as optimal in terms of energy requirements. This is also in conformity with the present study where we show that propulsive performance keeps increasing with an increase in the FSI index
 $\unicode[STIX]{x1D713}$
(or indirectly, an increase in the phase difference
 $\unicode[STIX]{x1D719}$
). The optimum cruising performance in this study was attained at
 $\unicode[STIX]{x1D713}=3$
(or a phase difference of approximately
 $\unicode[STIX]{x1D719}=\tan ^{-1}(3)=72^{\circ }$
analytically) with a numerically calculated phase difference of
 $75^{\circ }$
, and is consistent with the data of real insect flight. In addition, it was reported that
 $\unicode[STIX]{x1D719}$
increases from the base to the tip of dipteran (e.g. Eristalis tenax and Calliphora vicina) wings (Ennos Reference Ennos1989; Zhang et al.
Reference Zhang, Liu and Lu2010) and this occurrence also can be explained using the concept of FSI index. As the wing mass decreases from base to tip, aerodynamics dominates structural inertia and consequently
 $\unicode[STIX]{x1D713}$
is expected to increase in the spanwise direction and consequently
 $\unicode[STIX]{x1D719}$
follows likewise.
The association of Strouhal number with swimming and flapping animals is now discussed. Taylor et al. (Reference Taylor, Nudds and Thomas2003) studied the cruising conditions of 42 different species comprising birds, bats, insects, sharks, bony fish, dolphins, etc. and found that their corresponding Strouhal numbers varied between 0.15 and 0.5. Since 80 % of the species operated in the range of
 $0.2\leqslant St\leqslant 0.4$
, this was then chosen as the natural range for optimal performance or efficient flight of flying and swimming animals. However, the maximum cruising performance in this study (corresponding to different
 $\unicode[STIX]{x1D713}$
) was slightly off-range and varied in the range 0.15–0.35 (although this remains in the natural zone of flying animals). These numbers are in excellent agreement with the slight shift in the optimum zone of performance reported by Zhang et al. (Reference Zhang, Liu and Lu2010) and Hua et al. (Reference Hua, Zhu and Lu2013). An illustration of the relationship between Strouhal number
 $St$
and frequency ratio
 $\unicode[STIX]{x1D714}^{\ast }$
for different
 $Re_{f}$
and
 $\unicode[STIX]{x1D713}$
is shown in figure 23. (Reynolds number of insects is typically defined using the maximum flapping speed (i.e.
 $V=2\unicode[STIX]{x03C0}A\unicode[STIX]{x1D6FE}$
). However, for the sake of comparison with earlier studies,
 $V/(2\unicode[STIX]{x03C0})$
was chosen as the characteristic velocity for defining
 $Re_{f}$
. Moreover, the flight characteristics of a self-propelled wing is quantified by translational Reynolds number
 $Re_{u}$
and is essentially used for describing insect flight (where
 $Re_{u}=2Re_{f}/St$
, and is
 $O\sim (10^{2}{-}10^{4})$
in the present study).) The resultant Strouhal number falling into the operating range of swimming and flying animals is nevertheless interesting and follows naturally in this work. As shown in figure 23, our results demonstrate that the conditions for which the Strouhal number lies outside this range are
 $\unicode[STIX]{x1D714}^{\ast }\leqslant 1.5$
and
 $\unicode[STIX]{x1D714}^{\ast }\geqslant 8$
, respectively. This leads to the inference that neither very flexible nor very rigid wings fall under the natural flying conditions. As far as efficient locomotion is concerned, there may be a physical mechanism in which the dynamics is tuned to cruising at a speed of optimal propulsion. These interesting and important topics will be addressed in the future.
Strouhal number as a function of frequency ratio for different combinations of
 $Re_{f}$
and
 $\unicode[STIX]{x1D713}$
. The section between
 $St=0.2$
and
 $St=0.4$
characterizes the operational zone of flying and swimming animals. The vertical dashed lines represent the plying frequency range of the hawkmoth (
 $\unicode[STIX]{x1D713}\simeq 0.3$
) and dragonfly (
 $\unicode[STIX]{x1D713}\simeq 2$
).
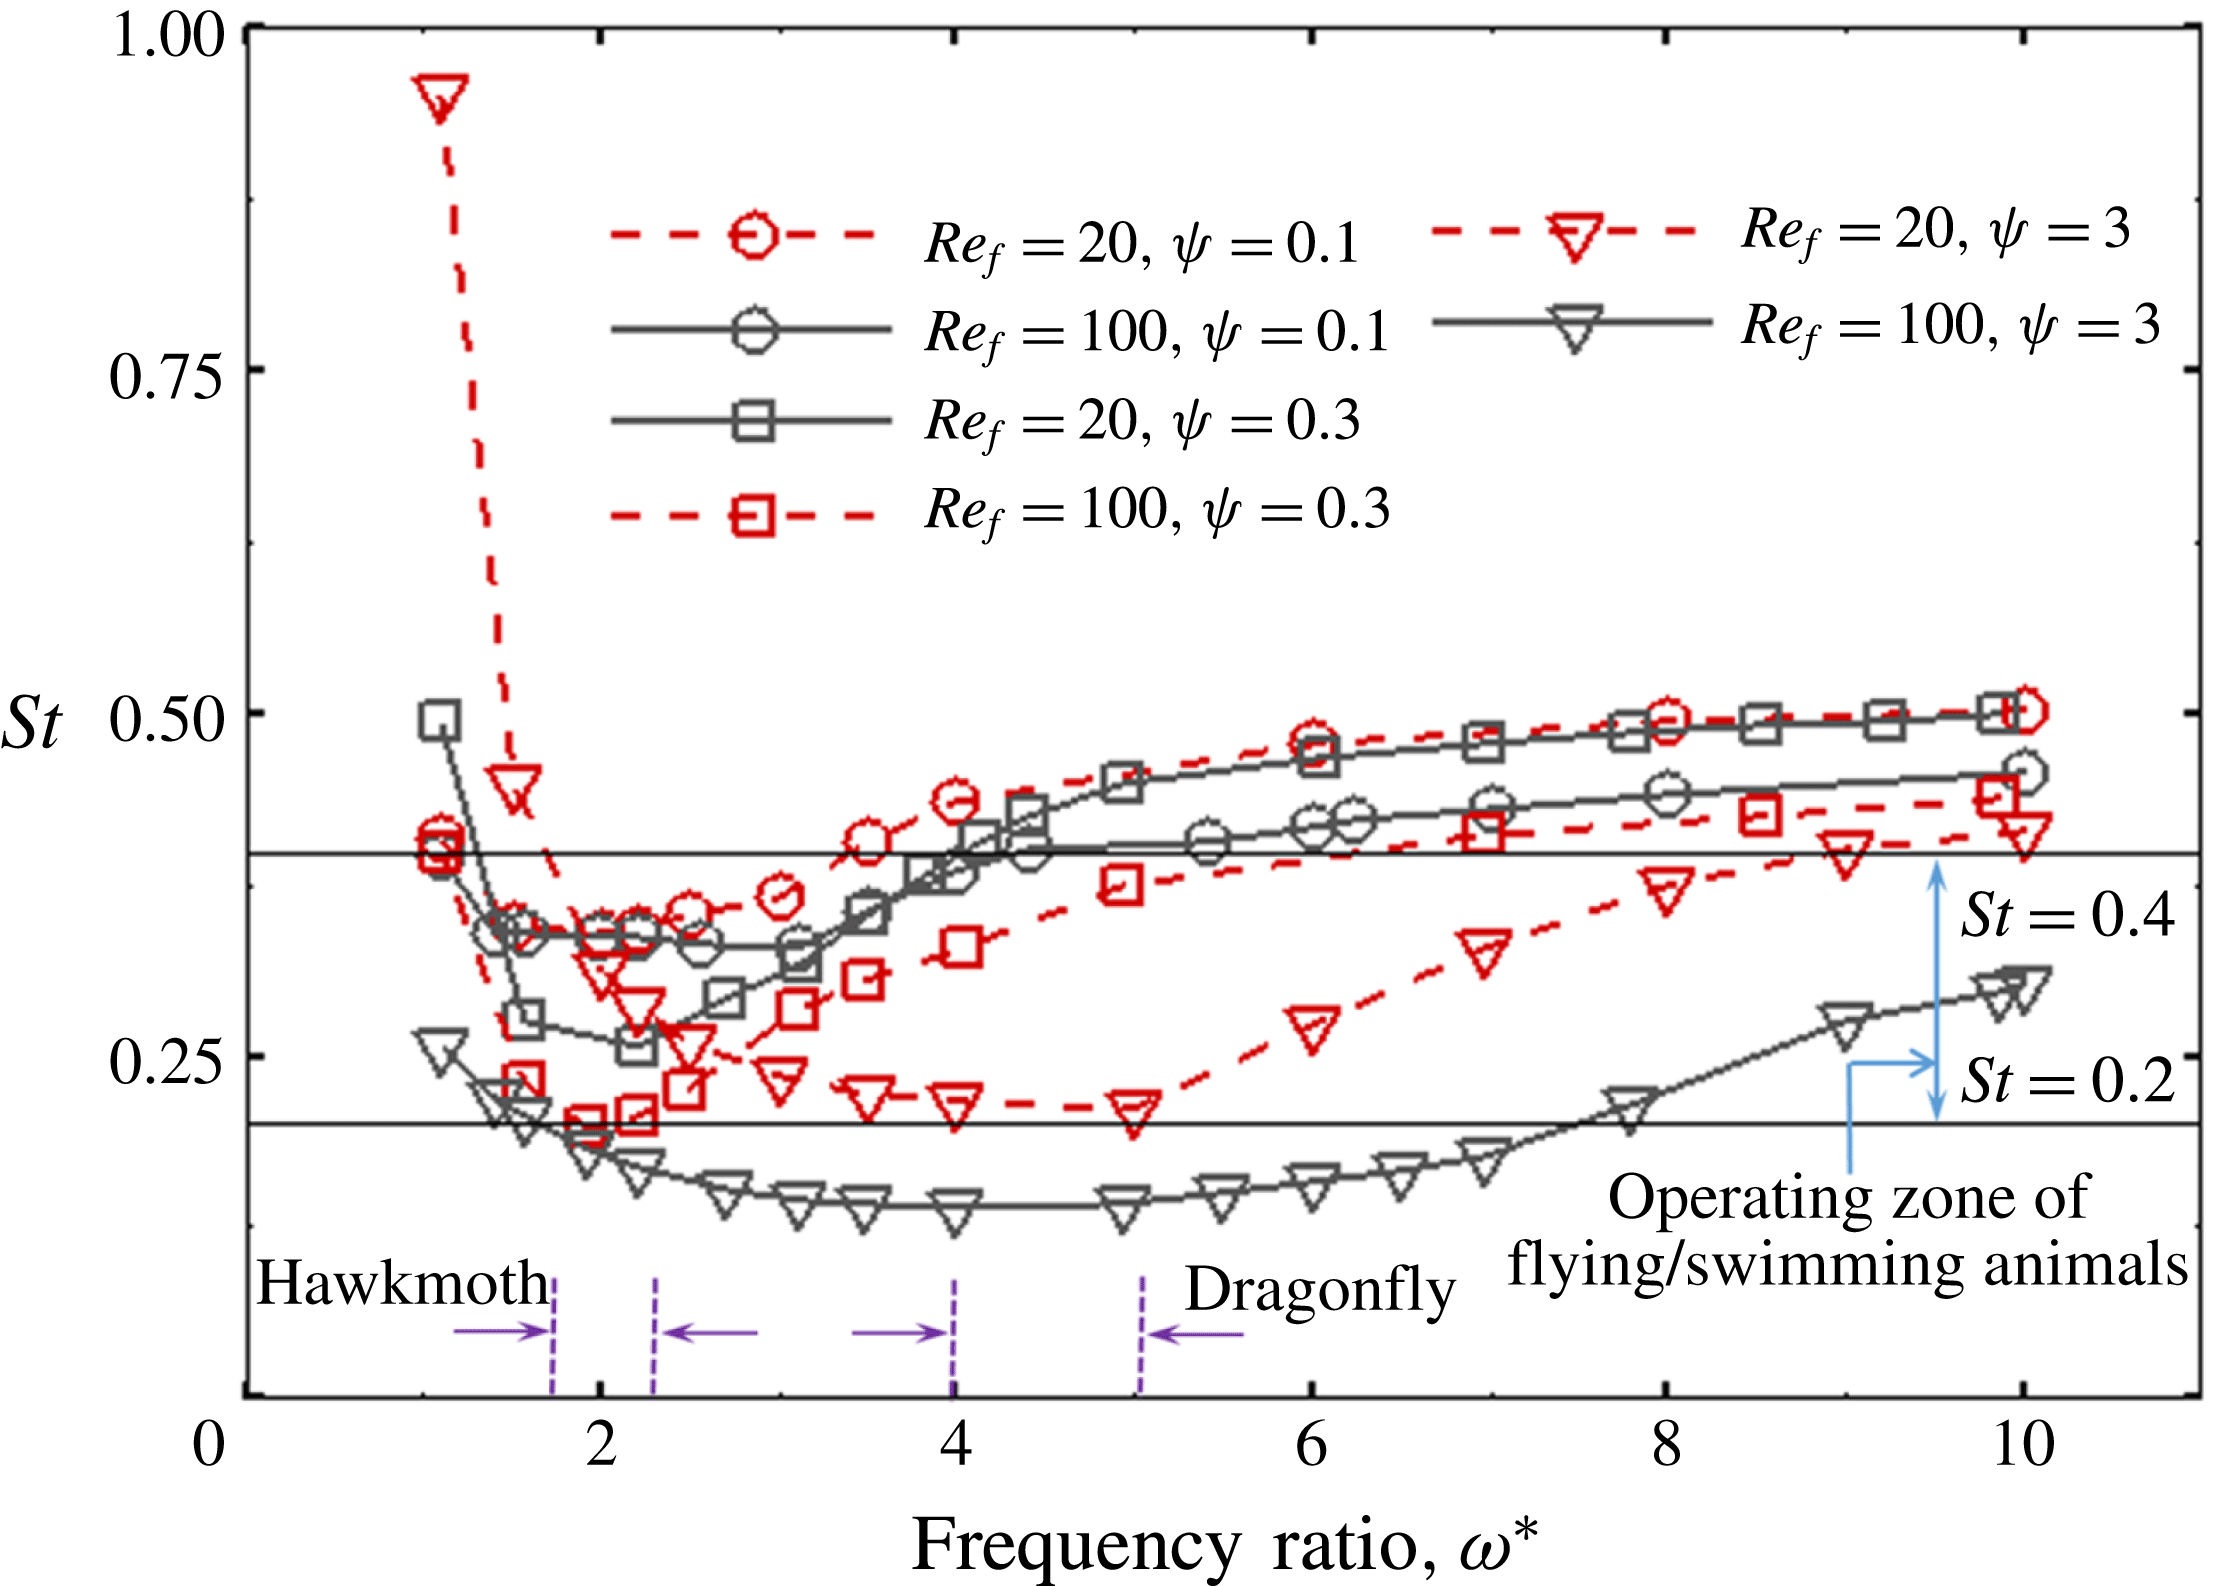
5 Conclusions
This work was directed towards understanding the role of passive flexion for a plunging plate leading to thrust generation and transverse locomotion. To mimic a real flapping insect wing, a fluid–structure interaction framework based upon a generalized two-dimensional lumped-torsional flexibility model for a multi-component system was developed. The method involved two separate solvers, i.e. fluid and structure, which together determined the system dynamics. Flexibility was implemented in a discrete sense at a finite number of locations along the length of the plate with intermediate rigid sections connected to each other through torsion springs.
A phenomenological solution to the simplified single-spring structural dynamics equation was established which revealed that the dynamics of deformation is governed by a balance between structural inertia, stiffness and aerodynamics. The semi-analytical solution revealed that the ratio of aerodynamics to structural inertia (defined as dimensionless parameter, the FSI index
 $\unicode[STIX]{x1D713}=\unicode[STIX]{x1D6FD}/\unicode[STIX]{x1D70C}^{\ast }\unicode[STIX]{x1D6FF}$
) has an impact on the induced phase difference (
 $\unicode[STIX]{x1D719}$
) between plunging and passive pitching for the large amplitude considered. Quantitative evidence for this outcome was obtained by conducting numerical simulations with the multi-link model to examine the effect of flexibility on the cruising velocity and performance at different
 $Re_{f}$
and
 $\unicode[STIX]{x1D713}$
. For the high plunging amplitudes considered, pitching and plunging were shown to be in phase (
 $\unicode[STIX]{x1D719}\simeq 0$
) for structural inertia dominated flows (
 $\unicode[STIX]{x1D713}\ll 1$
). This was due to the structural inertia attaining a peak value at the stroke reversals. On the other hand, for aerodynamics dominated (
 $\unicode[STIX]{x1D713}>1$
) scenarios, a phase difference of
 $\unicode[STIX]{x1D719}\approx \unicode[STIX]{x03C0}/2$
was induced owing to the fluid forces becoming maximum at mid-stroke. Moreover, such flows were shown to result in larger passive deformation than the structural inertia dominated scenarios. Although the phase difference was independent of the frequency ratio, unit frequency ratio acted as the point of discontinuity and the phase difference shifted by
 $\unicode[STIX]{x03C0}$
near
 $\unicode[STIX]{x1D714}^{\ast }=1$
.
It was shown that there exists an optimum flexibility at which the cruising velocity is maximized and the location of the optimum varied with
 $Re_{f}$
and
 $\unicode[STIX]{x1D713}$
at
 $\unicode[STIX]{x1D6FD}=0.6$
. Simulations demonstrated that different bending patterns are exhibited by the plunging wing for
 $\unicode[STIX]{x1D713}\ll 1$
and
 $\unicode[STIX]{x1D713}>1$
when the plate propelled with the maximum velocity. The main difference between the two structural modes was that the maximum deflection of the wing happened to occur at the middle of the stroke for the latter, whereas it was at the end of the stroke for the former case. The difference in bending patterns was solely due to inertia dominating over aerodynamics for
 $\unicode[STIX]{x1D70C}^{\ast }\unicode[STIX]{x1D6FF}\geqslant 2$
flows and is the key finding of this work. With an increase in
 $\unicode[STIX]{x1D713}$
, the optimum shifted away from unit frequency ratio and was also accompanied by an increase in cruising velocity and decrease in input power, indicating the importance of aerodynamics over structural inertia dominated deformation scenarios as the former delivered better performance in terms of mileage or distance travelled per unit work. Concurrently, the instantaneous shape of the wing suggested that the wing responded quickly during stroke reversals with an increase of
 $\unicode[STIX]{x1D713}$
. This was shown to result in a phase difference between plunging and pitching, as also predicted by the phenomenological solution. Thus, the wing shape became aligned in compliance with the ideal streamlined flapping, maximized thrust and minimized drag indicating the dominance of aerodynamics over structural inertia led deformations. Further, for a given
 $\unicode[STIX]{x1D713}$
, a higher relative tip displacement was indicative of a higher velocity, until a maximum in the latter was reached. Any further increase in the relative tip displacement results in a decrease in the transverse velocity. More importantly, the maximum velocity was shown to occur not at unit frequency ratio, but rather at the condition when the relative tip displacement
 ${\approx}\,0.3$
. In addition, the effect of structural resonance was investigated and it was shown that even though the maximum thrust occurred near unit frequency ratio, it could not be transformed into the highest terminal velocity. Also, unit frequency ratio served as the point of transition in the direction of locomotion which changed from forward (
 $\unicode[STIX]{x1D714}^{\ast }>1$
) to backward (
 $\unicode[STIX]{x1D714}^{\ast }<1$
) accompanied by a deflected wake. This phenomenon was in agreement with the phenomenological solution as the change in direction of motion was due to the sudden shift in phase difference from
 $\unicode[STIX]{x1D719}\simeq 0$
to
 $\unicode[STIX]{x1D719}\simeq \unicode[STIX]{x03C0}$
. Strong connections are observed between the results inferred from this study and real flying/swimming flight that provide an understanding of the flapping locomotion principles prevalent in nature. Future work is directed towards the extension to a three-dimensional FSI model and investigation of the role of tip vortices and their interaction with LEVs in influencing the propulsion characteristics of flexible plates.
Acknowledgements
N.A. and A.G. acknowledge the financial support received from the Aeronautics Research and Development Board (ARDB) under SIGMA project no. 1705. C.-K.K. is in part supported by NSF CMMI-1761618. The authors are grateful to Professor S. Sane for his insightful suggestions and thank the IIT Delhi HPC facility for computational resources.
Appendix A
A.1 Maximum angular deflection and phase difference as a function of
$\unicode[STIX]{x1D713}$
and
$\unicode[STIX]{x1D714}^{\ast }$


Figure 24 shows the empirically derived maximum angular deflection
 $\unicode[STIX]{x1D6FC}_{0}$
and phase difference
 $\unicode[STIX]{x1D719}$
(inset) as a function of
 $\unicode[STIX]{x1D714}^{\ast }$
and
 $\unicode[STIX]{x1D713}$
. It is observed from this figure that unit frequency ratio acts as the point of discontinuity. Thus for
 $\unicode[STIX]{x1D714}^{\ast }>1$
, the initial phase difference between passive pitching
 $\unicode[STIX]{x1D6FC}$
and plunging displacement
 $Y$
is shifted by
 $\unicode[STIX]{x03C0}$
for
 $\unicode[STIX]{x1D714}^{\ast }<1$
(inset). The consequence of this phenomenon on propulsion performance can be seen in § 4.2.4. Further, an increase in
 $\unicode[STIX]{x1D719}$
with increase in
 $\unicode[STIX]{x1D713}$
is due to the dominating effect of aerodynamics over structural inertia. As argued, figure 24 shows that with negligible aerodynamic forces (i.e.
 $\unicode[STIX]{x1D713}\simeq 0$
) the phase difference
 $\unicode[STIX]{x1D719}$
diminishes to zero. Moreover, when aerodynamics dominates (
 $\unicode[STIX]{x1D713}\simeq 10$
), the phase difference between plunging and pitching
 $\unicode[STIX]{x1D719}\rightarrow \unicode[STIX]{x03C0}/2$
. This occurrence is also endorsed by Moore (Reference Moore2014), where peaks in thrust were accompanied by maximum trailing-edge displacement and a phase difference of
 $\unicode[STIX]{x03C0}/2$
between pitching and heaving for massless wings (or
 $\unicode[STIX]{x1D713}\rightarrow \infty$
).
The variation in
 $\unicode[STIX]{x1D6FC}_{0}$
with
 $\unicode[STIX]{x1D713}$
also signifies the amplification in passive pitching due to the presence of surrounding fluid or the magnification factor (MF) in pitching, i.e. ratio of the amplitude of angular deflection if the heaving was performed in a fluid to that if it was carried out in a vacuum. As is evident, at a given
 $\unicode[STIX]{x1D714}^{\ast }$
, pressure dominated flows (
 $\unicode[STIX]{x1D713}>1$
) cause larger passive deformations than structural inertia dominated flows (
 $\unicode[STIX]{x1D713}<1$
). The fact that the magnification factor keeps increasing with an increase in
 $\unicode[STIX]{x1D713}$
clearly indicates the dominating effect of aerodynamics over structural inertia in deforming the wing. However, for a fixed
 $\unicode[STIX]{x1D713}$
, an insignificant variation in the magnification factor is witnessed with a decrease in
 $\unicode[STIX]{x1D714}^{\ast }$
, except near or while approaching the point of discontinuity at
 $\unicode[STIX]{x1D714}^{\ast }=1$
where
 $\unicode[STIX]{x1D6FC}_{0}$
and MF
 $\rightarrow \infty$
.
A.2 Two-component wing set-up
The matrices for a two-component system are given below:
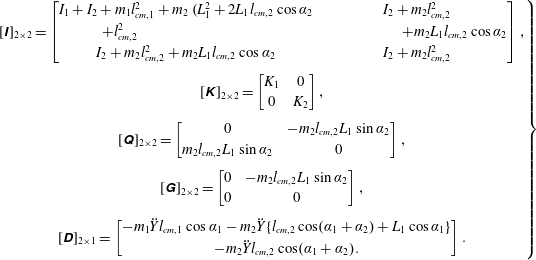 $$\begin{eqnarray}\hspace{-8.39996pt}\left.\begin{array}{@{}c@{}}\displaystyle [\unicode[STIX]{x1D644}]_{2\times 2}=\left[\begin{array}{@{}cc@{}}I_{1}+I_{2}+m_{1}l_{cm,1}^{2}+m_{2} (\!L_{1}^{2}+2L_{1}l_{cm,2}\cos \unicode[STIX]{x1D6FC}_{2} & I_{2}+m_{2}l_{cm,2}^{2}\\ \hspace{-96.0pt}+l_{cm,2}^{2} & \hspace{54.0pt}+m_{2}L_{1}l_{cm,2}\cos \unicode[STIX]{x1D6FC}_{2}\\ I_{2}+m_{2}l_{cm,2}^{2}+m_{2}L_{1}l_{cm,2}\cos \unicode[STIX]{x1D6FC}_{2} & I_{2}+m_{2}l_{cm,2}^{2}\end{array}\right],\\ \displaystyle [\unicode[STIX]{x1D646}]_{2\times 2}=\left[\begin{array}{@{}cc@{}}K_{1} & 0\\ 0 & K_{2}\end{array}\right],\\ \displaystyle [\unicode[STIX]{x1D64C}]_{2\times 2}=\left[\begin{array}{@{}cc@{}}0 & -m_{2}l_{cm,2}L_{1}\sin \unicode[STIX]{x1D6FC}_{2}\\ m_{2}l_{cm,2}L_{1}\sin \unicode[STIX]{x1D6FC}_{2} & 0\end{array}\right],\\ \displaystyle [\unicode[STIX]{x1D642}]_{2\times 2}=\left[\begin{array}{@{}cc@{}}0 & -m_{2}l_{cm,2}L_{1}\sin \unicode[STIX]{x1D6FC}_{2}\\ 0 & 0\end{array}\right],\\ \displaystyle [\unicode[STIX]{x1D63F}]_{2\times 1}=\left[\begin{array}{@{}c@{}}-m_{1}\ddot{Y} l_{cm,1}\cos \unicode[STIX]{x1D6FC}_{1}-m_{2}\ddot{Y} \{l_{cm,2}\cos (\unicode[STIX]{x1D6FC}_{1}+\unicode[STIX]{x1D6FC}_{2})+L_{1}\cos \unicode[STIX]{x1D6FC}_{1}\}\\ -m_{2}\ddot{Y} l_{cm,2}\cos (\unicode[STIX]{x1D6FC}_{1}+\unicode[STIX]{x1D6FC}_{2}).\end{array}\right].\end{array}\right\}\end{eqnarray}$$
Here
 $I_{1}$
and
 $I_{2}$
are the mass moments of inertia about the centre of mass of the first and second linkage, respectively.
Phenomenological solution of phase difference
 $\unicode[STIX]{x1D719}$
(inset) and maximum angular deflection
 $\unicode[STIX]{x1D6FC}_{0}$
or magnification factor (MF) as a function of frequency ratio (
 $\unicode[STIX]{x1D714}^{\ast }$
) at different aerodynamics to structural inertia ratios (
 $\unicode[STIX]{x1D713}$
).