Implications
Carotenoid pigments are involved in the color and nutritional characteristics of herbivore carcasses and are potential biomarkers for authenticating carcasses produced from animals fed green forage-based diets. However, the latency of appearance of carotenoid pigments in plasma and fat remains unknown. This study investigated the pattern of plasma carotenoid concentration in lambs switched from a low to a high dietary carotenoid level.
Introduction
Carotenoid pigments are involved in the color and nutritional characteristics of herbivore carcasses (Prache et al., Reference Prache, Aurousseau, Thériez and Renerre1990) and are potential biomarkers for authenticating carcasses produced from animals fed green forage-based diets (Prache and Theriez, Reference Prache and Theriez1999; Serrano et al., Reference Serrano, Prache, Chauveau-Duriot, Agabriel and Micol2006; Dian et al., Reference Dian, Andueza, Barbosa, Amoureux, Jestin, Carvalho, Prado and Prache2007a). However, although carotenoid persistence has been studied in both lamb plasma and fat (Prache et al., Reference Prache, Priolo and Grolier2003a and Reference Prache, Priolo and Grolier2003b), their latency of appearance has received less attention. The aim of this study was therefore to describe and model lamb plasma carotenoid concentration (PCC) pattern in lambs switched from a low to a high dietary carotenoid level.
Material and methods
The Herbivore Research Unit conducted the experiment at the INRA's Clermont-Ferrand Research Centre, France. The animals were handled by specialized personnel who cared for their welfare in accordance with the European Union Directive No. 609/1986.
Experimental design, animals and diets
A total of 12 Romane lambs (eight male and four female) were individually penned indoors for 38 days. They were fed a low dietary carotenoid level for 23 days (period 1) followed by a shift to a high dietary carotenoid level for 15 days (period 2).
The lambs were born between 9 and 15 August 2010. They were offered a commercial concentrate containing no green vegetative matter ad libitum from 3 weeks of age until the beginning of period 1. The dams were also kept indoors and received a commercial concentrate containing no green vegetative matter and were offered ad libitum access to hay. The lambs were progressively weaned from 26 October, and then individually penned indoors.
Mean lamb birth weight (BW) and average daily gain (ADG) between birth and the beginning of period 1 was 4.1 kg (s.d. 0.71) and 269 g/day (s.d. 55), respectively. At the beginning of period 1, lambs averaged 12 weeks of age and weighed 28.1 kg (s.d. 2.1). At the beginning of period 2, lambs weighed on average 29.9 kg (s.d. 2.7).
During period 1, the lambs were fed daily an average 0.625 kg dry matter (DM) of a commercial concentrate containing no green vegetative matter and 0.181 kg DM of corn straw. The concentrate composition (on an as-fed basis) was: barley 30%, corn 23%, sugar beet pulp 14%, rapeseed meal 11%, sunflower meal 8%, plus wheat gluten feed, wheat bran, corn, sugarcane molasses, premix additives, palm oil, calcium carbonate and salt.
During period 2, the lambs were fed daily 0.558 kg DM alfalfa pellets, 0.181 kg DM straw and on average 0.181 kg DM (s.d. 0.128) barley. Barley supplement was adjusted up or down for each lamb as needed to regulate lamb growth rate with the aim of avoiding the mobilization of body fat.
The feeds were offered each morning. Feed tubs were emptied every 3 to 4 days and refusals were weighed, recorded and discarded. Samples of offered feeds were collected twice weekly for estimations of DM and carotenoid concentration.
Water and salt blocks were always available. The salt blocks contained (g/kg; as-fed) 60 Ca, 20 P, 10 Mg, 280 Na, 17.5 Zn, 1.5 Fe, 5.5 Mn, 0.03 Co, 0.03 I and 0.01 Se.
Measurements
Animal characteristics
Lambs were weighed once weekly.
Carotenoid concentration in feed
Carotenoids of concentrate, alfalfa, straw and barley were extracted using the procedure described in Cardinault et al. (Reference Cardinault, Doreau, Poncet and Nozière2006). Lipophilic components of 50 mg of lyophilized and ground food were first extracted with acetone and then purified with diethyl ether containing echinenone kindly donated by Hoffman La Roche (Basel, Switzerland) as the internal standard. After saponification and cleaning with water, the carotenoids were then analyzed by HPLC using the method described in Lyan et al. (Reference Lyan, Azaïs-Braesco, Cardinault, Tyssandier, Borel, Alexandre-Gouabau and Grolier2001). The HPLC apparatus consisted of a Waters Alliance 2996 HPLC system (Waters S.A., Saint-Quentin-en-Yvelines, France) with a photodiode array detector monitoring between 280 and 600 nm. Carotenoids were separated on a 150 × 4.6 mm, RP C18, 3 μm Nucleosil column coupled with a 250 × 4.6 mm, RP C18, 5 μm Vydac TP 54 column (Interchim, Montluçon, France). Millennium 32 software from Waters S.A. (Saint-Quentin-en-Yvelines, France) was used for instrument control, data acquisition and data processing. Wavelength for carotenoid detection was 450 nm, and the compounds were identified by comparing retention times and spectral analyses with those of pure standards (>95% of zeaxanthin, 9-cis and 13-cis β-carotene), kindly donated by Hoffman La Roche, and all-trans β-carotene and lutein (Sigma Chemical Co., St. Louis, MO, USA). Concentrations of each compound were calculated using external standard curves and then adjusted by percent recovery of the added internal standard.
Plasma carotenoid concentration
PCC was measured daily in period 2. Blood samples were taken from the jugular vein (lithium heparin purchased from Consortium de Materiel pour Laboratoires, Nemours, France) of each lamb at 0800 h, that is, before the diet was offered. Plasma was stored at −20°C until assay. Carotenoid extraction from plasma was performed within 3 months after sampling.
Crude estimation of total carotenoids was obtained using a spectrophotometric procedure as follows: protein from 3 ml of plasma diluted with 2 ml of distilled water was precipitated with 4 ml of ethanol. Carotenoids were then extracted with 4 ml of hexane. Absorption of the upper layer obtained after centrifugation at 5000 × g for 5 min was measured between 600 and 400 nm using a Kontron Uvikon 860 recording spectrophotometer (Kontron Instruments S.A., Montigny-le-Bretonneux, France). The concentration of total carotenoids was calculated from maximum absorption as described in Prache et al. (Reference Prache, Priolo and Grolier2003a). Throughout the experimental and analytical procedure, the samples were protected from natural light.
Statistical analysis
PCC was subjected to ANOVA using the GLM procedure of SAS to examine the effect of animal and time elapsed since the beginning of alfalfa distribution, and Duncan's contrast procedure was used for pairwise comparisons between days. PCC variance was stabilized by natural logarithmic transformation beforehand. We modeled the change in PCC with time elapsed since the beginning of alfalfa distribution using a monomolecular function; the models were developed with the raw data and the parameters were estimated using the NLIN procedure of SAS.
Results
During period 2, lambs gained 2.1 kg live weight on average (from 0.9 to 3.1 kg).
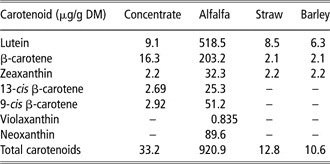
Concentrate, alfalfa pellets, straw and barley contained 882, 920, 923 and 882 g DM/kg and 33.2, 920.9, 12.8 and 10.6 μg carotenoid pigments/g DM, respectively (Table 1).
Carotenoid concentration (μg/g DM) of the feed offered

DM = dry matter.
In period 2, daily DM intake averaged 0.519, 0.197 and 0.211 kg for alfalfa, straw and barley, respectively. Alfalfa refusals were null for 53% of refusal weighings and less than 0.04 kg DM for 79% of refusal weighings.
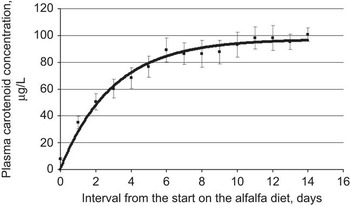
PCC varied with animal (P < 0.001) and with time elapsed since the beginning of alfalfa distribution (P < 0.001). Mean PCC was 8 μg/l (s.d. 3.3) before the beginning of alfalfa consumption. Mean PCC then increased curvilinearly with time elapsed since the beginning of alfalfa distribution (Figure 1). As early as 24 h on the alfalfa diet, PCC was higher than before the switch (P < 0.01). Mean PCC rose until day 6 and then reached a plateau from day 6 onwards. Mean PCC pattern was adjusted to a monomolecular function: PCC = a × (1−exp(−b×d)) (equation 1), with d being the interval elapsed since the beginning of alfalfa distribution (day), and where the a and a × b values give the asymptote and the baseline slope, respectively. The key equation on the mean PCC data was

where r 2 = 0.997, r.s.d. = 4.47, n = 15 and d = day.
Mean plasma carotenoid concentration (PCC) of lambs fed alfalfa pellets in relation to the interval from the start of the alfalfa diet. Bars represent s.e. Pairwise comparisons of PCC among days yielded the following results: d0 < d1 to 14 (P < 0.01); d1 < d2 to14 (P < 0.01); d2 = d3 (P > 0.05); d2 < d4 to 14 (P < 0.01); d3 = d4 (P > 0.05); d3 < d5 (P < 0.05); d3 < d6 to 14 (P < 0.01); d4 = d5 (P > 0.05); d4 < d6 to 9 (P < 0.05); d4 < d10 to 14 (P < 0.01); d5 = d6 to 10 (P > 0.05); d5 < d11 to 14 (P < 0.05); d6 = d7 to 14 (P > 0.05).

The asymptote and the baseline slope of the model obtained on the mean data were therefore 97 and 32.77 μg/l per day, respectively.
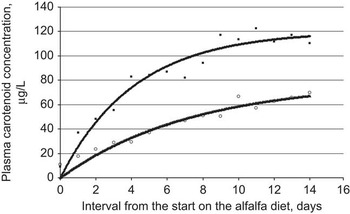
PCC also varied with animal (P < 0.001), as illustrated in Figure 2, which shows the PCC pattern for two lambs: one having a high value of the asymptote of the monomolecular model and the other a low value of the asymptote. When considering data for each individual lamb, the percentage of variance explained by the model ranged between 95.9% and 99.2%. Parameter a (i.e. asymptote) ranged between 73 and 151 μg/l, and parameter b ranged between 0.1350 and 0.6556 depending on the animal. Consequently, the baseline slope ranged between 10.7 and 74.5 μg/l per day. None of the equation 1 parameters were related to lamb live weight at the beginning of alfalfa consumption or ADG during the period of alfalfa consumption.
Plasma carotenoid concentration (PCC) of two lambs fed alfalfa pellets in relation to the interval from the start of the alfalfa diet. Solid and open symbols represent data from one lamb having a high value of the asymptote of the monomolecular model and from one lamb having a low value of the asymptote of the monomolecular model, respectively. Curvilinear equations: (i) solid symbols: PCC = 120 (s.e. 6.1) × (1−exp(−0.2388 (s.e. 0.0351)×d)), where r 2 = 0.992; r.s.d. = 8.64, n = 15 and d = day; (ii) open symbols: PCC = 79 (s.e. 8.5) × (1−exp(−0.1350 (s.e. 0.0286)×d)), where r 2 = 0.999; r.s.d. = 5.15, n = 15 and d = day.

Six lambs had low values for the asymptote, ranging from 73 to 86 μg/l (low asymptote group), whereas six lambs had high values for the asymptote, ranging from 110 to 151 μg/l (high asymptote group). PCC reached the plateau from day 6 and from day 7 onwards for the low and the high asymptote groups, respectively.
Discussion
As the objective was to describe the PCC pattern in lambs shifting from a low to a high dietary carotenoid level, it was not possible to arrange for an adaptation period before commencement of the alfalfa distribution. Consequently, although most of the lambs consumed all the alfalfa pellets offered as early as the beginning of period 2, few lambs did not consume all the alfalfa pellets offered. However, the difference between the mean actual (0.520 kg DM/day) and the mean assigned (0.557 kg DM/day) levels was low.
The main results of this study are that (i) the latency of appearance of carotenoid pigments in plasma is short, (ii) the PCC increases with the interval from the start of the administration of the alfalfa diet up to day 6, after which a plateau is reached and (iii) the kinetic pattern fits a monomolecular model. The outcome of these results is in line with the persistence pattern of plasma carotenoids after a switch from a high to a low dietary carotenoid level (Prache et al., Reference Prache, Priolo and Grolier2003a).
Despite similar carotenoid intake levels for all lambs, the PCC pattern showed high interindividual variability. At the time the plateau was reached, PCC varied from 47 to 146 μg/l, depending on the animal. This large individual variability is in line with previous studies (Dian et al., Reference Dian, Chauveau-Duriot, Prado and Prache2007b) and it could be related to variations in absorption and metabolism. However, all the individual data fitted a monomolecular model and the time elapsed before reaching the plateau was only slightly higher for the six lambs having a high asymptote of the model than for the six lambs having a low value of the asymptote.
In this study, carotenoid intake levels were high and steady throughout period 2. However, the PCC pattern may vary with both carotenoid intake level and its variability, and therefore with both forage carotenoid concentration and level of forage intake. At pasture, particularly, these characteristics may vary greatly according to the animal and the vegetation characteristics together with pasture and animal management. Further evaluations are therefore required to gauge the extent to which PCC pattern may be affected by both forage carotenoid concentration and level of forage intake.
Conclusions
This study demonstrated that the latency of appearance of carotenoid pigments in the blood of lambs switched from a low to a high dietary carotenoid level is low: PCC was increased as early as 24 h after the switch. PCC then further increased until reaching a plateau from on average 6 days on the alfalfa diet and onwards. We propose a monomolecular function to model this curvilinear pattern. The parameters of the model varied among animals, confirming the high interindividual variability in animal response. The plateau for PCC was reached slightly earlier for the six lambs having the lowest values of the asymptote than for the six lambs having the highest values of the asymptote.
Acknowledgments
We thank M. Bernard, F. Anglard, C. Rougheol, J. Pourrat and all the staff of the INRA Theix experimental farm for their collaboration. We thank B. Chauveau-Duriot for analysis of the carotenoid concentrations in the feed. L. de Oliveira is grateful to the Brazilian Ministry of Education ‘Coordenação de Aperfeiçoamento de Pessoal de Nível Superior’ (CAPES) for providing financial assistance via CAPES/COFECUB Project 684/10.