I. INTRODUCTION
The study and modeling of electronic structure of an individual molecule or the group of molecules for the purpose of understanding their quantum performance at nanometer-scale has generated extensive scientific inquiry among the researchers after noble laureate Richard P. Feynman delivered his lecture of “There is plenty of room at bottom”. Reference Feynman1 Critical to study of quantum transport properties of the nano-devices is the deeper understanding into the electronic structure of molecule, as well as of the contacts along with their properties at the interface. Reference Kaur, Sawhney and Engles2 Various simulation techniques had been developed and worked upon for predicting the nanoscale phenomena in a molecular device that maintains a good compromise between computational accuracy and practicality. Reference Rakshit, Liang, Ghosh and Datta3–Reference Muralidharan, Ghosh and Datta5 Moreover, these simulation techniques offer significant amount of organic materials database for the implementation of nanoelectronic devices. Some of the interesting quantum properties observed in these devices are negative differential resistance, Reference Chen, Wang, Reed, Rawlett, Price and Tour6 single electron characteristics, Reference Datta7 current–voltage relationship, Reference Damle, Ghosh and Datta8 and its rectification. Reference Yang, Wan, Yu, Wei and Wang9 This detailed investigation of the quantum transport properties reinforce our ability to understand not only a molecule but also the associated numerous factors, viz. temperature, Reference Wang, Lee and Reed10 nature of bonding between a molecule and an electrode, Reference Ke, Baranger and Yang11 geometry of the contacts, Reference Kaur, Sawhney and Engles12 molecule–electrode distance, Reference Andrews, Cohen, Duyne and Ratner13 molecular orientation, Reference Choi, Kim, Park, Tarakeshwar, Kim, Kim and Lee14 effect of anchor groups, Reference Kaur and Sawhney15 dictating its performance.
W. Kroto, R.F. Curl, and R.E. Smalley, Reference Kroto, Heath, O'Brien, Curl and Smalley16 were awarded the Nobel prize in chemistry (1996) for discovering fullerenes, the buckyball-shaped molecular allotrope of carbon, in 1985. However, it was only after 1990 when C60 became available in sizeable quantities after Krätschmer and Huffman Reference Krätschmer, Lamb, Fostiropoulos and Huffman17,Reference Guldi and Martín18 discovered its preparation procedure. This discovery in the field of chemistry Reference Zheng, Irle and Morokuma19,Reference Paulus20 enlarged its scope of discussion and reached among the interdisciplinary researchers who led various modifications in the structure of C60 forming the new fullerene derivatives, Reference Bendikovand, Wudl and Perepichka21 with distinguished structural, Reference Rassat22 magnetic, Reference Lappas, Prassides, Vavekis, Arcon, Blinc, Cevc, Amato, Feyerherm, Gygax and Schenck23 superconducting, Reference Hebard, Rosseinsky, Haddon, Murphy, Glarum, Palstra, Ramirez and Kortan24 electrochemical, Reference Echegoyenand and Echegoyen25 and photo-physical properties. Reference Guldi26 Intense investigation of the derivatives of C60 molecule, notably C20, is critical because it is the smallest fullerene ever practically producible. C20, a fullerene molecule with extreme curvature has been previously prepared from a brominated hydrocarbon, dodecahedrane, by gas-phase debromination. Reference Prinzbach, Weiler, Landenberger, Wahl, Scott, Gelmont, Olevano and Issendorff27 C20 comprises of polyhedral carbon cage of 12 pentagonal and zero (n/2 − 10) hexagonal faces (dodecahedron with I h symmetry) with 30 edges. Additionally, C20 fullerene violates the isolated pentagon rule. Reference Sattler28 In the last decade, various attempts were made to study the electron-conduction Reference Roland, Larade, Taylor and Guo29 and transport Reference Yamamoto, Watanabe and Watanabe30 properties of C20 fullerene. Some important transport properties using first principle calculations have been reported by Y.P. An et al., Reference An, Yang, Wang, Ma and Wang31,Reference An, Yang, Wang, Ma and Wang32 L.H. Wang et al., Reference Wang, Guo, Tian, Song and Ding33 and G. Ji. Reference Ji, Li, Fang, Xu, Zhai, Cui and Liu34 The delocalized state distribution is important in understanding structure of molecule because these are responsible for charge transfer within in device through the fullerene molecule. Reference Ivanov, Yu Kashenock, Polozkov and Solov'yov35
This paper focuses on elaborating the electronic configuration of C20 fullerene molecule stringed to gold electrodes forming a two-probe device and examines their electronic and transport properties. The nature of HOMO–LUMO gap (HLG), current–voltage characteristics is deliberated and its relation with conductance curves is adequately discussed.
II. MODELING AND APPROACH
In a single molecular device, the system comprises of three distinct parts namely left electrode, central scattering region, and right electrode. The central scattering region consists of three layers of electrodes along with the molecule under observation, thus forming an “extended molecule”. The only criterion behind selecting this particular length of the electrodes is to make sure that there are either no or negligible interactions with the second-nearest neighbor cell in the transport direction. In this context, we have calculated the electrode length to be 7 Å with miller indices as 1:1:1. This setup is assumed to be placed in an isolated environment, where in, the interactions with the external environment are neglected, to observe the quantum effect of charge transport in the single molecular device at 1-D level for a restricted range of low-applied bias.
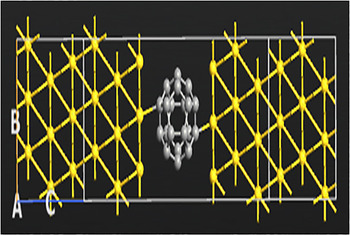
The present paper has found certain insights by critically analyzing the work done by Y.P. An et al. Reference An, Yang, Wang, Ma and Wang31 using two-probe device of C20 molecule. Y.P. An et al. Reference An, Yang, Wang, Ma and Wang31 reported the transport properties of molecule device formed by placing C20 molecule in between three-atoms of gold electrodes, which seems more of a compromise. Later in 2010, he reported C20 molecular bridge using three-dimensional electrodes but still this work was limited in its scope as it was focused on comparison between C20 and its endohedral Li@C20 metallofullerene. Reference An, Yang, Wang, Ma and Wang32 In contrast, we used more practical and realistic approach towards the gold electrodes thus forming a close-packed molecular structure by employing a (111) surface of the face centred cubic (FCC) lattice (Fig. 1) which is explained in depth with the help of energy levels, number of charge carriers, and their transfer.
C20 fullerene stringed to gold electrodes forming a device. White dotted region forms an “extended molecule” with few atoms of electrodes coupled to molecule in the central scattering region in three-dimensional spaces.

While modeling, we adopted the mechanically controllable break junctions (MCBJ) approach. This approach possesses a number of attractive features like higher stability, faster actuation and is easily experimentally realizable when compared to the other computational techniques generally used for experimental methods (like scanning tunnelling microscopy [STM], electro-migration methods or electro-deposition). Reference Xiang, Jeong, Kim, Lee, Cheng, Wang and Mayer36 The single physical contact between electrodes and molecule with gap-width, of the order of nanometers between two gold electrodes is adjusted mechanically by exploiting the MCBJ technique. It is formed by mechanically stretching the gold wire up to its breaking point. Next, the fractured surfaces of the gold electrode wire are cleaned by applying high voltage pulses. Finally, these clean and smoothened gold electrodes are exposed to the C20 fullerene molecule, thus forming an organic molecular bridge. Reference Kaur, Sawhney and Engles37,Reference Goel, Howard and Vander Sande38 Theoretically, the geometry optimization Reference Karakasidis and Charitidis39,Reference Ferreira and Aphale40 is performed on the computational molecular bridge to obtain minimal total energy of central scattering region.
For an explicit description of the bias-dependent electron transport through metal–molecule–metal junctions, we adopt density functional theory (DFT)–non-equilibrium Green function (NEGF) Reference Brandbyge, Mozos, Ordejon, Taylor and Stokbro41–Reference Xue, Datta and Ratner43 method and all the relevant calculations were performed using Atomistix Tool Kit. 44 The exchange-correlation potential is described by the Perdew–Burke–Ernzerh (PBE) Reference Perdew, Burke and Ernzerhof45 of parametrization of generalized gradient approximation (GGA) functional which is same as that reported by Y.P. An et al. Reference Yamamoto, Watanabe and Watanabe30,Reference An, Yang, Wang, Ma and Wang31 The advantage of using this function is that spurious scattering would be inconsequential when the NEGF method includes the many-body effects. Usually the combination of double zeta plus polarization (DZP) basis set for the molecule with a single zeta basis set for the leads along with PBE–GGA functional is adopted by number of researchers Reference Cho, Kim and Kim46,Reference Kim, Kheli, Schultz and Goddard47 to reduce the computational time and cost. However, we make use of high level DZP basis set for all atomic species in conjunction with PBE–GGA without making any comprise to accuracy as explained by M. Strange et al. Reference Strange, Kristensen, Thygesen and Jacobsen48 The atomic cores are specified by norm-conserving Troullier–Martins pseudopotentials. Reference Troullier and Martins49 The atomic structure of the two-probe junctions is optimized until the maximum residual force on all atoms is less than 0.02 eV/Å.
The DFT–NEGF method has become the genuine standard approach for modeling non-equilibrium quantum transport in atomistic nanostructures and is explained as following steps: (i) the coupling between the extended molecule and electrodes is achieved through Green's function, (ii) the density matrix (for equilibrium and non-equilibrium states) is computed from the energy integral of Green's function, (iii) the density of states (DOS) and its number of electrons or electron density for device are obtained, (iv) the effective Hartree potential of left, right electrodes and of central region are calculated, (v) the transmission function is calculated, (vi) the Landauer formula is used to calculate the current flowing through the conducting channel by
 $I = {{2{e^2}} \over h}\int_{ - \infty }^\infty {T\left( E \right)\left[ {{n_{\rm{F}}}\left( {E - {\mu _{\rm{L}}}} \right) - {n_{\rm{F}}}\left( {E - {\mu _{\rm{R}}}} \right)} \right]{\rm{d}}E}$
, and (vii) the differential conductance for a series of applied biases is calculated from G = G
0
T(E
f), where G
0 is the fundamental quantum conductance unit that measures the conductance of quantum point contact, taking advantage of high stability of gold at 300 K. A detailed discussion is given in the supporting information.
In our calculations, the lattice cell for the scattering region is defined by 3 × 3 atoms in the direction perpendicular to the transport direction. Also, central scattering region contains three surface layers on each side of the molecule with 1 × 1 × 100 k-point grid for the sampling 50,51 in the transverse Brillouin plane. The electrostatic potentials are determined on a real-space grid with a mesh cut-off energy of 75 Hartree a.u. to achieve a balance between the computation time and accuracy.
III. RESULTS AND DISCUSSIONS
The important transport measurements required to predict the quantum behavior of Au–C20–Au device are studied for zero bias and variegated bias (−2 to +2 volts).
A. Quantum transport under zero bias
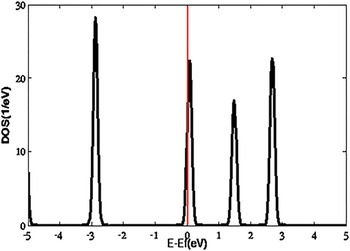
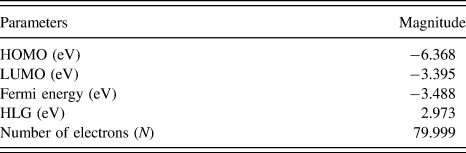
First, the quantum transport calculations for Au–C20–Au device at zero bias are considered for the initial path forming phenomenon undertaking within the device. Beforehand, we discuss the molecular structure of an isolated C20 molecule. As discussed above, C20 fullerene here is a cage isomer with 20 pentagons and 30 bonds. The C20 cage is molecular symmetric molecule of the icosahedral point group I h, with 120 symmetry operations. Also, it is the only second fullerene with the full I h symmetry apart from C60. As the band structure plots help to describe the conducting nature in bulk mode, the DOS explains the quantum states available at energy levels for molecule and device mode. The DOS and molecular orbitals (MOs) of isolated C20 are calculated with DFT–GGA parameterization as shown in Fig. 2 and Table I.
DOS for isolated C20 fullerene. The relative Fermi energy, E f is zero as plotted by red line.

Various parameters for isolated C20 fullerene.

The resonance of strong peak in density above relative Fermi energy indicates the presence of conduction through the LUMO level. This is clearly visible from the study of MOs where Fermi level is near LUMO.
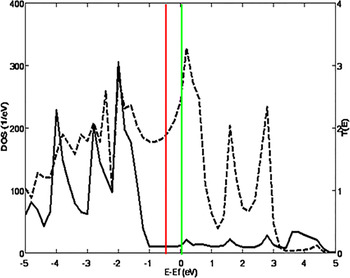
When a C20 molecule is stringed with two gold electrodes, the system advances and replaces the discrete molecular energy levels with a continuous DOS and establishes a common electrochemical potential between fullerene molecule and gold electrodes. It is presented in Fig. 3. To have a finite transmission, there should be available collecting states in the right electrode for the states coming from the left electrode. The transmission probability, T(E) as a function of electron energy is also presented in Fig. 3.
DOS and transmission spectrum for Au–C20–Au device. Solid line represents DOS and dotted line represents T(E) calculations. Red and green colored lines indicate HOMO and LUMO, respectively.

Since bonding in path formation reflects the type of coupling of the electrodes to the molecule, the distribution of MOs and the extent of hybridization can be obtained by comparative analysis of DOS and transmission spectrum. From Fig. 3, with energy range from −5 eV to +5 eV, the necessary information about MOs and HLG is derived. The comparison between DOS and transmission spectrum (relative E f = 0) depicts HOMO at −0.515 eV and LUMO at 0.039 eV (HLG = 0.554 eV) for C20 molecule, which is approximately same to that 0.54 eV as reported by Y.P. An et al. Reference An, Yang, Wang, Ma and Wang31 The MOs shifts and Fermi level reduces from −3.488 eV to −3.001 eV with HLG decreasing by 81.36% when C20 molecule is placed within gold electrodes.
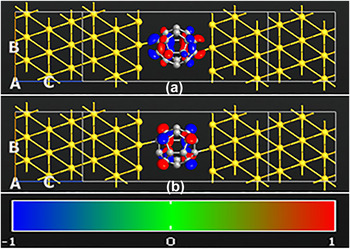
It is inferred that transmission probability is broadly peaked around the molecular energy levels. This reflects delocalized character of the chemical bond, which signifies that the carbon atoms with delocalized pi-electron states are mainly involved into the conduction process. The quantum transport is feasible through the LUMO level. Likewise, low HLG of 0.554 eV reflects the formation of strong coupling at zero bias as indicated by the molecular projected self-consistent Hamiltonian (MPSH) states (Fig. 4). It is perceived that the electron transport occurs through the well-defined alignment between energy level states of a single molecule of C20 fullerene with that of semi-infinite gold electrodes.
MPSH states of (a) HOMO and (b) LUMO of C20 fullerene at zero bias in device configuration. The red and blue color of the states represents different orbital phases.

Further, we calculate the MO energy ratio (= ionization potential:electron affinity) from the Koopman's theorem. Reference Luo, Xue, Liu, Wu and Yang52 The ratio of ionization potential to electron affinity comes out to be −13.205 eV (0.515/(−0.039) eV). The MO energies of C20 fullerene are approximately approaching values reported by F.A. Gaintucro et al. Reference Gianturco, Kashenock, Lucchese and Sanna53 MO energy ratio supports the evidence that electrode–molecule interactions are quite strong at zero bias and fully degenerated junction orbitals results in complete delocalization of the orbital throughout the extended molecule (as in Fig. 4).
B. Quantum transport under discrete bias
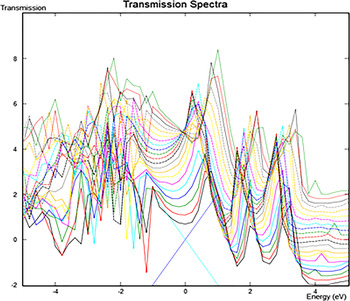
The quantum transport under varied bias of −2 V to +2 V is explored as the Au–C20–Au system is driven out of equilibrium on the application of bias voltage. Transmission spectra are first procured to have our preliminary investigation about the flow of charge, accountable for current characteristics in Au–C20–Au device. When the bias voltage is applied, a system is driven out of equilibrium which in turn changes its electrode potential. The non-equilibrium transport characteristics of molecular junctions strongly hinges, firstly, on the potential profile across molecule under the influence of bias voltage and secondly, on the location of Fermi energy with respect to energy levels of molecule under study. For this purpose, transmission spectra is plotted by considering the Fermi energy as energy zero (E f = 0) and representing its HOMO and LUMO. Transmission spectra reveal the strength of electron transport under different chemical potentials for different bias voltages. The higher transmission rates at diverse ranks of energy levels are indicated by the higher number of peaks. The magnitude, height and width of transmission peaks correspond to the extent of coupling between MOs and states of electrode. Reference Cohen, Stokbro, Martin and Ratner54,Reference Morkoc55
Transmission spectrum sketched in Fig. 5 depicts quite high density of peaks. The increased rate of peaks around the relative Fermi level referred to MO, namely HOMO and LUMO, is responsible for actual charge transfer during electron process. These peaks correspond to easy transmission of electrons from left to right gold electrodes; p electrons dominate at low energy and s electrons at higher energy. Since, at these energies an electron uses MOs of the C20 molecule to propagate through the organic metal–molecule–metal device. We observe that the different curves for different bias voltage are rather similar around the Fermi level as screening effects become negligible and therefore, it exhibits minimal effect on scattering properties of the device.
Transmission spectra for Au–C20–Au device at various biases. Dotted line represents the relative Fermi level at E f = 0 eV. The two crossing dotted lines indicate the bias window.

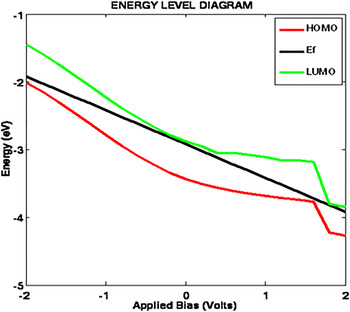
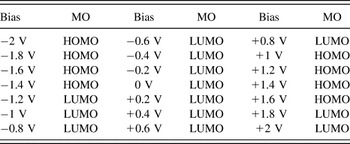
Furthermore, we plotted the energy level diagram at various bias voltages in Fig. 6 as the distribution of electronic MOs and their character near E f are crucial for elucidating the mechanisms of underneath phenomenon of transmission function. Energy level diagram for applied bias voltage deduces the role of MO in conduction with changing Fermi levels with respect to applied bias. At these conditions, electron transport occurs through the well-defined charge states of a single molecule of C20 fullerene. The calculated energy levels for C20 fullerene molecule centered between the Au electrodes are in accordance with the established results. Reference Gianturco, Kashenock, Lucchese and Sanna53 The active MOs responsible at each bias voltage are tabulated in Table II.
Energy level diagram for Au–C20–Au device at different bias. Red, black and green lines represent HOMO, Fermi level and LUMO, respectively.

MO at applied bias.
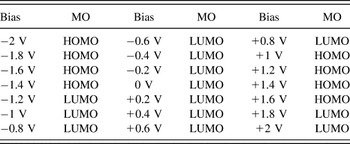
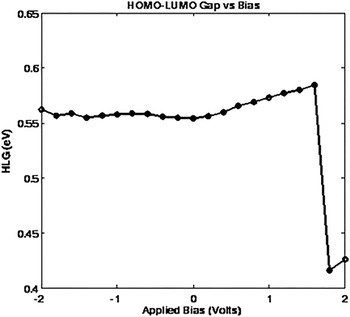
In Fig. 6, we can clearly see the overlapping between LUMO and Fermi level, when the applied bias is smaller than HLG, suggesting the conduction through nonresonant tunneling. Reference Song, Reed and Lee56 This predicts that the transport is mainly influenced by the quantum mechanical tunneling at LUMO level. While for the higher bias set, conduction is possible through HOMO level where resonant states of the C20 hybridized with the gold electrodes, with an exception for 1.8 V and 2 V where the conduction is through LUMO. From the energy level diagram (Fig. 6), we calculate HLG and it is plotted in Fig. 7.
HLG for applied bias to Au–C20–Au device.

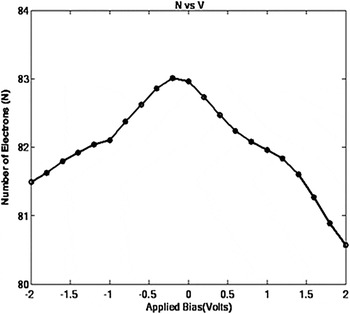
The HLG is almost constant around 0.55 eV (except at +1.8 V and +2 V). The change at +1.8 V and +2 V, however, is pretty unusual to be present only at one side of voltage set (for positive magnitude only) despite symmetric electrodes. But this assertion is explained by the number of electrons and their transfer. First, the number of electrons or electron density from the C20 molecule, one of the bias-dependent measurements responsible for non-equilibrium condition is presented in Fig. 8. As the number of electrons at quantum level is not an absolute quantity, the total electron density in molecule is sum of valence electrons from fullerene (80) and from its point contact with two metal electrodes (N-80).
Number of electrons for applied bias (N versus V).

The highest magnitude of negative charge carriers, N from C20 molecule towards electrodes, is 83 at −0.2 V, not at 0 V. This change of the central bias voltage to −0.2 V has shifted the central resonance that induces unequal number of charge carriers at positive and negative bias voltages. Moreover, the number of charge carriers from molecule decreases as the non-equilibrium condition within the device increases. For two of positive bias voltages (+1.8 V and +2 V), number of electrons from C20 molecule has decreased below 81 and hence the molecule is no longer an active participant in transport process. This clarifies the significant role played by electrodes only.
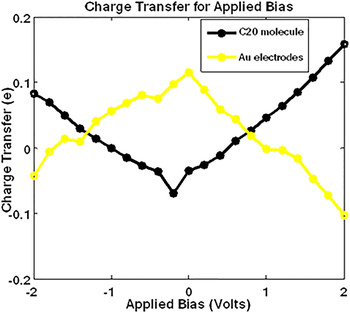
Secondly, the charge transfer between molecule and electrodes with the increase in bias voltage is also investigated through Mulliken population analysis as shown in Fig. 9. Mulliken population shows a richness of distinct features of charge transfer within molecular device. The magnitude of charge transfer varies from −0.2e to +0.2e but number of electrons is more than 80. This is described by free electron model which states that the electrons gain some momentum opposite to the direction of the electric field when we apply bias across a left electrode. This additional momentum is comparatively less than the random momentum they already posses. Thus, despite the presence of many electrons within the molecule, the only electrons which contribute to conduction are those near the leading edge of its Fermi surface. Reference Durkan57
Charge transfer for applied bias to Au–C20–Au device.

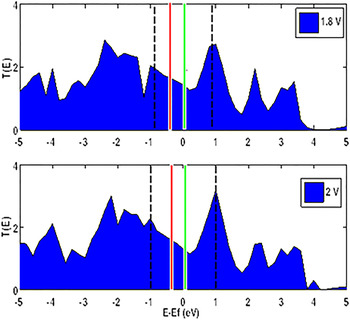
The negative charge transfer for C20 molecule within the lower bias range from −1 V to +0.4 V indicates the charge transfer from C20 molecule to Au electrodes and hence, the metallic nature of C20 fullerene. The shifted central resonance at −0.2 V with maximum number of electrons (N = 83) has also led to maximum charge transfer from molecule to electrodes. While for higher bias ranges from −2 V to −1.2 V and +0.6 V to +2 V, charge transfer is directed from Au electrodes to C20 molecule. Charge transfer within the bias voltage range from −2 V to +1.6 V indicates the conventional operation of a nanoswitch with 1.6 V as its breakup voltage. After this breakup voltage, charge transfer from Au electrodes increases manifold along with the transition from HOMO to LUMO for rest of two voltages and consequently reduces HLG (Fig. 7). We gather additional evidence for this phenomenon from transmission coefficients of device under +1.8 V and +2 V as displayed in Fig. 10.
Dependence of transmission coefficient on bias voltages of 1.8 V and 2 V. Dotted black lines, solid red line, and solid green line represent bias window, HOMO and LUMO, respectively.

The transmission coefficients at Fermi level are observed to 1.42 and 1.29 for 1.8 V and 2 V, respectively. The magnitude of transmission coefficients at Fermi level reduces with increase in bias but the presence of sharp transmission peaks within bias range dictates the lowered HLG at these two higher bias voltages. Hence, the change in MO level responsible for conduction is the result of sudden increase in the charge transfer from gold electrodes with the accumulated potential energy after breakup voltage of 1.6 V. Such agreement gives us a high level of confidence to explore other properties of C20 fullerene.
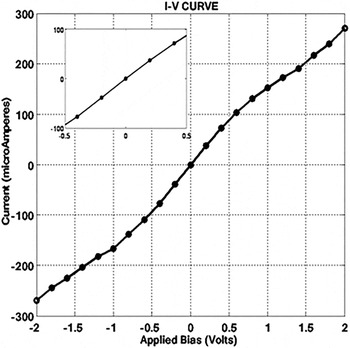
Next, the electrical characteristics of the molecule are determined by acquiring current versus bias voltage (I–V) curve. It is well understood that molecular devices do not support large magnitude of currents that the bulk device normally can carry. This means that when a molecular device is investigated, the magnitude of a current must be delicately contained. I–V curve for Au–C20–Au device is plotted in Fig. 11. The evolution of current with the applied voltage is continuous due to the broadening by self-consistent calculations.
I–V curve for Au–C20–Au device at discrete bias.

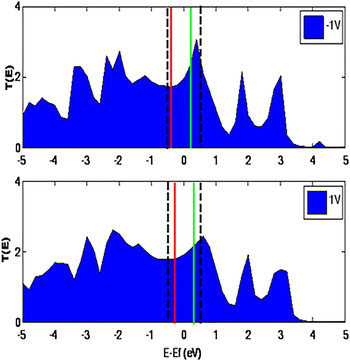
I–V curve is the direct consequence of MO localization. The molecular physics for HLG of C20 (0.5545 eV) depicts the metallic transport characteristics for Au–C20–Au organic device. For better explanation we have divided I–V curve into: two segments of higher voltages (±1 V to ±2 V) and one segment of lower voltages (−1 V to +1 V). For almost the entire range of lower voltages, we observe that the current tends to increase linearly with applied bias voltages because of its conduction through nonresonant tunneling. Specifically, within the bias range from −0.4 V to +0.4 V (inside Fig. 11), I–V curve is undoubtedly linear as the charge transfer from C20 molecule to gold electrodes is maximum (Fig. 9). The overall linearity of I–V curve for this bias segment starts decreasing at an applied bias of −1 V and +1 V, making them the transitory voltage points for a Coulomb staircase. This little nonlinearity arises from the fact that, at −1 V, charge transfer is from molecule to the electrode through LUMO level. While at +1 V, charge transfer is from electrode to the molecule through HOMO level (see Fig. 11 and Table II). Also, this assertion is supported by the dependence of transmission coefficient on the bias voltages for −1 V and +1 V as in Fig. 12.
Dependence of transmission coefficient on bias voltages of −1 V and +1 V. Dotted black lines, solid red line, and solid green line represent bias window, HOMO, and LUMO, respectively.

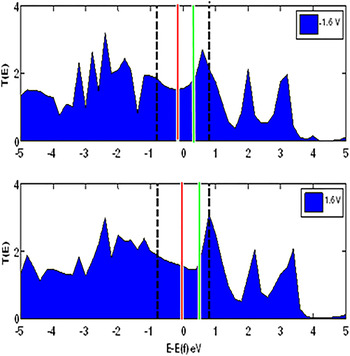
It is found from Fig. 12 that the transmission coefficient at Fermi energy, E f, for −1 V and +1 V are of unequal magnitudes (1.96 and 1.90, respectively). This little difference in transmission coefficient has caused slight nonlinearity in their current magnitude. Within the higher bias range segment, the slope of I–V curve has become quite gradual in its nature. At the bias voltages of −1.2 V and +1.2 V, the values of the current start recovering from non-linearity and the electrons blocked from tunneling pushes themselves to jump to the second level of Coulomb staircase. Moreover, the I–V curve becomes linear with decreasing differences in slope geometry after the bias voltages of −1.6 V and 1.6 V and is supported by its dependence of transmission coefficient on −1.6 V and +1.6 V as in Fig. 13.
Dependence of transmission coefficient on bias voltages of −1.6 V and +1.6 V. Dotted black lines, solid red line, and solid green line represent bias window, HOMO, and LUMO, respectively.

It is found from Fig. 13 that the transmission coefficient at Fermi energy, E f, (1.55 units) for −1.6 V and +1.6 V are of equal magnitude. Such a similarity in transmission coefficients at Fermi levels exhibit linearity in I–V characteristics at these voltages. At the end of higher bias segment in I–V curve, the low HLG for +1.8 V and +2 V has not created any difference from their negative counterparts in forward and reverse currents. This consistency is indeed due to the active participation of electrodes in transport process at higher bias segment.
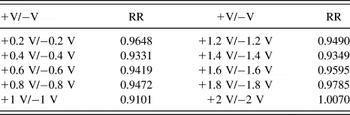
Moreover, this single molecular device configuration with linear current characteristics is supplemented by some in-depth pursuing of its rectification ratio (RR) as shown in Table III. For the requirements of the rectification of current, we study the symmetry of the element of the Green's function with respect to voltage. We observe that the molecule–electrode coupling is voltage-dependent and is a symmetric function of RR, which we find to be oscillating between 0.9 and 1.
RR for applied bias.

RR indicates the points of transitioning in I–V curve, thus symbolizing the formation of Coulomb staircase. The least value of RR is calculated to be 0.907 at +1 V/−1 V that indicate the transitory and least symmetric points of coupling in slope of I–V curve (Fig. 11). As mentioned above, the inclusion of the electron–electron repulsive interaction reduces the magnitude of the current and thus giving rise to Coulomb staircase behavior at these two voltages. RR achieves the maximum value of unity at +2 V/−2 V that indicates the most symmetric points of coupling in the I–V curve. This increased coupling at higher voltages (+1.8 V/−1.8 V and +2 V/−2 V) is evident from larger charge transfer from gold electrodes towards molecule through different MOs in both forward and reverse directions (Fig. 9).
Significantly, charge transfer between C20 molecule and electrodes, proper alignment of MO level to the Fermi energy, and the nature of coupling being symmetric function of voltage have led to metallic nature of I–V curve. In retrospect, it is interesting to envisage that NEGF–DFT calculation of Au–C20–Au device, presenting overall linearity of I–V curve and the metallic nature of this molecular bridge.
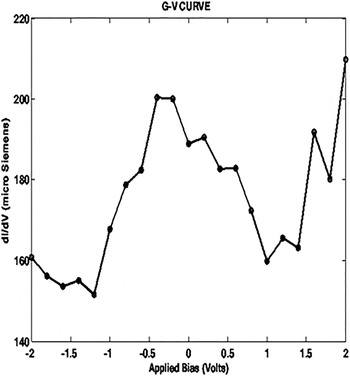
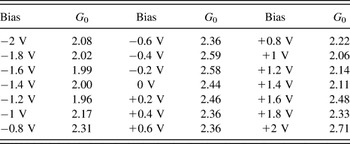
The plot of differential conductance (dI/dV) is another important electrical measurement to be made on a nanoscale device. We observe that the G–V curve as shown in Fig. 14 below is so ideally conductive that the magnitude for differential conductance for whole range of applied bias is approximately equal to or greater than two times the quantum of conductance Reference Taylor and Mohr58,Reference van Wees, van Houten, Beenakker, Williamson, Kouwenhoven, van der Marel and Foxon59 (G 0) (Table IV).
G–V curve for Au–C20–Au device at various bias voltages.

Quantum of conductance at applied bias.

It is undoubtedly clear that the Kondo assisted tunneling is responsible for such strong conduction at low bias voltages. The Kondo effect is the development of a bound state between a local spin on an island and the conduction electrons in the electrodes Reference Liang, Shores, Bockrath, Long and Park60 that enhances the conductance at low biases. The highest differential conductance is observed to be greater than 2.5G 0 for the bias range of −0.2 V to −0.4 V. This effect is rooted in the charge transfer analysis (Fig. 9), where highest value of charge transfer from C20 molecule at −0.2 V led to the accumulation of the charge that assists the lifting of Coulomb blockade in conductance curve. Reference Park, Pasupathy, Goldsmith, Chang, Yaish, Petta, Rinkoski, Sethna, Abrunã, McEuen and Ralph61 Also, the strong coupling interaction between the localized state and island has led to increase the effective barrier height. This increased height further results in larger peaks, even for higher voltages where these interactions depend on the dynamics of electron tunneling and relaxation in the particle. Moreover, charging from electrodes enters the picture only at higher voltages (after −1 V and +1 V) and leads to further changes in the slope of the conductance curve. Also, we are confident that the change in active MO causes differential conduction to drastically decrease in its magnitude as shown in Fig. 14. There are three major falls in the magnitude of conductance curve, at −1.2 V, +1 V, and +1.8 V. At these voltage points, the quantum transport conduction transitions from HOMO to LUMO, LUMO to HOMO and again from HOMO to LUMO (Fig. 6 and Table II). One exceptional behavior visible in the G–V curve is the highest differential conductance of 2.7G 0 at +2 V. Such abrupt change is definitely due to the sudden drop in HLG and its accumulated potential energy after the breakup voltage of +1.6 V (Fig. 9).
IV. CONCLUSION
In the above implementation, we investigate the non-equilibrium transport behavior and the structural properties of an experimentally motivated Au–C20–Au molecular device through two-probe molecular configuration. The DOS, transmission spectrum, MO, current–voltage, RR, and differential conductance characteristics are modeled using DFT–NEGF computational approach. The quantum transport initially is analyzed for zero bias, then for the variegated bias voltages. For better clarification of the simulated results, we have concluded our results in five main points. First, the lower magnitude of HLG and delocalized nature of chemical bonding in the DFT–NEGF computation reflects the formation of strong coupling at zero bias. We perceive that the electron transport occurred through well-defined alignment between energy level states of a single molecule of C20 fullerene with that of semi-infinite gold electrodes. Second, the negative charge transfer for C20 molecule within lower bias range indicates charge transfer from molecule to the gold electrodes. Third, the linearity in I–V characteristic of perused Au–C20–Au device indicates metallic nature of molecular device and forms a Coulomb staircase with transition points of ±1 V. Fourth, the molecule–electrode coupling is voltage-dependent and is a symmetric function of RR whose value oscillates between 0.9 and 1. Fifth, the quantum of conductance for Au–C20–Au device is observed to be greater than 2G 0 for all the applied bias voltages. Hence, the set of calculation with DFT–NEGF computation clearly distinguishes the efficiency and a good compromise of computational accuracy and practicality.