


1. Introduction
Scattering diagrams (introduced in [Reference Kontsevich, Soibelman, Etingof, Retakh and Singer13]) are a method to combinatorially encode families of automorphisms of an algebraic torus (or, more generally, elements of the Lie group associated to a pronilpotent Lie algebra). They are related to various subjects such as curve counting [Reference Argüz and Gross1, Reference Bousseau2, Reference Bousseau, Brini and van Garrel4, Reference Gräfnitz6, Reference Gross, Pandharipande and Siebert10, Reference Kontsevich and Soibelman14], quiver representations [Reference Gross and Pandharipande9, Reference Reineke16], stability conditions [Reference Bousseau3, Reference Bridgeland5], cluster algebras [Reference Gross, Hacking, Keel and Kontsevich8, Reference Kontsevich and Soibelman14] and mirror symmetry [Reference Gross, Hacking and Keel7, Reference Gross and Siebert11–Reference Kontsevich, Soibelman, Etingof, Retakh and Singer13].
A scattering diagram
 $\mathfrak {D}$
(in dimension two) is a collection of rays
 $\mathfrak {d}\subset \mathbb {R}^2$
with attached functions
 . It is completely described by the coefficients
 $c_{a,b}$
of its functions. We use the factorised representation
 $$ \begin{align*} f_{\mathfrak{d}}=\prod_{k>0}(1+tx^ay^b)^{c_{ka,kb}}. \end{align*} $$
Each ray or line
 $\mathfrak {d}$
induces an automorphism
 . Starting with an initial diagram
 $\mathfrak {D}_0$
, there is a scattering algorithm that iteratively produces scattering diagrams
 $\mathfrak {D}_k$
such that the composition of the automorphisms
 $\theta _{\mathfrak {d}}$
is trivial modulo
 $t^k$
. Taking the formal limit, one obtains a consistent scattering diagram
 $\mathfrak {D}_\infty $
. (See Section 2.1 for more details.)
The aim of this paper is to show that most consistent scattering diagrams have a dense region in which, for every slope, there exists a ray with nontrivial function
 ${f_{\mathfrak {d}}\neq 1}$
. To achieve this, we make use of three different techniques using certain properties of scattering diagrams.
First (Section 2.2 and [Reference Gross, Hacking, Keel and Kontsevich8, Reference Gross, Pandharipande and Siebert10]), we can assume that no more than two rays or lines intersect in the same point. Otherwise, one can deform the diagram by slightly moving its rays. If a ray
 $\mathfrak {d}$
has a reducible function
 $f_{\mathfrak {d}}=f_1\cdots f_r$
, one can also split it into several rays with irreducible functions
 $f_1,\ldots ,f_r$
and then deform the diagram to obtain nonintersecting parallel rays
 $\mathfrak {d}_1,\ldots ,\mathfrak {d}_r$
.
Second (Section 2.3 and [Reference Gross, Hacking, Keel and Kontsevich8]), using a change of lattice we can assume that the two rays or lines intersect transversally, so that the attached functions are
 $f_1=(1+tx)^\mu $
and
 $f_2=(1+ty)^\nu $
. The corresponding consistent diagram is called a standard scattering diagram
 $\mathfrak {D}^{\mu ,\nu }$
. By the above, it suffices to study standard scattering diagrams.
Third (Section 2.4 and [Reference Gross, Hacking, Keel and Kontsevich8, Reference Gross and Pandharipande9]), the rays in a standard scattering diagram
 $\mathfrak {D}^{\mu ,\nu }$
obey certain symmetries related to the notion of mutations. Precisely, the corresponding coefficients satisfy
 $c_{a,b}^{\mu ,\nu }=c_{\mu b-a,b}^{\mu ,\nu }=c_{a,\nu a-b}^{\mu ,\nu }$
.
We use the above techniques to prove the theorem stated below.
Definition 1.1. Let
 $\mathfrak {D}^{\mu ,\nu }$
be a standard scattering diagram, that is, the consistent diagram obtained from the initial diagram consisting of two lines with functions
 $f_1=(1+tx)^\mu $
and
 $f_2=(1+ty)^\nu $
. The function attached to the ray in
 $\mathfrak {D}^{\mu ,\nu }$
with direction
 $(a,b)$
,
 $\gcd (a,b)=1$
, can be factorised as
 $$ \begin{align*} f_{(a,b)}^{\mu,\nu} = \prod_{k>0}(1+tx^ay^b)^{c^{\mu,\nu}_{ka,kb}}, \end{align*} $$
defining positive integers (by Proposition 2.9)
 $c^{\mu ,\nu }_{ka,kb}\in \mathbb {Z}_{>0}$
.
Definition 1.2. Define
 $(\mu ,{\kern-1pt}\nu )$
-mutations
 $\textbf T_1^{\mu ,\nu }(a,b){\kern-1pt}={\kern-1pt}(\mu b{\kern-1pt}-{\kern-1pt}a,b)$
,
 $\textbf T_2^{\mu ,\nu }(a,b){\kern-1pt}={\kern-1pt}(a,{\kern-1pt} \nu a{\kern-1pt}-{\kern-1pt}b)$
.
Definition 1.3. We say that
 $(a,b)\in \mathbb {Z}_{>0}^2$
is in the dense region
 $\Phi ^{\mu ,\nu }$
if
 $$ \begin{align*}\frac{\mu \nu - \sqrt{\mu \nu (\mu \nu - 4)}}{2 \mu} < \frac{b}{a} < \frac{\mu \nu + \sqrt{\mu \nu (\mu \nu - 4)}}{2 \mu}. \end{align*} $$
Theorem 1.4.
-
(a) If
 $(a,b)\in \mathbb {Z}_{>0}^2$
is in the dense region
$\Phi ^{\mu ,\nu }$
, then
$c_{a,b}^{\mu ,\nu }\neq 0$
.
-
(b) Otherwise,
$c_{a,b}^{\mu ,\nu }\neq 0$
if and only if
$(a,b)$
is obtained from
$(1,0)$
or
$(0,1)$
via a sequence of
$(\mu ,\nu )$
-mutations. In particular,
$(a,b)$
must be primitive in this case.


Theorem 1.4 will be proved in Section 3. The idea is as follows. It is enough to show density inside a fundamental domain
 $\phi _0^{\mu ,\nu }$
for the mutation actions (Section 3.1). One can show that
 $\phi _0^{\mu +1,\nu }$
(respectively,
 $\phi _0^{\mu ,\nu +1}$
) is contained in
 $\Phi ^{\mu ,\nu }$
if
 $\mu \nu>4$
and
 $\mu>1$
(respectively,
 $\nu>1$
). Then, by induction and symmetry
 $\mu \leftrightarrow \nu $
, it is enough to show density for
 $\Phi ^{2,3}$
and
 $\Phi ^{1,5}$
(Section 3.2). We show this explicitly by deforming
 $\mathfrak {D}^{2,3}$
to
 $\mathfrak {D}^{2,2}$
plus
 $\mathfrak {D}^{2,1}$
and deforming
 $\mathfrak {D}^{1,5}$
to
 $\mathfrak {D}^{1,3}$
plus
 $\mathfrak {D}^{1,2}$
(Section 3.3). Part (b) follows from the mutation actions (Section 3.4).
Remark 1.5. Theorem 1.4 answers [Reference Gross and Pandharipande9, Question 4]. It was proved in the case
 $\mu =\nu $
in [Reference Gross and Pandharipande9, Section 4.7], using an existence statement for quiver representations from [Reference Reineke15]. Reineke stated that there should be a similar argument in the case
 $\mu \neq \nu $
using bipartite quivers [Reference Reineke and Weist18], but this has not been worked out in detail. Our proof is purely combinatorial.
2. Preliminaries
2.1. Scattering diagrams
We provide a definition for scattering diagrams, based on [Reference Gross, Pandharipande and Siebert10]. (See [Reference Gross, Hacking, Keel and Kontsevich8, Reference Gross, Pandharipande and Siebert10] for more general definitions.)
Let
 $M \cong \mathbb Z^2$
be a lattice with basis
 $e_1 = (1, 0), e_2 = (0, 1)$
, and let
 $N := \operatorname {\mathrm {Hom}}_{\mathbb Z} (M, \mathbb Z)$
. For
 $m \in M$
, let
 $z^m \in \mathbb C[M]$
denote the corresponding element in the group ring. If
 $x \,{=}\, z^{e_1}, y = z^{e_2}$
, then
 $\mathbb C[M] = \mathbb C[x^{\pm 1}, y^{\pm 1}]$
is the ring of Laurent polynomials in x and y.
Let R be an Artin local
 $\mathbb {C}$
-algebra with maximal ideal
 $\mathfrak m_R$
, and let
 $$ \begin{align*}\mathbb C[M] \widehat{\otimes}_{\mathbb C} R = \lim_{\longleftarrow} \mathbb C[M] \otimes_{\mathbb C} R/\mathfrak m_R^k .\end{align*} $$
We take
 $M = N = \mathbb Z^2$
and
 , so that
 and
 $\mathfrak {m}_R=(t)$
.
Definition 2.1. A ray or line is a pair
 $ \mathfrak {d} = (\underline {\mathfrak {d}}, f_{\mathfrak d})$
, where
 $\underline {\mathfrak {d}} = b_{\mathfrak {d}} + \mathbb R_{\geq 0} m_{\mathfrak {d}}$
if it is a ray or
 $\underline {\mathfrak {d}} = b_{\mathfrak {d}} + \mathbb R m_{\mathfrak {d}}$
if it is a line, and
 $f_{\mathfrak d} \in \mathbb C[z^{m_{\mathfrak {d}}}] \widehat {\otimes }_{\mathbb C} R \subseteq \mathbb C[M] \widehat {\otimes }_{\mathbb C} R$
is a function such that
 $$ \begin{align*} f_{\mathfrak{d}} \equiv 1 \pmod{z^{m_{\mathfrak{d}}} \mathfrak m_R} .\end{align*} $$
A scattering diagram
 $\mathfrak D$
is a collection of rays and lines such that, for every
 $k> 0$
, there are finitely many rays and lines
 $(\underline {\mathfrak {d}}, f_{\mathfrak d})$
with
 $f_{\mathfrak d} \not \equiv 1 \pmod {\mathfrak m_R^k}$
.
Definition 2.2. For a ray
 $\mathfrak {d}$
and a curve
 $\gamma $
in
 $M_{\mathbb R}$
intersecting
 $\mathfrak d$
transversally at p, let
 $n_{\mathfrak d} \in N$
annihilate
 $m_{\mathfrak d}$
and evaluate positively on
 $\gamma '(p)$
. Define
 by
 $$ \begin{align*}\theta_{\mathfrak d} : z^m \mapsto z^m f_{\mathfrak d}^{\langle m, n_{\mathfrak d} \rangle} .\end{align*} $$
Definition 2.3. A singularity of a scattering diagram
 $\mathfrak D$
is either a base point of a ray or an intersection between two rays or lines that consists of a single point.
Let
 $\gamma : [0, 1] \to M_{\mathbb R}$
be a smooth curve that does not pass through any singularities and whose endpoints are not in any ray or line in the diagram. If all intersections of
 $\gamma $
with rays or lines are transverse, then we define the
 $\gamma $
-ordered product
 $\theta _{\gamma , \mathfrak D} \in \operatorname {\mathrm {Aut}}_R (\mathbb C[M] \widehat {\otimes }_{\mathbb C} R)$
in the following way. For each k, as there are finitely many rays or lines with functions
 $f_{\mathfrak d} \not \equiv 1 \pmod {\mathfrak m_R^k}$
, let
 $0 < p_1 \leq p_2 \leq \cdots \leq p_s < 1$
be such that, at each
 $p_i$
,
 $\gamma (p_i) \in \mathfrak d_i$
for some ray or line
 $(\mathfrak d_i, f_{\mathfrak d_i})$
, and when
 $p_i = p_j$
for
 $i \neq j$
,
 $\mathfrak d_i \neq \mathfrak d_j$
are different rays of the diagram. Then let
 $\theta _i = \theta _{\gamma , p_i, \mathfrak d_i}$
and
 $$ \begin{align*}\theta_{\gamma, \mathfrak D}^k = \theta_s \circ \cdots \circ \theta_2 \circ \theta_1 .\end{align*} $$
Then we define
 $\theta _{\gamma , \mathfrak D}$
as the formal limit
 $\theta _{\gamma , \mathfrak D} = \lim _{k \to \infty } (\theta _{\gamma , \mathfrak D}^k)$
.
We say that a diagram
 $\mathfrak D$
is consistent if
 $\theta _{\gamma , \mathfrak D}$
is the identity map for every closed curve
 $\gamma $
(for which
 $\theta _{\gamma , \mathfrak D}$
is defined). Two diagrams
 $\mathfrak {D}$
and
 $\mathfrak {D}'$
are equivalent if
 $\theta _{\gamma , \mathfrak D} = \theta _{\gamma , \mathfrak D'}$
for every curve
 $\gamma $
.
Proposition 2.4 [Reference Kontsevich, Soibelman, Etingof, Retakh and Singer13], [Reference Gross, Pandharipande and Siebert10, Theorem 1.4].
For a scattering diagram
 $\mathfrak D$
, there exists a consistent scattering diagram
 $\mathfrak D_\infty \supseteq \mathfrak D$
such that
 $\mathfrak D_\infty \setminus \mathfrak D$
consists only of rays.
Remark 2.5. The consistent diagram
 $\mathfrak {D}_\infty $
obtained from
 $\mathfrak {D}$
is unique (up to equivalence) if we require that it has no two rays
 $\mathfrak {d},\mathfrak {d}'$
with the same support
 $\underline {\mathfrak {d}}=\underline {\mathfrak {d}}'$
.
Definition 2.6. If a consistent diagram
 $\mathfrak {D}=\mathfrak {D}_\infty $
has only one singularity, then (by Remark 2.5, up to equivalence) there is at most one ray in each direction
 $m\in \mathbb {Z}^2$
. We write the function of this ray as
 $f_m^{\mathfrak {D}}$
. If
 $f_m^{\mathfrak {D}}=1$
, then we can omit the ray.
Definition 2.7. The standard scattering diagram
 $\mathfrak D^{\mu , \nu } = \mathfrak D_\infty ^{\mu , \nu }$
is the diagram obtained by performing scattering on the initial diagram
 $$ \begin{align*}\mathfrak D_0^{\mu, \nu} = \{(\mathbb R (1, 0), (1 + t x)^\mu), (\mathbb R (0, 1), (1 + t y)^\nu)\}. \end{align*} $$
The scattering only produces rays in the first quadrant, that is, with
 ${m_{\mathfrak {d}}\kern1.2pt{=}\kern1.2pt(a,b)\kern1.2pt{\in}\kern1.2pt \mathbb {Z}_{>0}^2}$
. Consider an equivalent diagram to a standard scattering diagram such that there is a unique ray in each direction (see Remark 2.5). We can express the function
 $f_{\mathfrak {d}}$
of the ray
 $\mathfrak {d}$
in direction
 $(a,b)\in \mathbb {Z}_{>0}^2$
as
 $$ \begin{align*}f_{(a, b)}^{\mu, \nu} := f_{(a,b)}^{\mathfrak{D}^{\mu,\nu}} = \prod_{k=1}^\infty (1 + t^{ka + kb} x^{ka} y^{kb})^{c_{ka, kb}^{\mu, \nu}}. \end{align*} $$
Definition 2.8. The coefficients for
 $\mathfrak D^{\mu , \nu }$
are these
 $c_{a, b}^{\mu , \nu }$
.
Proposition 2.9 [Reference Gross, Hacking, Keel and Kontsevich8, Proposition C.13].
The coefficients of a standard scattering diagram are positive integers:
 $c_{a, b}^{\mu , \nu } \in \mathbb {Z}_{>0}$
.
Remark 2.10. Note that
 $c_{a, b}^{\mu , \nu } = c_{b, a}^{\nu , \mu }$
by symmetry: as
 $\mathfrak D^{\mu , \nu }_\infty $
is consistent, its reflection along the diagonal
 $\mathbb R (1, 1)$
is as well, which gives a consistent diagram containing
 $\mathfrak D_0^{\nu , \mu }$
.
Example 2.11. Figure 1 shows the standard scattering diagrams
 $\mathfrak {D}^{1,1}$
,
 $\mathfrak {D}^{2,2}$
and
 $\mathfrak {D}^{3,3}$
.
The standard scattering diagrams
 $\mathfrak {D}^{1,1}$
,
 $\mathfrak {D}^{2,2}$
and
 $\mathfrak {D}^{3,3}$
.

The diagram
 $\mathfrak {D}^{1,1}$
has, apart from the initial lines, only one ray in direction
 $(1,1)$
with function
 $f_{(1,1)}^{1,1}=1+t^2xy$
. Hence, the only nontrivial coefficient is
 $c_{1,1}^{1,1}=1$
.
The diagram
 $\mathfrak {D}^{2,2}$
has only rays in directions
 $(1,1)$
,
 $(n,n+1)$
and
 $(n+1,n)$
for
 ${n\in \mathbb {N}}$
, with
 $$ \begin{align*} f_{(1,1)}^{2,2} = (1-xy)^{-4}, \quad f_{(n,n+1)} = (1+x^ny^{n+1})^2, \quad f_{(n+1,n)} = (1+x^{n+1}y^n)^2. \end{align*} $$
Hence, the nonzero coefficients
 $c_{a,b}^{2,2}$
are
 $$ \begin{align*} c_{n,n}^{2,2} = \begin{cases} 4 & n=2^k, \\ 0 & \text{otherwise}, \end{cases}\! \quad c_{n,n+1}^{2,2}=2, \quad c_{n+1,n}^{2,2}=2. \end{align*} $$
In particular, the rays are discrete.
For
 $\mathfrak {D}^{3,3}$
there is a dense region in which each ray appears with nontrivial function. This is the statement of Theorem 1.4. The functions
 $f_{(a,b)}^{3,3}$
and coefficients
 $c_{a,b}^{3,3}$
are very complicated and unknown in general. Only for the slope
 $1$
coefficients
 $c_{k,k}^{\mu ,\nu }$
is there a known formula, which was proved for
 $\mu =\nu $
in [Reference Reineke17, Theorem 6.4] and for
 $\mu \neq \nu $
in [Reference Reineke and Weist18, Corollary 11.2]. (See also [Reference Gross, Pandharipande and Siebert10, Example 1.6] and [Reference Gross and Pandharipande9, Section 1.4].)
2.2. Deformations
Given a consistent scattering diagram
 $\mathfrak D$
, we can form the asymptotic diagram
 $\mathfrak D_{\text {as}}$
by replacing every ray
 $(b_{\mathfrak d} + \mathbb R_{\geq 0} m_{\mathfrak d}, f_{\mathfrak d})$
with
 $(\mathbb R_{\geq 0} m_{\mathfrak d}, f_{\mathfrak d})$
, and similarly for lines. By considering sufficiently large curves in
 $\mathfrak D$
around the origin containing all singularities, we see that
 $\mathfrak D_{\text {as}}$
is also consistent. We can use this to consider deformations as follows. (For more details see [Reference Gross, Pandharipande and Siebert10, Section 1.4] and [Reference Gross, Hacking, Keel and Kontsevich8, Proposition C.13, Step III].)
Definition 2.12. The full deformation of
 $\mathfrak {D}^{\mu ,\nu }$
consists of general lines
 $\mathfrak {d}_{1,1},\ldots ,\mathfrak {d}_{1,\mu }$
,
 $\mathfrak {d}_{2,1},\ldots ,\mathfrak {d}_{2,\nu }$
with functions
 $$ \begin{align*} f_{\mathfrak{d}_{1,i}} = 1+tx, \quad f_{\mathfrak{d}_{2,i}} = 1+ty. \end{align*} $$
Here the lines being general means that all rays in the consistent diagram intersect in points, not in rays. We will also consider partial deformations by pulling out only one factor.
Proposition 2.13 [Reference Gross, Pandharipande and Siebert10, Section 1.4].
Let
 $\mathfrak {D}'$
be a partial or full deformation of
 $\mathfrak {D}$
. Then
 $(\mathfrak {D}^{\prime }_\infty )_{\mathrm {as}} = \mathfrak {D}_\infty $
.
Example 2.14. Figure 2 shows a full deformation of
 $\mathfrak D^{3,1}$
and a partial deformation by pulling out one factor of
 $(1+x)^3$
. This gives
 $c_{1,1}^{3,1} = 3$
,
 $c_{2,1}^{3,1} = 3$
,
 $c_{3,1}^{3,1} = 1$
,
 $c_{3,2}^{3,1} = 3$
.
A full (left) and partial (right) deformation of
 $\mathfrak D^{3, 1}$
.

Lemma 2.15. If
 $\mu \leq \mu '$
and
 $\nu \leq \nu '$
, then
 $c_{a, b}^{\mu , \nu } \leq c_{a, b}^{\mu ', \nu '}$
.
Proof. Deform
 $\mathfrak D^{\mu ', \nu '}$
in such a way that we have a horizontal line with function
 ${(1 + tx)^\mu }$
and a vertical line with function
 $(1 + ty)^\nu $
. From this, we get a ray contributing
 $c_{a, b}^{\mu , \nu }$
. As all coefficients are positive by Proposition 2.9, we see that
 $c_{a, b}^{\mu , \nu } \leq c_{a, b}^{\mu ', \nu '}$
.
2.3. The change of lattice trick
There is a useful way to reduce to only needing to consider standard diagrams (found in [Reference Gross, Hacking, Keel and Kontsevich8, Proof of Proposition C.13, Step IV]).
Proposition 2.16. Let
 $\mathfrak {D}$
be the consistent diagram obtained from the scattering diagram consisting of two lines
 $\mathfrak {d}_1$
and
 $\mathfrak {d}_2$
with functions
 $f_1=(1+tz^{m_1})^{d_1}$
and
 ${f_2=(1+tz^{m_2})^{d_2}}$
. Let
 $M'\subseteq M$
be the sublattice generated by
 $m_1$
and
 $m_2$
and let
 $N' \supseteq N$
be the dual lattice. If
 $m\in M\setminus M'$
, then
 $f_m=1$
. Otherwise, write
 $m=am_1+bm_2$
. Then
 $$ \begin{align*} f_m^{\mathfrak{D}} = (f_{(a,b)}^{d_1 e(m_2^*), d_2 e(m_1^*)})^{1/e(n)}, \end{align*} $$
where
 $n \in N'$
is orthogonal to
 $m\in M'$
and primitive and, for any
 $n' \in N'$
,
 $$ \begin{align*} e(n'):=\min\{k \in \mathbb{N} \mid kn' \in N\}. \end{align*} $$
In particular, the scattering of any scattering diagram consisting of two lines can be computed from a standard scattering diagram.
Proof. Any ray
 $\mathfrak {d}$
in
 $\mathfrak {D}$
has direction vector
 $m_{\mathfrak {d}}$
contained in
 $M'\subseteq M$
. Hence, we can consider
 $\mathfrak {d}$
,
 $\mathfrak {D}$
and
 $\mathfrak {D}_\infty $
in the lattice M or in the lattice
 $M'$
. In the latter case, we write
 $\mathfrak {d}'$
,
 $\mathfrak {D}'$
and
 $\mathfrak {D}^{\prime }_\infty $
. By definition, the automorphism
 defined by a ray
 $\mathfrak {d}\in \mathfrak {D}_\infty $
is given by

Let
 $e(n')$
be defined as above. Then we have
 $n_{\mathfrak {d}}=e(n_{\mathfrak {d}'})n_{\mathfrak {d}'}$
and the corresponding automorphism
 defined by
 $\mathfrak {d}'\in \mathfrak {D}^{\prime }_\infty $
is given by

This shows that
 $f_{\mathfrak {d}'}=f_{\mathfrak {d}}^{e(n_{\mathfrak {d}'})}$
. In particular, the initial functions
 $f_1$
and
 $f_2$
considered in the lattice
 $M'$
are
 $f^{\prime }_1=(1+tx)^{d_1 e(m_2^*)}$
and
 $f^{\prime }_2=(1+ty)^{d_2 e(m_1^*)}$
, where
 $x=z^{m_1}$
and
 $y=z^{m_2}$
. These are the initial functions of the standard scattering diagram
 $\mathfrak {D}^{d_1 e(m_2^*), d_2 e(m_1^*)}$
.
We know that scattering gives a consistent diagram
 $\mathfrak {D}_\infty ^{d_1 e(m_2^*), d_2 e(m_1^*)}$
. We get a consistent diagram containing
 $\mathfrak {D}$
by replacing any ray
 $\mathfrak {d}' \in \mathfrak {D}_\infty ^{e(n_1),e(n_2)}$
by
 $\mathfrak {d}$
with function
 $f_{\mathfrak {d}}=f_{\mathfrak {d}'}^{1/e(n_{\mathfrak {d}'})}$
. By uniqueness of consistent diagrams up to equivalence (Remark 2.5), this completes the proof.
Example 2.17. Let
 $\mathfrak {D}_{\text {det}}^k$
be the scattering diagram consisting of two lines with attached functions
 $f_1=1+tx$
and
 $f_2=1+tx^{-1}y^k$
. Let
 $M'$
be the sublattice generated by
 $m_1=(1,0)$
and
 $m_2=(-1,k)$
and consider
 $m = am_1+bm_2 \in M'$
primitive with dual
 $n\in N'$
. Then
 $$ \begin{align*} f_m^{\mathfrak{D}_{\text{det}}^k} = (f_{(a,b)}^{k,k})^{\text{gcd}(k,m_{(1)})/k}, \end{align*} $$
where
 $m_{(1)}$
is the first component of
 $m\in M$
. This is because we have
 $e(m_1^*)=e(m_2^*)=k$
and
 $e(n)=\text {gcd}(k,m_{(1)})/k$
. Figure 3 shows
 $\mathfrak {D}_{\text {det}}^k$
and
 $\mathfrak {D}^{k,k}$
for
 $k=4$
to t-order seven.
The diagrams
 $\mathfrak {D}_{\text {det}}^4$
and
 $\mathfrak {D}^{4,4}$
to order seven.

2.4. Mutations
Definition 2.18. For
 $\mu , \nu \in \mathbb Z_{> 0}$
define two mutation actions on
 $\mathbb {Z}^2$
by
 $$ \begin{align*} \mathbf T_1^{\mu,\nu} : (a,b) \mapsto \begin{cases} (\mu b - a, b) & b> 0, \\ (a,b) & b \leq 0, \end{cases} \quad \mathbf T_2^{\mu,\nu} : (a,b) \mapsto \begin{cases} (a, \nu a - b) & a > 0, \\ (a,b) & a \leq 0. \end{cases} \end{align*} $$
Here
 $\mathbb {Z}^2$
is the space of direction vectors
 $(a,b)$
of rays in a scattering diagram, and
 $(a,b)$
will usually be assumed to be primitive, that is,
 $\text {gcd}(a,b)=1$
, and such that
 $(a,b)$
,
 $\mathbf {T}_1^{\mu ,\nu }(a,b)$
and
 $\mathbf {T}_2^{\mu ,\nu }(a,b)$
are all contained in the first quadrant
 $\mathbb {Z}_{\geq 0}^2$
.
Proposition 2.19 [Reference Gross and Pandharipande9, Theorem 7] and [Reference Gross, Hacking, Keel and Kontsevich8, Theorem 1.24].
We have
 $$ \begin{align*} f_{(a,b)}^{\mu,\nu}=f_{\mathbf T_1^{\mu,\nu}(a,b)}^{\mu,\nu}=f_{\mathbf T_2^{\mu,\nu}(a,b)}^{\mu,\nu}. \end{align*} $$
3. Proof of Theorem 1.4
Consider a standard scattering diagram
 $\mathfrak {D}^{\mu ,\nu }$
(Definition 2.7). Mutations (Section 2.4) act on the directions
 $\mathbb {Z}^2$
(or slopes
 $\mathbb {Q}$
). They have some fixed points and naturally divide the scattering diagram into certain regions. We will show the following. All rays produced from scattering have slope
 ${1}/{\mu } < \rho < \nu $
(Proposition 3.13). For
 $\mu \nu>4$
, there is a dense region
 $\Phi ^{\mu ,\nu }$
between slopes
 $\rho _-^{\mu ,\nu }$
and
 $\rho _+^{\mu ,\nu }$
(Definition 3.1) in which every ray occurs with a nontrivial function (Theorem 3.3). It is made up of an infinite number of fundamental domains
 $\phi _k^{\mu ,\nu }$
for the mutation action. The central domain
 $\phi _0^{\mu ,\nu }$
lies between the slopes
 $\rho _{0,\pm }^{\mu ,\nu }$
(Lemma 3.5). Outside the dense region there is a discrete number of rays and each of them appears with coefficients
 $\mu $
or
 $\nu $
, because they come from mutation of the initial rays (Proposition 3.14). The situation is summarised in Figure 4.
The regions of the scattering diagram.

Definition 3.1. In a standard scattering diagram
 $\mathfrak D^{\mu , \nu }$
where
 $\mu \nu> 4$
, the dense region
 $\Phi ^{\mu , \nu }$
is the cone spanned by the rays from the origin with slope
 $$ \begin{align*} \rho_\pm^{\mu, \nu} = \frac{\mu \nu \pm \sqrt{\mu \nu (\mu \nu - 4)}}{2 \mu} = \frac{2 \nu}{\mu \nu \mp \sqrt{\mu \nu (\mu \nu - 4)}}. \end{align*} $$
A ray in direction
 $(a,b)\in \mathbb {Z}_{>0}^2$
is in the dense region if
 $\rho _-^{\mu , \nu } < {b}/{a} < \rho _+^{\mu , \nu }$
.
In this section, we will prove the theorem stated below, by induction.
Definition 3.2. A cone
 $\phi ^{\mu ,\nu }\subset \mathbb {R}_{>0}^2$
is full if
 $c_{a,b}^{\mu ,\nu }\neq 0$
for every
 $(a,b)\in \mathbb {Z}_{>0}^2$
(not necessarily primitive) such that the ray in direction
 $(a,b)$
lies in
 $\phi ^{\mu ,\nu }$
.
Theorem 3.3 (Theorem 1.4(a)).
 $\Phi ^{\mu , \nu }$
is full (and, in particular, dense with rays) when
 $\mu \nu>4$
.
3.1. Fundamental domains
Definition 3.4. The fundamental region
 $\phi _0^{\mu , \nu }$
is the cone between the directions
 $$ \begin{align*} \rho_{0,+}^{\mu,\nu} = \frac{\nu}{2}, \quad \rho_{0,-}^{\mu,\nu} = \frac{2}{\mu}. \end{align*} $$
A ray in direction
 $(a,b)\in \mathbb {Z}_{>0}^2$
is in
 $\phi _0^{\mu ,\nu }$
if
 ${2}/{\mu } \leq {b}/{a} \leq {\nu }/{2}$
. For
 $k>0$
and
 $k<0$
, define recursively
 $$ \begin{align*} \rho_{k+1,+}^{\mu,\nu} = \mathbf{T}_1^{\mu,\nu}(\rho_{k,-}^{\mu,\nu}), \quad \rho_{k-1,-}^{\mu,\nu} = \mathbf{T}_2^{\mu,\nu}(\rho_{k,+}^{\mu,\nu}). \end{align*} $$
Lemma 3.5. The actions of
 $\mathbf T_1^{\mu ,\nu }$
and
 $\mathbf T_2^{\mu ,\nu }$
on the slope
 $\rho ={b}/{a}$
are order reversing (or strictly decreasing) for
 ${1}/{\mu } < \rho < \nu $
and have fixed points
 $\rho _{0,-}^{\mu ,\nu }={2}/{\mu }$
and
 $\rho _{0,+}^{\mu ,\nu }={\nu }/{2}$
, respectively.
Proof. This is clear from the definition (see Definition 2.18). The actions on the slope are given by
 $$ \begin{align*} \mathbf{T}_1(\rho) = \frac{1}{\mu-{1}/{\rho}}, \quad \mathbf{T}_2(\rho) = \nu - \rho.\\[-42pt] \end{align*} $$
Lemma 3.6. We have
 $\mathbf {T}_1^{\mu ,\nu }(\rho _+^{\mu ,\nu }) = \rho _-^{\mu ,\nu }$
and
 $\mathbf {T}_2^{\mu ,\nu }(\rho _-^{\mu ,\nu }) = \rho _+^{\mu ,\nu }$
.
Proof. The second statement is
 $$ \begin{align*} \mathbf{T}_2^{\mu,\nu}(\rho_-^{\mu,\nu}) = \nu - \frac{\mu\nu-\sqrt{\mu\nu(\mu\nu-4)}}{2\mu} = \frac{\mu\nu + \sqrt{\mu\nu(\mu\nu-4)}}{2\mu} = \rho_+^{\mu,\nu}. \end{align*} $$
For the first statement, we show that the reciprocals are equal,
 $$ \begin{align*} \frac{1}{\mathbf{T}_1^{\mu,\nu}(\rho_+^{\mu,\nu})} = \mu - \frac{\mu\nu-\sqrt{\mu\nu(\mu\nu-4)}}{2\nu} = \frac{\mu\nu + \sqrt{\mu\nu(\mu\nu-4)}}{2\nu} = \frac{1}{\rho_-^{\mu,\nu}}.\\[-42pt] \end{align*} $$
Lemma 3.7. We have
 $ \lim _{k\rightarrow \infty } \rho _{k,\pm }^{\mu ,\nu } = \rho _\pm ^{\mu ,\nu }. $
Proof. The compositions
 $\mathbf {T}_1^{\mu ,\nu }\mathbf {T}_2^{\mu ,\nu }$
and
 $\mathbf {T}_2^{\mu ,\nu }\mathbf {T}_1^{\mu ,\nu }$
are strictly increasing continuous functions for
 ${1}/{\mu } < \rho < \nu $
. Hence, they have unique fixed points, which, by Lemma 3.6, are given by
 $\rho _+^{\mu ,\nu }$
and
 $\rho _-^{\mu ,\nu }$
. The limit of the recursively defined sequences
 $\rho _{k,-}^{\mu ,\nu }$
and
 $\rho _{k,+}^{\mu ,\nu }$
have to be fixed points of
 $\mathbf {T}_1^{\mu ,\nu }\mathbf {T}_2^{\mu ,\nu }$
and
 $\mathbf {T}_2^{\mu ,\nu }\mathbf {T}_1^{\mu ,\nu }$
, respectively. Hence, they are given by
 $\rho _{-}^{\mu ,\nu }$
and
 $\rho _{+}^{\mu ,\nu }$
.
Lemma 3.8. If
 $\phi _0^{\mu , \nu }$
is full, then so is
 $\Phi ^{\mu , \nu }$
.


3.2. Induction step
Lemma 3.9. If
 $\mu \nu>4$
and
 $\mu>1$
, then
 $\phi _0^{\mu +1,\nu }$
is contained in
 $\Phi ^{\mu ,\nu }$
. Similarly, if
 $\mu \nu>4$
and
 $\nu>1$
, then
 $\phi _0^{\mu ,\nu +1}$
is contained in
 $\Phi ^{\mu ,\nu }$
.
Proof. By symmetry, we only have to show the second statement, which is equivalent to
 $\rho _{0,+}^{\mu ,\nu +1}<\rho _+^{\mu ,\nu }$
and
 $1/\rho _{0,-}^{\mu ,\nu +1}<1/\rho _-^{\mu ,\nu }$
. The second inequality is
 $$ \begin{align*} \frac{\mu}{2} < \frac{\mu+\sqrt{\mu^2-4\tfrac{\mu}{\nu}}}{2} \ \Longleftrightarrow \ 0 < \mu^2 - 4\frac{\mu}{\nu} \ \Longleftrightarrow \ \mu\nu> 4. \end{align*} $$
The first inequality is
 $$ \begin{align*} \frac{\nu+1}{2} < \frac{\nu+\sqrt{\nu^2-4\tfrac{\nu}{\mu}}}{2} \ \Longleftrightarrow \ 1 < \nu^2 - 4\frac{\nu}{\mu} \Longleftrightarrow \mu> \frac{4\nu}{\nu^2-1}. \end{align*} $$
For
 $\nu \geq 5$
, the right-hand side is smaller than one, and hence any
 $\mu \in \mathbb {Z}_{>0}$
satisfies the inequality. For
 $\nu =4,3,2$
, the inequality is satisfied by all
 $\mu \geq 2,2,3$
, respectively. Hence, all
 $\mu ,\nu \in \mathbb {Z}_{>0}$
satisfying
 $\mu \nu>4$
and
 $\nu> 1$
also satisfy this inequality. This completes the proof.
Proposition 3.10. If
 $\Phi ^{2,3}$
and
 $\Phi ^{1,5}$
are full, then
 $\Phi ^{\mu , \nu }$
is full for all
 $\mu \nu> 4$
.
Proof. Start with a pair
 $(\mu ,\nu )$
with
 $\mu \nu>4$
. With
 $\mu \nu>4$
do the following. If
 $\mu \geq \nu $
, replace
 $(\mu ,\nu )$
by
 $(\mu -1,\nu )$
. Otherwise, replace
 $(\mu ,\nu )$
by
 $(\mu ,\nu -1)$
. Doing this repeatedly we eventually arrive at
 $(1,5)$
or
 $(5,1)$
or
 $(2,3)$
or
 $(3,2)$
. Note that, if
 $\mu \nu>4$
and
 $\mu \geq \nu $
, then
 $\mu>1$
. Similarly, if
 $\mu \nu>4$
and
 $\nu>\mu $
, then
 $\nu>1$
. By Lemmas 3.8 and 3.9, we conclude that
 $\Phi ^{\mu ,\nu }$
is full if
 $\Phi ^{1,5}$
,
 $\Phi ^{5,1}$
,
 $\Phi ^{2,3}$
and
 $\Phi ^{3,2}$
are full. By Remark 2.10,
 $\Phi ^{5,1}$
is full if and only if
 $\Phi ^{1,5}$
is full and
 $\Phi ^{3,2}$
is full if and only if
 $\Phi ^{2,3}$
is full. Hence, the statement follows.
3.3. The base cases
Lemma 3.11.
 $\Phi ^{2, 3}$
is full.
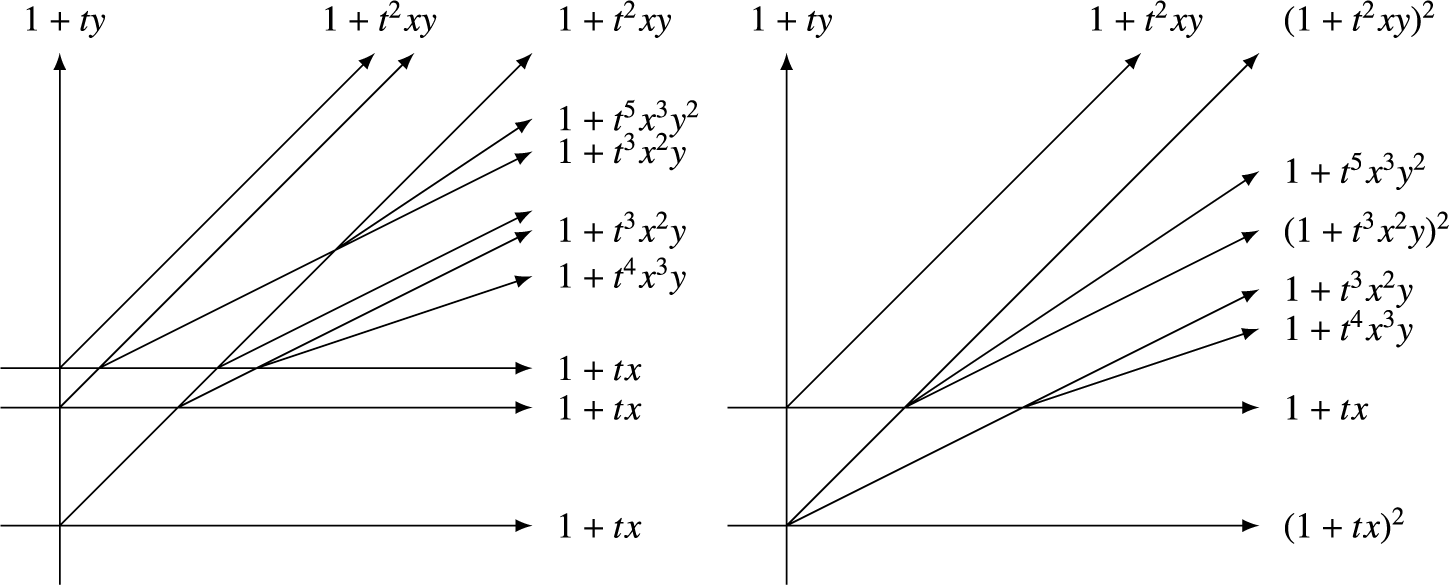
Partial deformations showing that
 $\phi _0^{2,3}$
(left) and
 $\phi _0^{1,5}$
(right) are full.

Proof. Consider a partial deformation of
 $\mathfrak {D}^{2,3}$
into
 $\mathfrak {D}^{2,2}$
and
 $\mathfrak {D}^{2,1}$
by pulling out a vertical line (see Figure 5). In
 $\mathfrak {D}^{2,2}$
, for every
 $n\in \mathbb {N}$
, there is a ray in direction
 ${(n,n+1)}$
with function
 $(1 +t^{2n+1} x^n y^{n+1})^2$
(see Example 2.11). This intersects the pulled out vertical line, which has function
 $1+ty$
. By the change of lattice trick (Proposition 2.16), the diagram at the intersection corresponds to a standard diagram
 $\mathfrak D^{2n,n}$
. By a full deformation, one easily sees that
 $\mathfrak D^{2n,n}$
has rays in directions
 $(1, 1), (1,2), \ldots , (1,n)$
, which correspond to rays in
 $\mathfrak {D}^{2,3}$
with directions
 $(n, n+2), (n,n+3), \ldots , (n,2n+1)$
. Hence, for each direction
 $(a,b)$
with
 $a \leq b \leq 2a+1$
, there exists a nontrivial ray in
 $\mathfrak D^{3,2}$
. These include all directions with
 $1 \leq {b}/{a} \leq 2$
. But this contains the fundamental region
 $\phi _0^{3,2}$
, which lies between
 $\rho _{0,-}^{3,2}=1$
and
 $\rho _{0,+}^{3,2}=\tfrac {3}{2}$
. Therefore,
 $\phi _0^{3, 2}$
is full, and so, by Lemma 3.8,
 $\Phi ^{3,2}$
is full.
Lemma 3.12.
 $\Phi ^{1,5}$
is full.
Proof. Consider a partial deformation of
 $\mathfrak D^{1, 5}$
to
 $\mathfrak D^{1, 3}$
and
 $\mathfrak {D}^{1,2}$
(see Figure 5). As
 $c_{1, 1}^{1, 3} = 3$
(see Example 2.14), we get a subdiagram corresponding to
 $\mathfrak D^{3,2}$
, with rays
 $(a, b)$
in
 $\mathfrak D^{3,2}$
corresponding to rays
 $(a, a + b)$
in
 $\mathfrak D^{1, 5}$
. This maps the slope
 $\rho \mapsto \rho + 1$
, so sends the dense region
 $\Phi ^{3,2}$
between
 $$ \begin{align*} \rho_\pm^{3,2} = \frac{6\pm\sqrt{12}}{6} = 1\pm\frac{1}{\sqrt{3}} \end{align*} $$
to the region between
 $2\pm {1}/{\sqrt {3}}$
in
 $\mathfrak D^{1, 5}$
. This contains the fundamental region
 $\phi _0^{1,5}$
which lies between
 $\rho _{0,-}^{1,5}=2$
and
 $\rho _{0,+}^{1,5}=\tfrac {5}{2}$
. So
 $\phi _0^{1,5}$
is full, and hence
 $\Phi ^{1,5}$
is full by Lemma 3.8.
Now Theorem 3.3 follows from Lemmas 3.11, 3.12 and Proposition 3.10.
3.4. Outside the dense region
Proposition 3.13. In a standard scattering diagram
 $\mathfrak D^{\mu , \nu }$
, every ray with direction
 $(a, b)\in \mathbb {Z}_{>0}^2$
satisfies
 $$ \begin{align*}\frac{1}{\mu} \leq \frac{b}{a} \leq \nu .\end{align*} $$
Proof. We show that
 ${b}/{a} \leq \nu $
. Then
 ${1}/{\mu } \leq {b}/{a}$
follows by symmetry under exchanging
 $(\mu ,a)$
and
 $(\nu ,b)$
. For
 $\nu =1$
, a full deformation of
 $\mathfrak D^{\mu ,1}$
shows that only rays with slope
 ${b}/{a}\leq 1$
appear. Hence, we can assume that
 $\nu>1$
. We proceed by induction on
 $a+b$
. The statement is clear for
 $a+b=1$
. For
 $a+b=2$
, we have
 $a=b=1$
, so
 ${b}/{a}=1$
, and the statement is also true. For
 $a+b>2$
, consider the partial deformation of
 $\mathfrak D^{\mu , \nu }$
into
 $\mathfrak D^{\mu ,\nu -1}$
and
 $\mathfrak D^{\mu ,1}$
by pulling out a vertical line. Consider the ray in
 $\mathfrak D^{\mu ,\nu -1}$
with direction
 $(a_0,b_0)\in \mathbb {Z}_{>0}^2$
. Its attached function is
 $(1+t^{a_0+b_0}x^{a_0}y^{b_0})^{c_{a_0,b_0}^{\mu ,\nu -1}}$
. It intersects the pulled-out vertical line, which has function
 $1+ty$
. By the change of lattice trick (Example 2.17), the diagram at the intersection point is equivalent to
 $\mathfrak D^{a_0c_{a_0,b_0}^{\mu ,\nu -1},a_0}$
. It produces rays with directions
 $(a,b)=\alpha (a_0,b_0) + \beta (0,1)$
for some
 $\alpha ,\beta \in \mathbb {Z}_{>0}$
. We have
 $\alpha \leq a$
and
 $\beta < b$
, so
 $\alpha +\beta < a+b$
and
 $a_0+b_0<a+b$
. By the induction hypothesis, we have
 ${\beta }/{\alpha }\leq a_0$
and
 ${b_0}/{a_0}\leq \nu -1$
. Then
 $$ \begin{align*} \frac{b}{a} = \frac{\alpha b_0+\beta}{\alpha a_0} = \frac{b_0}{a_0}+\frac{\beta}{\alpha}\frac{1}{a_0} \leq \nu. \end{align*} $$
This completes the proof.
Proposition 3.14 (Theorem 1.4(b)).
Outside
 $\Phi ^{\mu , \nu }$
, the only rays that occur are those given by mutations of the initial rays. In particular, rays cannot be dense.
Proof. Let
 $\alpha _0 = 0, \alpha _1 = {1}/{\mu }, \alpha _{n + 1} = \mathbf T_2 (\beta _n)$
and
 $\beta _0 = \infty , \beta _1 = \nu , \beta _{n + 1} = \mathbf T_1 (\alpha _n)$
.
We know that there are no rays with slope
 $\alpha _0 < \rho < \alpha _1$
or
 $\beta _0> \rho > \beta _1$
, and, under mutations, if there are no rays with slope
 $\alpha _{n - 1} < \rho < \alpha _n$
or
 $\beta _{n - 1}> \rho > \beta _n$
, then there are none with slope
 $\alpha _n < \rho < \alpha _{n + 1}$
or
 $\beta _n> \rho > \beta _{n + 1}$
.
Note also that
 $\alpha _0 < \rho _-^{\mu , \nu }$
and
 $\beta _0> \rho _+^{\mu , \nu }$
and that
 $\mathbf T_1,\mathbf T_2 : \rho _\pm ^{\mu , \nu } \mapsto \rho _\mp ^{\mu , \nu }$
are order reversing, so
 $\alpha _n < \rho _-^{\mu , \nu }$
and
 $\beta _n> \rho _+^{\mu , \nu }$
. So we get bounded monotone sequences
 $\alpha _n, \beta _n$
and they converge to
 $\alpha ,\beta $
, respectively. As
 $\mathbf T_2 \mathbf T_1$
is continuous and maps
 $\alpha _n$
to
 $\alpha _{n + 2}$
and
 $\beta _n$
to
 $\beta _{n + 2}$
, respectively,
 $\alpha , \beta $
must be fixed points of
 $\mathbf T_2 \mathbf T_1$
. But the fixed points of
 $$ \begin{align*} \mathbf T_2 \mathbf T_1 : \rho \mapsto \nu - \frac{1}{\mu - 1/\rho} \end{align*} $$
are exactly
 $\rho _\pm ^{\mu , \nu }$
. So
 $\alpha = \rho _-^{\mu , \nu }$
and
 $\beta = \rho _+^{\mu , \nu }$
, and we get the claim.
Acknowledgements
This paper grew out of a Summer Research in Mathematics project carried out at the University of Cambridge. We are grateful to Dhruv Ranganathan for bringing us together and Markus Reineke for clarifying some questions about quiver representations. We thank the anonymous referee for carefully reading our paper and making important comments and suggestions.