INTRODUCTION
Transmission is the driving force in host–parasite interactions for most epidemiological models; however, it is generally the most difficult to directly quantify (McCallum et al. Reference McCallum, Barlow and Hone2001). Transmission rates vary depending on the pathogen type, host(s) involved and mode of infection (direct, indirect or vector). This rate has been directly quantified for highly infectious pathogens of humans (i.e. malaria, measles and several sexually transmitted diseases) (Earn et al. Reference Earn, Rohani, Bolker and Grenfell2000; Lloyd-Smith et al. Reference Lloyd-Smith, Getz and Westerhoff2004; Smith et al. Reference Smith, McKenzie, Snow and Hay2007). However, there are few examples of directly quantified transmission rates in wildlife populations. Instead, transmission rates are indirectly quantified by means of statistical or mathematical models (Anderson et al. Reference Anderson, Jackson, May and Smith1981; Begon et al. Reference Begon, Hazel, Baxby, Bown, Cavanagh, Chantrey, Jones and Bennett1999). Some scientists have used small-scale laboratory challenges to estimate transmission rates in wildlife populations (for example Dwyer, Reference Dwyer1991; Bouma et al. Reference Bouma, De Jong and Kimman1995; Karvonen et al. Reference Karvonen, Paukku, Valtonen and Hudson2003). Many of these small-scale experiments examined the effects of altering densities (host, pathogen or both) on transmission; yet there are factors in addition to density that can have significant effects on host–pathogen transmission dynamics.
Transmission of parasites with free-living stages in the aquatic environment is influenced by a plethora of abiotic factors, including water temperature and velocity (Marcogliese, Reference Marcogliese2001; Pietrock and Marcogliese, Reference Pietrock and Marcogliese2003; Thieltges et al. Reference Thieltges, Jensen and Poulin2008). In many aquatic host–pathogen relationships there is evidence of an optimal temperature range where transmission is maximized (El-Matbouli et al. Reference El-Matbouli, McDowell, Antonio, Andree and Hedrick1999; Pietrock and Marcogliese, Reference Pietrock and Marcogliese2003). In contrast, water velocity appears to have a more consistent inverse relationship with transmission of non-motile spore stages, although for some parasites there is evidence of a velocity threshold above which transmission is greatly reduced or inhibited (Radke et al. Reference Radke, Ritchie and Rowan1961; Barker and Cone, Reference Barker and Cone2000; Hallett and Bartholomew, Reference Hallett and Bartholomew2008).
Ceratomyxa shasta, a myxozoan parasite of salmon and trout, has a complex life cycle requiring salmonid and polychaete (Manayunkia speciosa) hosts and 2 non-motile waterborne stages, an actinospore and a myxospore (Bartholomew et al. Reference Bartholomew, Whipple, Stevens and Fryer1997). Transmission to the fish host occurs when the actinospore penetrates the gill epithelial cells (Bjork and Bartholomew, Reference Bjork and Bartholomew2010). This parasite is endemic in the Pacific Northwest of the USA and Canada (Bartholomew, Reference Bartholomew1998) and has recently been associated with high mortality in out-migrating juvenile salmonids and lower abundance of returning adults in the Klamath River (Fujiwara et al. Reference Fujiwara, Mohr, Greenberg, Foott and Bartholomew2011; Hallett et al. Reference Hallett, Ray, Hurst, Holt, Buckles, Atkinson and Bartholomew2012). The goal of this study was to quantify the transmission of the waterborne actinospore to the salmonid host with respect to different water velocities and temperatures.
To estimate transmission rates of actinospore stages to the salmonid host we conducted a series of 4 experiments (2 field and 2 laboratory). Field experiments tested the hypotheses that transmission rate is (1) constant with respect to exposure duration and (2) inversely related to water velocity. Laboratory experiments tested the hypotheses that (3) transmission is reduced above a threshold water velocity and (4) that higher temperatures result in higher transmission rates. Based on the empirical results, we defined a functional relationship between parasite transmission and environmental factors (i.e. parasite density, water velocity and water temperature). We also attempted to identify whether actinospore transmission was frequency or density dependent and if the trends were consistent between field and laboratory experiments. The estimated range of values and predictive model defined from these experiments can be incorporated into the epidemiological model developed by Ray et al. (Reference Ray, Rossignol and Bartholomew2010) to improve the estimates of the basic reproductive number (R 0) and better understand host–parasite dynamics.
MATERIALS AND METHODS
Field experiments
Field exposures
For both field exposures, juvenile (0+age class, ∼5–8·0 g) Chinook salmon (Oncorhynchus tshawytscha) were obtained from the California Department of Fish and Game, Iron Gate Hatchery. Each exposure was conducted in June (2009 and 2010) when parasite densities are generally highest (Hallett et al. Reference Hallett, Ray, Hurst, Holt, Buckles, Atkinson and Bartholomew2012; Ray et al. Reference Ray, Holt and Bartholomew2012). Fish were transported from the hatchery to the exposure site in aerated coolers and exposed to C. shasta in the main stem Klamath River, California, USA, ∼1 river kilometre upstream from the confluence of the Beaver Creek tributary (41°52·1′N, 122°48·6′W). Fish were held in cylindrical PVC live cages, measuring 0·28×1 m with 0·64 cm mesh screening on each end, and placed on the river bottom parallel to flow. Each cage contained 25 fish. During the exposure, water velocities were measured every 30 min with a Marsh–McBirney Flo-Mate (Marsh–McBirney Inc. Frederick, MD, USA). Three 1 L samples of water were collected upstream of the cages twice per hour and combined into a large collection bucket. From this collection, a subset of 3–1 L samples was collected and assayed by quantitative PCR (qPCR) as described by Hallett et al. (Reference Hallett, Ray, Hurst, Holt, Buckles, Atkinson and Bartholomew2012) to estimate the density of parasite L−1.
Exposure duration experiment
This first study compared the effect of exposure duration on the number of parasites attached to the gill and the resulting transmission rate. In June 2009, eight cages were placed side by side in 4 pairs; 2 m from the bank in water 0·5 m deep with 1 m between each pair of cages. The cages were then randomly assigned exposure durations of either 3 h (cages 1, 2, 5 and 6) or 6 h (cages 3, 4, 7 and 8).
Velocity experiment
In June 2010, three replicate cages were exposed at 1 of 3 different water velocities (0·03, 0·10 and 0·19 m s−1) for 3 h to determine the relationship between velocity and actinospore transmission rates. Replicate cages were placed in a line with the flow and parallel to the bank, with 1 m between each cage. Cages were sited at different depths and distances from the bank to achieve the different velocities. The cages with the slowest velocity were 3 m from the bank in 0·5 m deep water, the medium velocity cages were 4 m from the bank and 1·5 m deep, and the highest velocity cages were 9 m out and 2 m deep. For each velocity, water samples were collected from in front of the first cage of each set.
Post-field exposure sample collection and fish care
Following river exposure, a subset of 10 and 5 fish from each cage (duration and velocity experiment, respectively), were euthanized with 400 mg L−1 of tricane methanesulfonate (MS-222, Argent Laboratories, Redmond, WA, USA). The entire gill from the left side of the fish was removed and stored in 95% ethanol (EtOH) to be assayed by qPCR. The remaining fish were transported to the Oregon State University – John L. Fryer Salmon Disease Laboratory (SDL), Corvallis, Oregon in aerated coolers and observed for signs of morbidity associated with parasite infection. At the SDL, fish were placed into 25 L aquaria, fed daily (Bio-Oregon, Longview, WA, USA) and preventative treatments for bacterial infections and external parasites were administered as described by Stocking et al. (Reference Stocking, Holt, Foott and Bartholomew2006). After 60 days, fish were euthanized using MS-222 and examined for C. shasta myxospores as described by Ray et al. (Reference Ray, Holt and Bartholomew2012).
Laboratory experiments
Velocity experiment
Iron Gate Hatchery juvenile (0+ age class, ∼10–18·0 g) Chinook salmon were exposed to the actinospore stage of C. shasta at 4 velocities (0·05, 0·18, 0·32 and 0·43 m s−1) to determine the effect of velocity on the transmission rate of the actinospore stage. For each of the 4 velocities, 10 trials of 2 fish each were conducted. Effluent from laboratory colonies of infected polychaete hosts (M. speciosa) provided a source of actinospore stages for these challenges. For each trial, 38 L of this effluent were added to 310 L of specific pathogen-free well water in a 350 L fibreglass tank. From this reserve, 3–1 L samples were collected for qPCR assay to estimate parasite density. For each challenge, 2 fish were held in a swim tube (28×5·1 cm). For the 2 slowest velocities, water was pumped from the large aquarium through a series of 1·9 cm PVC piping connected to an Odyssea WP 500 water pump (Odyssea Aquarium Co., China); for the 2 highest velocities, a Little Giant Water Wizard 5-MSP (Franklin Electric Co., Bluffton, IN, USA) was used. Each end of the swim tube was funnelled from 5·1 cm to a 1·9 cm opening and attached to the PVC. Mesh screen (0·64 cm) was glued to the inner rim to aid in diffusing the water and preventing the fish from leaving the tube. Velocities were controlled using a valve on the PVC pipe and measured in the centre of the swim tube before each trial with a Marsh–McBirney Flo-Mate. After each trial, fish were immediately euthanized with MS-222 and half of the entire gill was removed and frozen in a 2 mL centrifuge tube for assay by qPCR.
Temperature experiment
Juvenile rainbow trout (Troutlodge, Sumner, WA, USA) were exposed to the actinospore stage of C. shasta at 4 different temperatures (11, 14, 18 and 22 °C) to determine if there was a relationship between transmission rate and water temperature. Although this was a different species than the previous experiments, we assumed the transmission dynamics should not be different between the parasite and salmonid hosts. Effluent from infected colonies of the polychaete host was continuously collected into an 189 L aquarium. From this reservoir, 3–1 L samples were collected every hour for assay by qPCR to estimate parasite density. Water was pumped from the reservoir aquarium into 3–25 L fibreglass tanks using an Odyssea WP 500 water pump, at ∼0·5 L min−1. Twenty-four hours before each exposure, 30 rainbow trout were acclimatized to the desired temperature. Ten fish were randomly placed into each aquarium and exposed for 3 h. Elevated water temperatures were maintained using 2 submersible aquarium heaters in each replicate tank. Cooler water temperatures were maintained by placing 1 L and 2 L Nalgene® bottles of ice in both the replicate tanks and the reservoir aquarium. Temperatures were recorded every 30 min and control devices were adjusted to maintain a constant temperature. After each temperature trial, fish were immediately euthanized with MS-222. The left gill was removed and frozen in a 2 mL microcentrifuge tube for assay by qPCR.
Gill qPCR assay
Gills preserved in ethyl alcohol (EtOH) were air-dried overnight to allow the EtOH to evaporate before processing. The gill tissue was digested using 495 μL ATL and 5 μL Proteinase K in a shaker overnight at 37 °C. After digestion, all gill samples were processed for qPCR assay using the Qiagen Qiaquick PCR Purification kit and protocol (Valencia, CA, USA): 60 μL of genomic DNA was eluted. Samples were then assayed in duplicate using the qPCR protocol established by Hallett and Bartholomew (Reference Hallett and Bartholomew2006). If the difference between the duplicate samples was greater than 1 quantification cycle (Cq), the samples were re-assayed. In addition to a non-template control of molecular-grade water, 2 different positive controls were included on each plate; these also informed inter-plate variation.
To relate the qPCR output to actual number of actinospores detected on the gills, biologically relevant calibration standards were established by spiking unexposed gills with 1 and 8 actinospores. Actinospores were obtained by squashing an infected polychaete on a microscope slide and diluting the material with PBS. Then, under a microscope slide, spores were individually collected using a modified glass pipette (thin drawn) and capillary action and extruded into a microcentrifuge tube prior to extraction (Hallett and Bartholomew, Reference Hallett and Bartholomew2006). These calibration standards were analysed by qPCR, as described above, in triplicate, and fit with a logarithmic regression. Once C. shasta attaches to the gill, a binucleated sporoplasm penetrates into the epithelial cells (Bjork and Bartholomew, Reference Bjork and Bartholomew2010). The binulceate sporoplasm constitutes one-quarter of the DNA of the 8- nuclei actinospore (Hallett and Bartholomew, Reference Hallett and Bartholomew2006). From this assumption we multiplied the estimated number of actinospores, based on the calibration standards, by 4 to approximate the number of sporoplasms transmitted; this will be referred to throughout as parasites transmitted.
Predictive model
We constructed a statistical model to define a functional relationship between transmission rate, water velocity, water temperature and parasite density using data from all 3 h field exposures. The full model consisted of three main effects (average velocity, average parasite density and average exposure temperature) and pair-wise interactions between each term. A generalized linear model (GLM) was developed to identify which of the environmental parameters (velocity, parasite density or water temperature) and their interactions were most important with respect to the transmission rate. To achieve a more normalized distribution of values, we negative log-transformed the transmission rates. This model was developed using a Gamma distribution because our variances increased with increasing mean values. The best model was selected comparing Akaike Information Criterion (AIC) scores (Akaike, Reference Akaike1973; Burnham and Anderson, Reference Burnham and Anderson2002).
Data analyses
Statistical analyses were conducted using the R software package (2.14, R Development Core Team, 2011). The exposure dose for each trial was estimated from the product of the water velocity, the volume of water, and density of parasite in the water as determined by qPCR assay. In each experiment we quantified 2 metrics: total parasites transmitted – the number of sporoplasms in the gill based on estimates from the calibration standards; and transmission rate – estimated for each fish from the number of parasites transmitted to the gill divided by the total actinospore dose. The prevalence of infection (POI), based on parasite detection on the gills, was also calculated for each experiment. All estimates of parasites transmitted and transmission rates were normalized by a log transformation prior to statistical analyses and back-transformed for display in tables and figures. One-way ANOVAs were used to determine differences in exposure dose, parasites transmitted and transmission rates among treatments for each experiment.
RESULTS
Calibration standards
Three sets of C. shasta-negative gills were spiked with 1 or 8 actinospores and analysed by qPCR to translate the sample values to actual parasite numbers. There was minimal variation between the replicate samples; the average Cq value of 1 actinospore per gill was 35·2±0·5 and 8 actinospores per gill was 33·0±0·2. The data were best represented as a logarithmic relationship (Eq. 1) between the Cq and the number of parasites spiked onto the gill standards, with an adjusted R 2=92·8%. As we assume that a sporoplasm has the same DNA as a quarter of an actinospore, we back calculated using Eq. 1 to estimate the Cq value of a single sporoplasm (36·6). We rounded this up to 37 then added an extra cycle to establish our positive sample threshold: a sample with a Cq value greater than 38 was considered negative for parasite DNA (uninfected). The positive controls indicated minimal variation; average Cq=34·9±1·2 s.d. and the coefficient of variation among plates was 3·5%.
 $${\rm Actinospores} = 10^{({\rm C}_q - 35.16)/ - 2.4102} $$
Effects of exposure duration
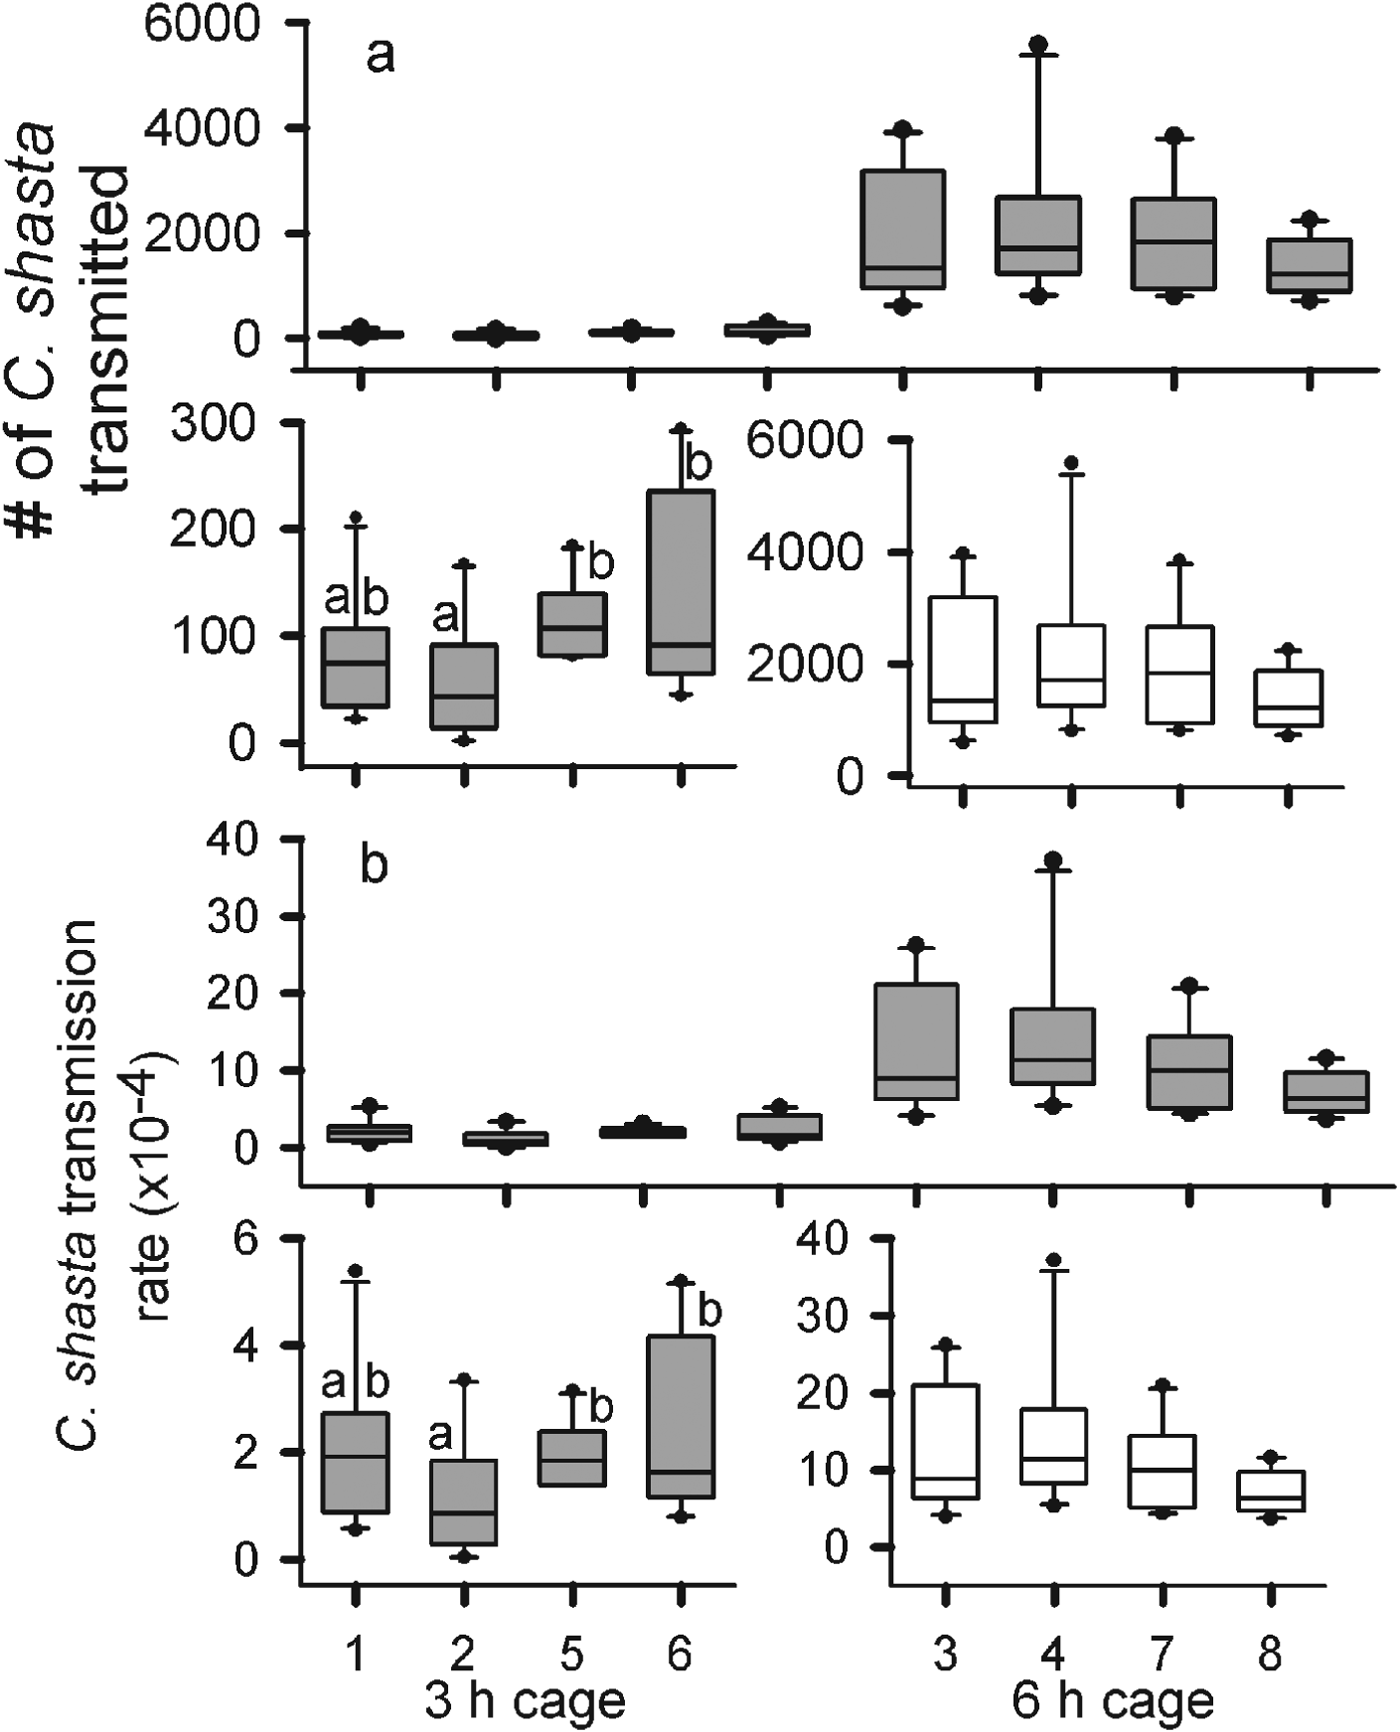
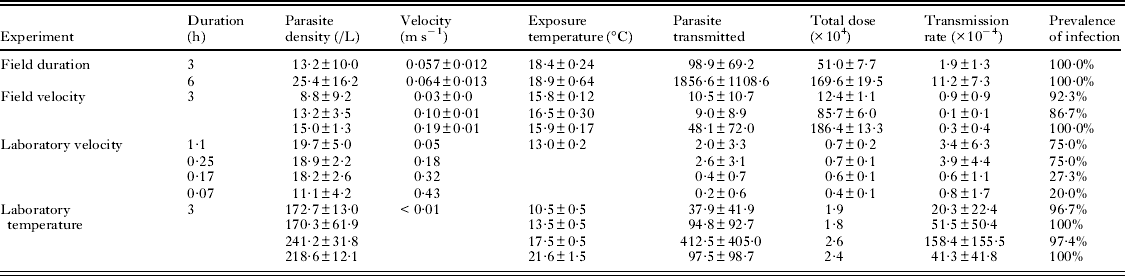
The average hourly parasite density during the 3 h exposure, as estimated from qPCR assay of water collected during exposure, was 13·2 parasites L−1. For the remaining 3 h of the 6 h exposure, the average density nearly tripled to 37·6 parasites L−1 for an hourly average of 25·4 parasites L−1 for the 6 h exposure. Velocities in the cages ranged from 0·05 to 0·07 m s−1. Given the longer exposure and higher parasite density, there was a difference of almost 2 orders of magnitude in the average number of parasites transmitted to the gills of the fish exposed for 6 h (1·2×104 parasite) compared with fish exposed for 3 h (1·0×102) (F 1=281·5, P<0·0001) (Table 1, Fig. 1). There was no difference in the number of parasites transmitted among the 6 h cages (F 3=0·866, P=0·4680). There was a difference in parasites transmitted among the 3 h cages (F 3=4·884, P=0·006) due to differences observed between cage 2 and cages 5 and 6 (Fig. 1a).
The number of Ceratomyxa shasta transmitted (a) and the transmission rates (b) for Chinook salmon (Oncorhynhcus tshawytscha) exposed for 3 and 6 h in the Klamath River. For each, the top graph shows an overall comparison between exposure durations and the bottom graphs are scaled to show differences among cages for each duration. The solid lines are the medians, the boxes cover the inter-quartile range, the bars the 5–95% ranges, and the dots are outside 2 s.e. Letters represent statistically significant detected differences by Tukey comparison of the means (α=0·05).

Average values and standard deviations of all biotic and abiotic factors measured in all four experiments
There was also a difference in transmission rate among cages exposed for 3 h (F 3=4·083, P=0·0136), as transmission estimated in cage 2 was again lower than the other cages (Table 1). There was no difference in the transmission rates among the 6 h cages (F 3=1·008, P=0·4). The estimated average transmission rate was almost 20-fold higher for the 6 h than the 3 h exposure (F 1=111, P<0·0001) (Fig. 1b). A total of 5 fish from all cages died from C. shasta infections, 2 from the 3 h exposure and 3 from the 6 h. Although there was a doubling of parasite density over the last 3 h of exposure, the number transmitted and transmission rates estimated for the 6 h cages were more than double those of the 3 h cages, suggesting that transmission was not constant over time.
Effects of water velocity
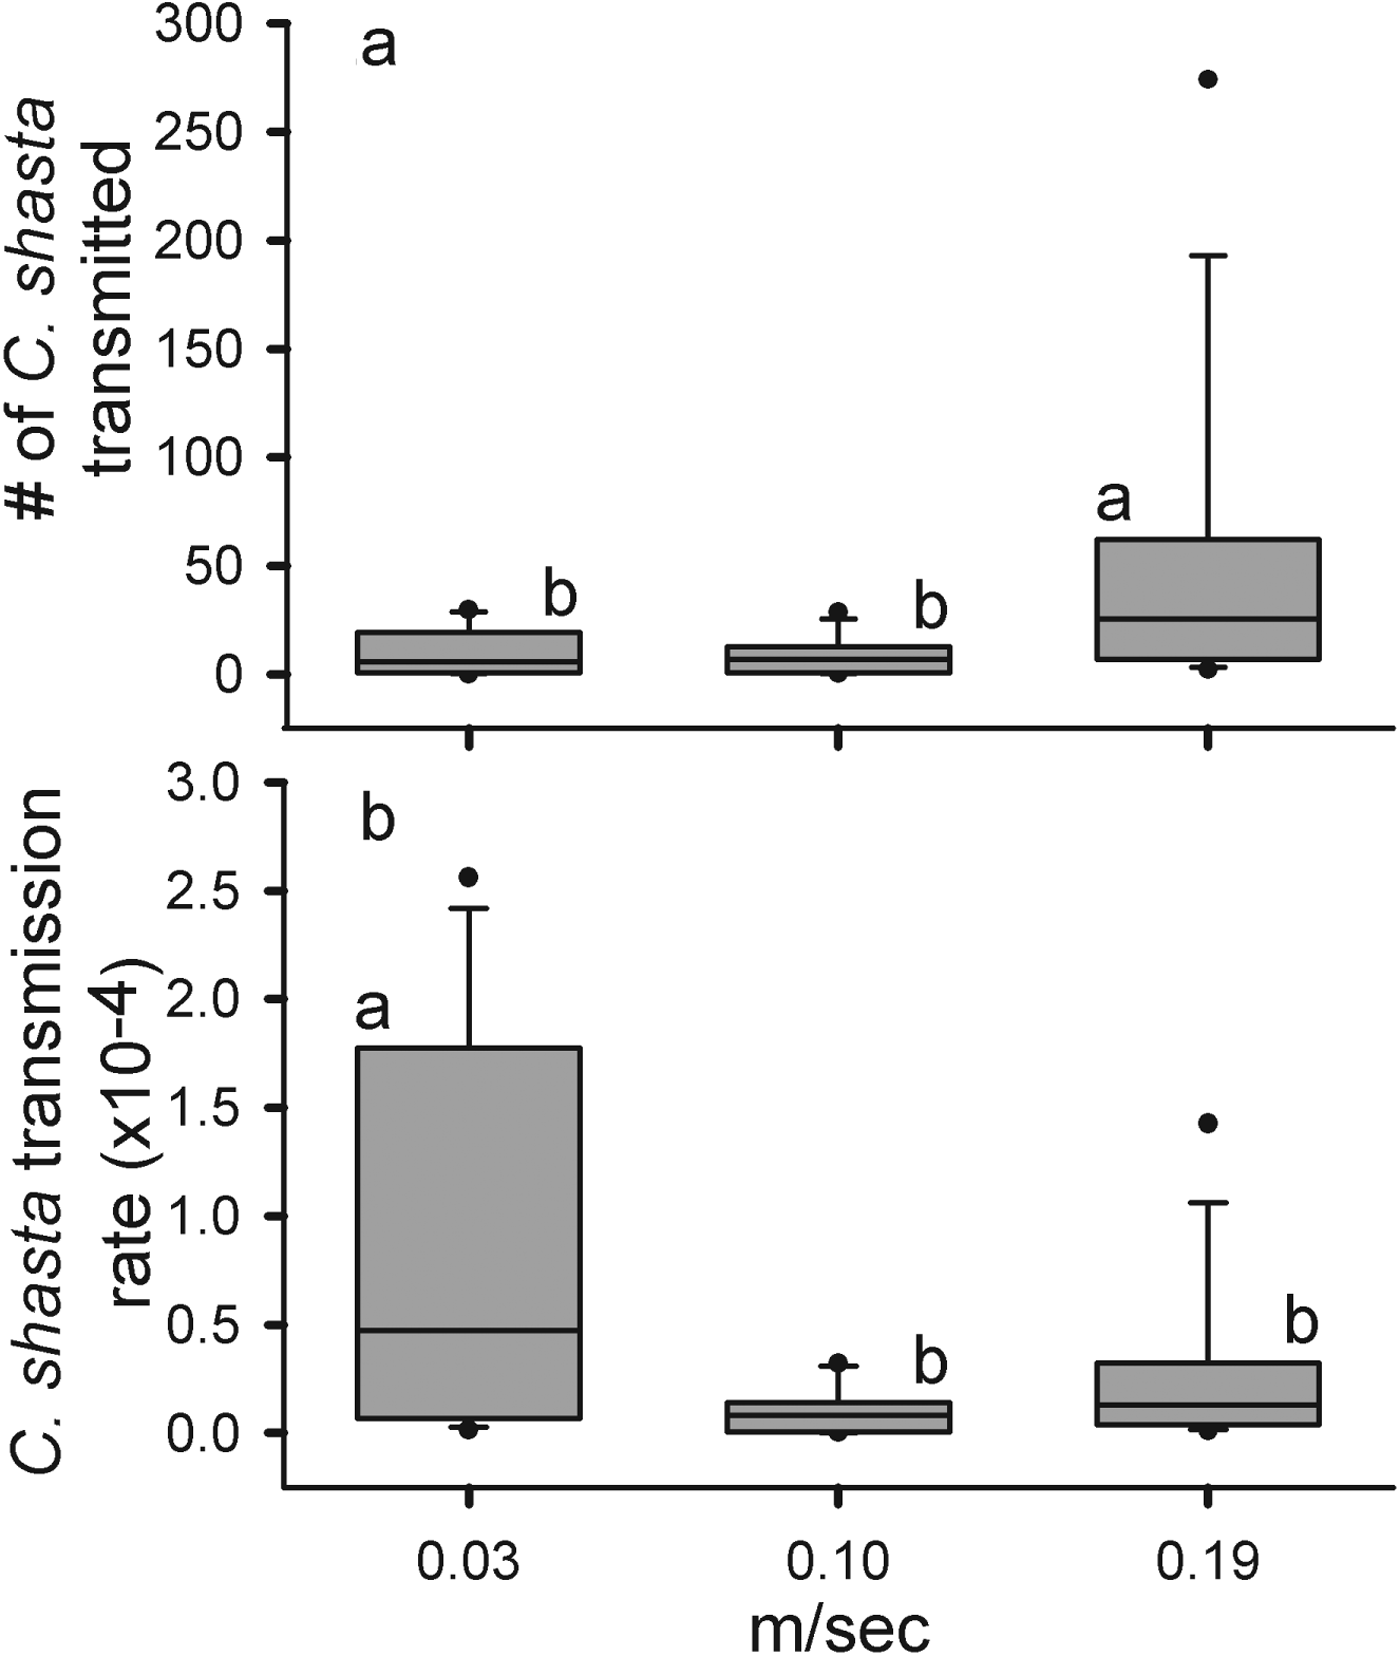
In the field study, average parasite density increased as velocity increased, but we did not detect differences among treatments (F 2=0·928, P=0·446) (Table 1, Fig. 2). Among the 3 cages at each velocity, there was no difference either in the number of parasites transmitted (Fs2=0·118, P=0·89, Fm2=0·512, P=0·612, Ff2=1·024, P=0·389) or in the transmission rate (Fs2=0·224, P=0·803, Fm2=0·652, P=0·539, Ff2=1·01, P=0·393). More parasites were transmitted at the faster velocity compared with the slow and medium velocities (F 2=4·229, P=0·0212) (Fig. 2a). Although the average number of parasites transmitted differed by 3-fold between the slow and fast velocity trials, the transmission rate was highest at the slow velocity (F 2=6·404, P=0·0038) (Fig. 2b). These results suggest an inverse relationship between velocity and transmission rate of C. shasta, yet they might be confounded by the large differences in exposure dose among the different velocities.
The number of Ceratomyxa shasta transmitted (a) and transmission rates (b) for Chinook salmon (Oncorhynchus tshawytscha) exposed to the parasite at 3 different velocities (0·03, 0·10 and 0·19 m s−1s) in the Klamath River. The solid lines are the medians, the boxes cover the inter-quartile range, the bars the 5–95% ranges, and the dots are outside 2 s.e. Letters represent statistically significant differences detected by Tukey comparison of means (α=0·05).
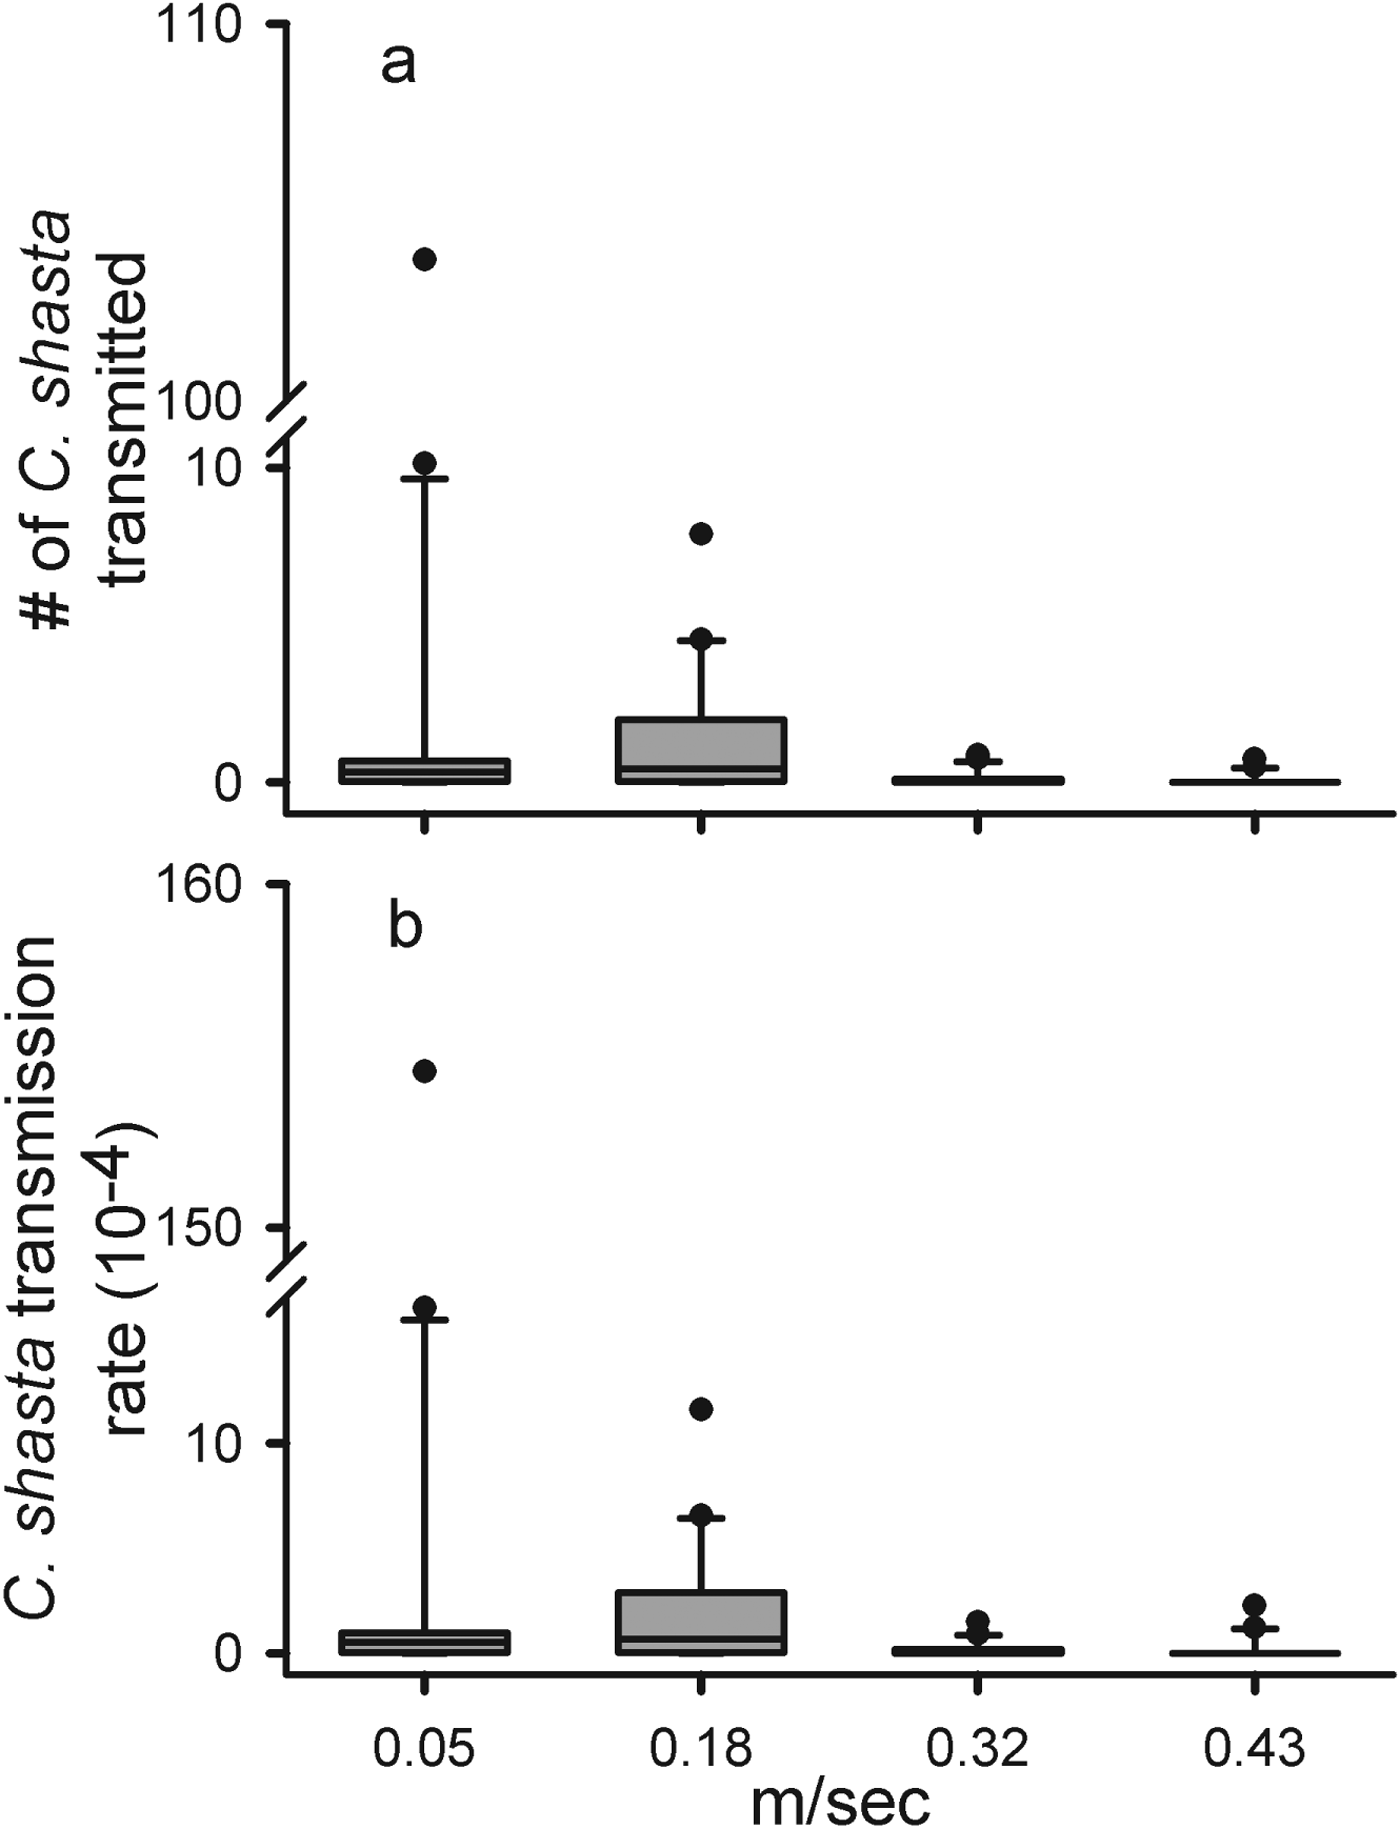
Even under laboratory conditions, holding the dose constant among the different velocities proved difficult and parasite densities of the 0·05, 0·18 and 0·32 m s−1 were nearly double that of the 0·43 m s−1 trial (F 3=25·18, P<0·0001). However, this difference (3·90–6·90×103) was much smaller than that observed in the field experiment (0·12–1·86×106) (Table 1, Fig. 3). The total number of parasites transmitted differed between velocities (F 3=10·55, P=<0·0001) and was higher at the slower velocities compared with the faster velocities (Fig. 3a). Not only were fewer parasites transmitted at higher velocities, but the POI was almost 3-fold lower at the higher velocities (27 and 20%) than at the slower velocities (75% at both lower velocities). The average transmission rates were greatest and approximately equal at 0·05 and 0·18 m s−1 and decreased at the 2 higher velocities (F 3=9·226, P<0·0001) (Fig. 3b). As the doses were more consistent in the laboratory trials, we were able to directly observe an inverse relationship between velocity and transmission. We also identified a threshold between 0·18 and 0·32 m s−1 where transmission efficiency was greatly reduced.
The number of eratomyxa. shasta transmitted (a) and transmission rates (b) for Chinook salmon (Oncorhynchus tshawytscha) at 4 different velocities (0·05, 0·18, 0·32 and 0·43 m s−1) in a laboratory challenge. The solid lines are the medians, the boxes cover the inter-quartile range, the bars the 5–95% ranges, and the dots are outside 2 s.e.
Effects of water temperature
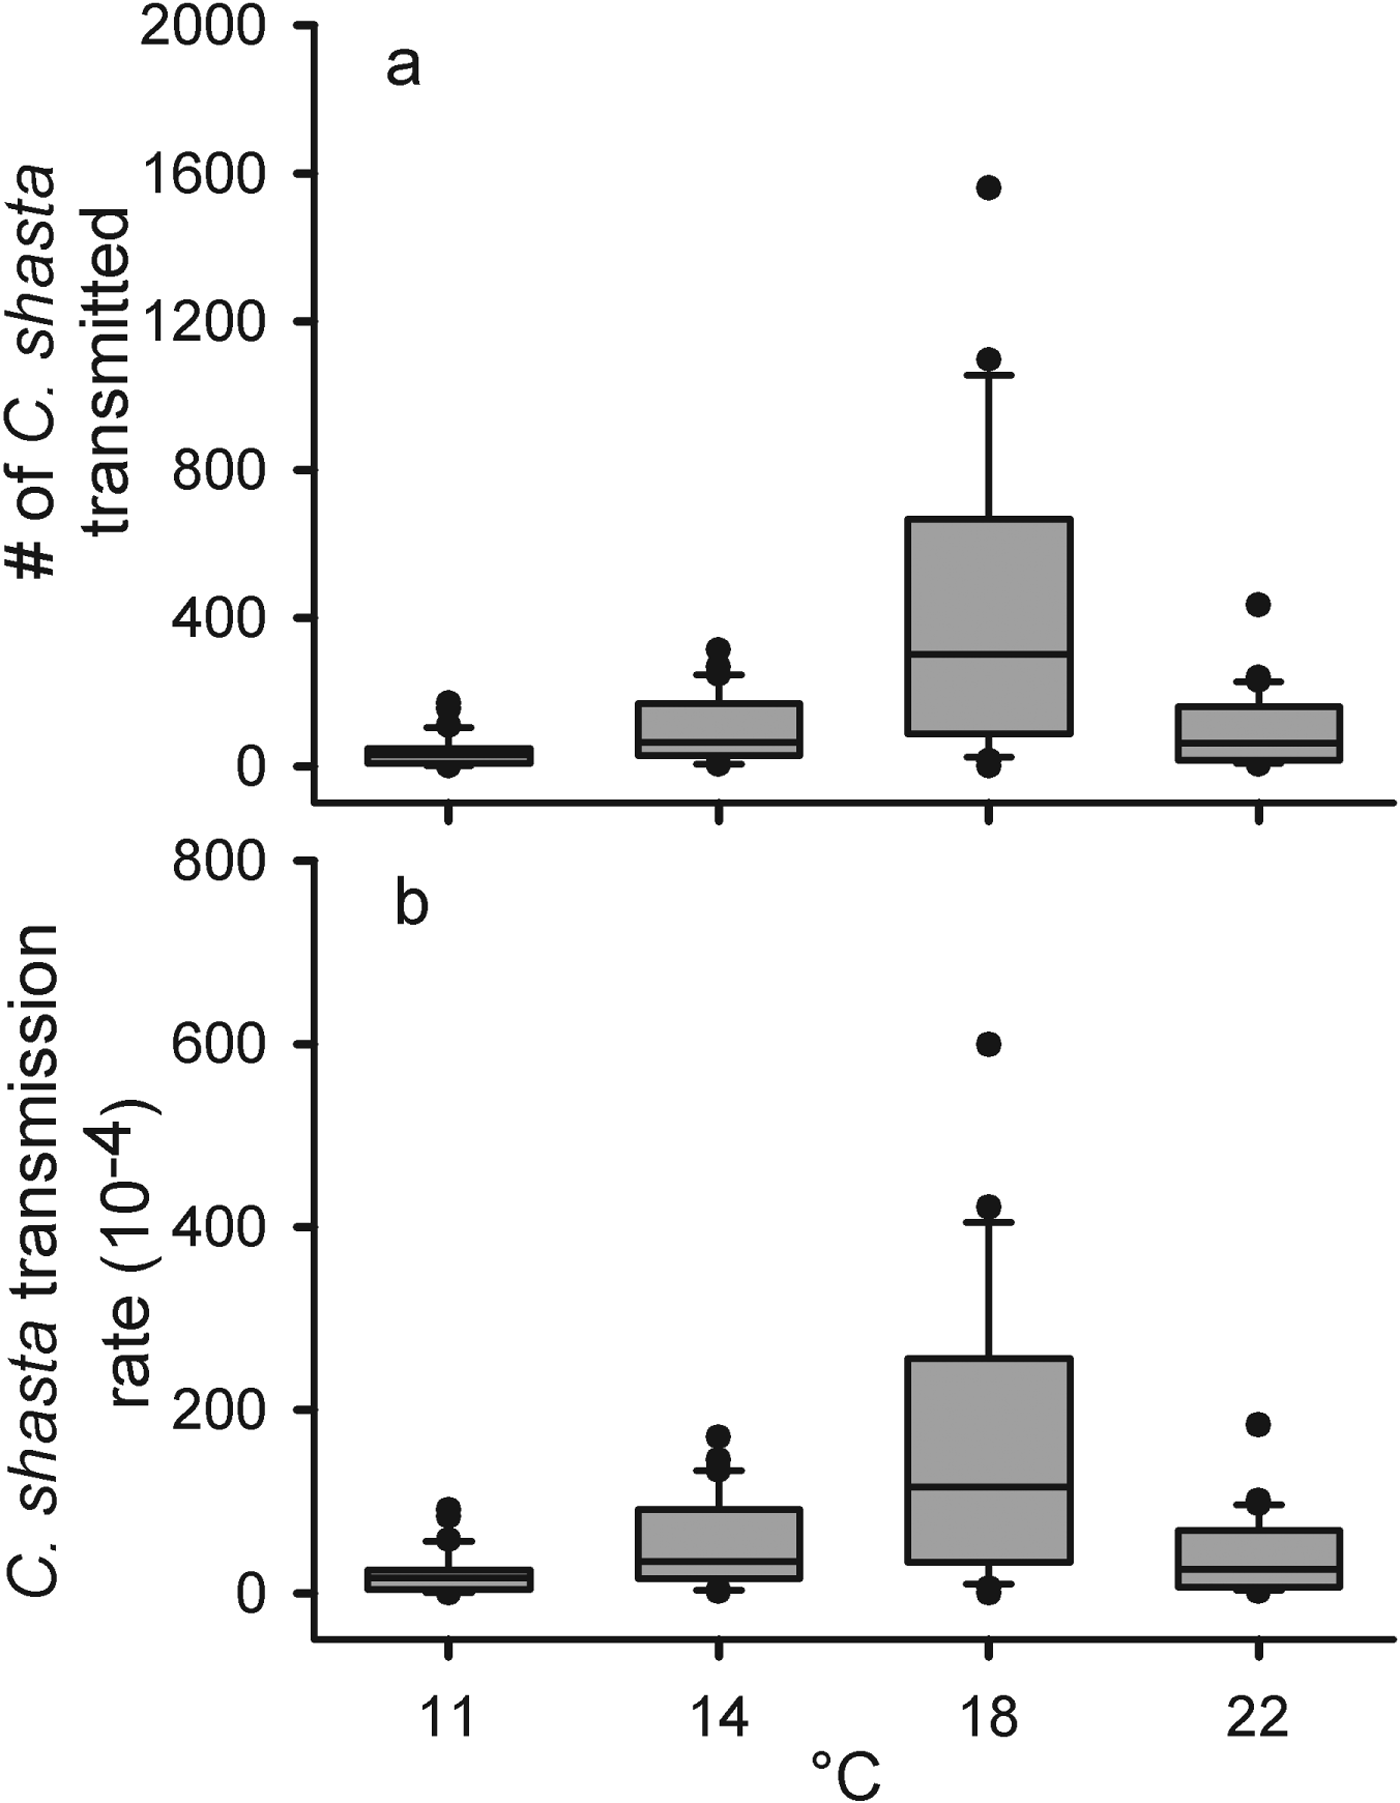
Densities ranged from 170 to 241 parasites L−1 and we did not detect differences in parasite density among temperature treatments (F 3=2·846, P=0·105) (Table 1, Fig. 4). The total number of parasites transmitted was low in the 11 °C, intermediate in the 14 and 22 °C and high in the 18 °C treatments (F 3=10·78, P<0·0001) (Fig. 4a). As with total parasites transmitted, there was a difference in transmission rates among the temperature groups (F 3=11·03, P<0·0001) (Fig. 4b). The highest transmission rate occurred in the 18 °C group and, interestingly, the 14 and 22 °C groups had very similar mean transmission rates. Both parasites transmitted and transmission rate appear to be maximized around 18 °C.
The number of Ceratomyxa shasta transmitted (a) and transmission rates (b) for rainbow trout (Oncorhynchus mykiss) at 4 different temperatures (11, 14, 18 and 22 °C) in a laboratory challenge. The solid lines are the medians, the boxes cover the inter-quartile range, the bars the 5–95% ranges, and the dots are outside 2 s.e.
Predictive model
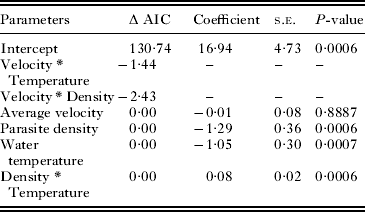
The full model had 7 parameters, including the intercept (Table 2) and an AIC score of 130·74. The final model had 4 parameters with a similar AIC value to the full model (127·47). This final model consists of the main effect terms parasite density (P<0·0001) and exposure temperature (P<0·0001), and the interaction between parasite density and exposure temperature (P<0·0001). Although water velocity was not a significant parameter (P=0·8887) it was left in the model as it was a parameter of interest, and removing this parameter did not significantly improve the AIC score (125·5). This model explains 71·9% of the variation observed, suggesting that there are other factors that influence the transmission rate that are not addressed in this model.
Summary of parameters dropped from global model and coefficients of significant parameters for final model predicting log (transmission)
Transmission determination
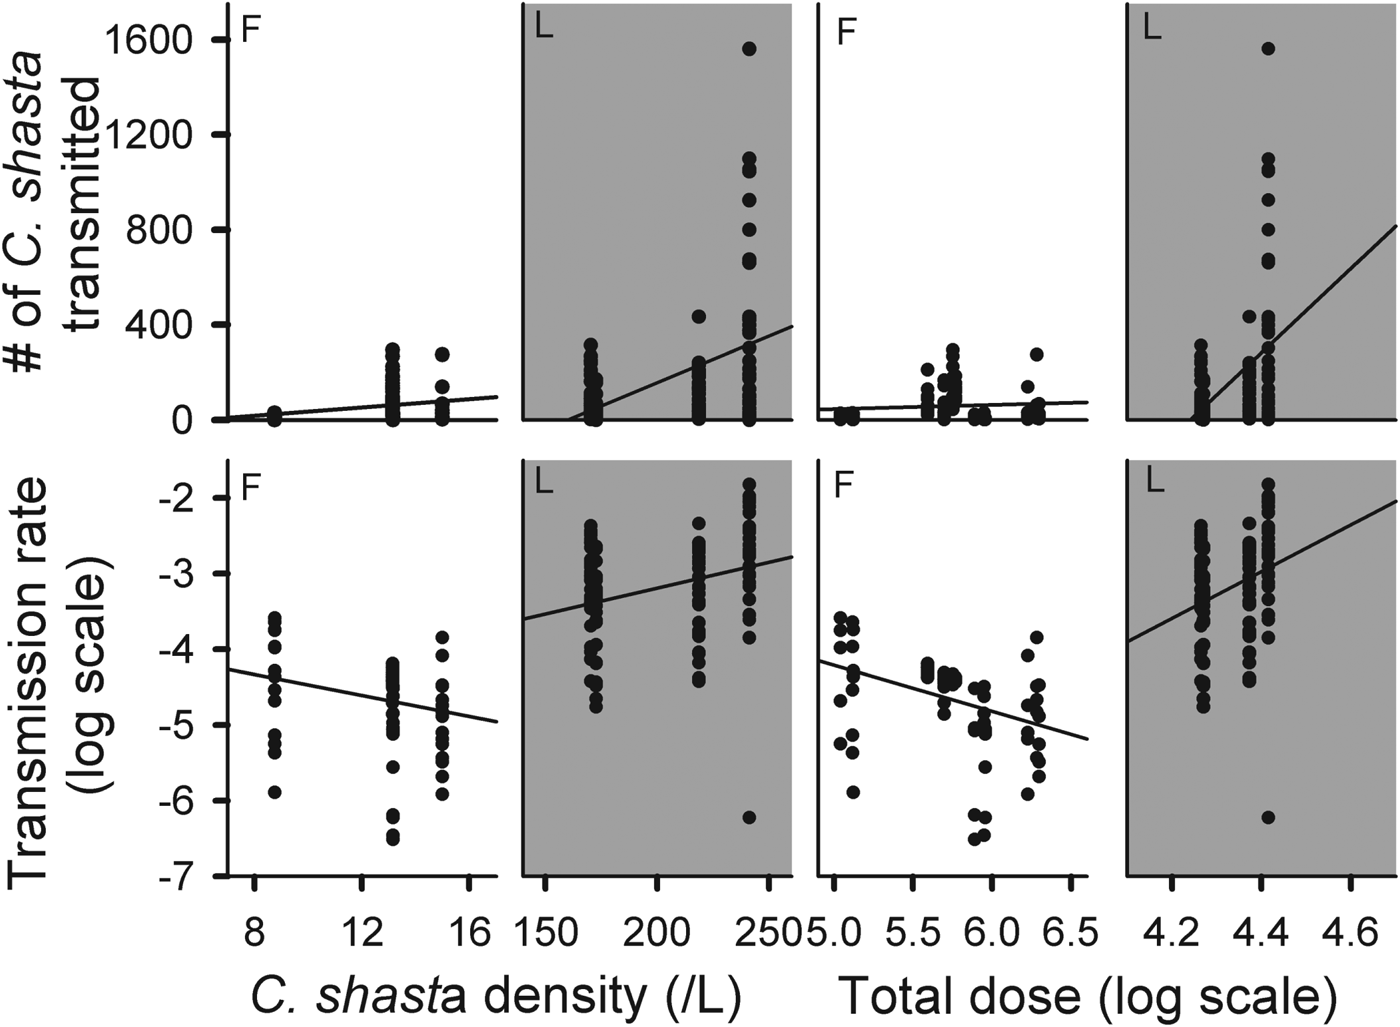
We attempted to define the transmission process for the actinospore stage of C. shasta by comparing the number of parasites transmitted and transmission rates against density and exposure dose (Fig. 5). Since transmission did not appear to be constant over time, observations were standardized by using the experimental results from the 3 h exposures only. The number of parasites attached increased with increasing density in both field and laboratory experiments.
Comparison of parasites transmitted (top row) and transmission rate (bottom row) with parasite density (left) and log total dose (right) for all 3 h field (F) and laboratory (L) exposures.
DISCUSSION
Transmission is one of the key parameters of the basic reproductive number (R 0), yet there are few pathogens of wildlife populations for which it has been directly measured. We quantified a range of transmission rates of the actinospore stage of the myxozoan parasite C. shasta to the salmonid host and defined a functional relationship between transmission and biotic (parasite density) and abiotic factors (water velocity and temperature). Through a series of field and laboratory experiments we determined that water velocity was inversely related to transmission and that there was an optimal temperature range for transmission, around 18 °C.
Our prediction of an inverse relationship between water velocity and transmission rate was supported in both the field and the laboratory experiments. The true transmission rates in the field study were obscured because exposure dose increased with velocity. There was almost a 7-fold increase in the average dose between the slow and medium velocities and over a 15-fold increase between the slow and fast velocities. In the laboratory experiment we were able to control the exposure dose and better observe the inverse relationship between velocity and transmission. This inverse relationship has been observed for other host–pathogen systems (Barker and Cone, Reference Barker and Cone2000; Bodensteiner et al. Reference Bodensteiner, Sheehan, Wills, Brandenburg and Lewis2000). For another myxozoan parasite, Myxobolus cerebralis, Hallett and Bartholomew (Reference Hallett and Bartholomew2008) observed decreased disease severity, a proxy for transmission, in rainbow trout (Oncorhynchus mykiss) in experimental channels with higher velocity (0·02 m s−1) than in channels with slower velocity (0·002 m s−1). Rowan and Gram (Reference Rowan and Gram1959) found higher transmission rates of Schistosoma mansoni at slow velocities; however, as velocities increased above 1·30 m s−1 transmission rates declined (Radke et al. Reference Radke, Ritchie and Rowan1961). We also observed a velocity threshold as both the transmission rate and POI dramatically decreased between 0·18 and 0·32 m s−1. This suggests that fish (i.e. larger or older) that spend more time in the thalweg of the channel, where flows are >0·3 m s−1, may become less heavily infected than those that inhabit areas of slower velocities (e.g. proximal to banks, slow flowing pools, etc.).
We hypothesized that increasing water temperature would cause an increase in transmission as a function of increased ventilation of the fish at higher temperatures. Increased ventilation would cause more water to move over the gills, increasing the number of actinospores potentially contacting the gill surface. Although this hypothesis was not fully supported, we did define an optimal temperature for transmission (around 18 °C). The presence of an optimal thermal range for C. shasta transmission is consistent with many other parasites with free-living stages (Anderson et al. Reference Anderson, Mercer, Wilson and Carter1982; Evans, Reference Evans1985; Pietrock and Marcogliese, Reference Pietrock and Marcogliese2003). There is also evidence of this thermal optimum for the parasite within the fish host; Ray et al. (Reference Ray, Holt and Bartholomew2012) observed consistently higher C. shasta-induced mortality in Chinook that were reared at 18 °C than at 13 °C. In the present study, when fish were held at 18 °C, nearly 4-fold more parasites were detected than in those fish held at 14 or 22 °C, suggesting some additional indirect effects of temperature on the host–parasite dynamics. Increased temperatures have been shown to reduce the salmonid host immune response (Richter and Kolmes, Reference Richter and Kolmes2005) and the viability of the actinospore (Markiw, Reference Markiw1992; El-Matbouli et al. Reference El-Matbouli, McDowell, Antonio, Andree and Hedrick1999), but it can also potentially increase the replication rate of a pathogen within a host, all indirectly affecting the transmission rate.
There was no support for our hypothesis that attachment rate would be constant with respect to exposure duration. Rather than a linear relationship between the 3 and 6 h exposures, the number of parasites transmitted was 3–9 times greater than predicted, even when accounting for the 3-fold increase in parasite density during the last 3 h of exposure. If transmission was constant, independent of density, then a 2-fold increase in the number of parasites transmitted would be expected. If we assume some relationship with density, then we would expect to see 6-fold higher parasites attached (2x for the duration and 3x for the increased density). Thus, either transmission was not constant or some other factor (e.g. underestimation of exposure dose, in-host replication) affected these values.
As a result of the challenges experienced conducting the field experiments (i.e. inconsistent parasite densities, large differences in exposure doses), we attempted to minimize confounding factors in the laboratory studies. However, one of the factors we were unable to account for was replication of the parasite in the gill tissue. The effects of this replication may contribute to variation in transmission rates observed in the duration and temperature experiments. For a similar myxozoan parasite, M. cerebralis, replication within the salmonid host occurred within 10 min of penetration, and peak replication occurred between 2 and 4 h post-exposure (Markiw, Reference Markiw1989; El–Matbouli et al. Reference El-Matbouli, Hoffmann and Mandok1995). If C. shasta has similar timing of replication then this could explain the 2 orders of magnitude difference between the 3 and 6 h exposed fish. It has also been suggested that higher temperatures affect parasite replication within the salmonid host (Bartholomew, Reference Bartholomew1998). In the temperature experiment, the number of parasites transmitted in the 18 °C group was almost 4-fold higher than in the adjacent temperature groups, providing some evidence that 18 °C may be a thermally optimal temperature for both replication and transmission in rainbow trout. Additionally, the only difference between the 3 h duration experiment and the 2 slower velocities from the field exposures was that the water temperature during the duration experiment was ∼2 °C warmer (18 °C); yet the estimates of parasites transmitted were an order of magnitude higher.
Because of the uncertainty about the effects of in-host replication, the predictive model was developed only using data from the 3 h field exposures of Chinook salmon (duration and velocity experiments). As expected, water temperature and parasite density were both significant parameters for transmission; however, water velocity was not. The lack of significance of water velocity was unexpected and we feel this is most likely due to the very limited range of velocities used (0·03–0·19 m s−1), which do not exceed the potential threshold observed in the laboratory challenge.
Identifying the transmission process (frequency or density dependent) is vital to understanding host–pathogen dynamics, not only for improving model accuracy, but also for applying the model to other systems (Thrall et al. Reference Thrall, Biere and Uyenoyama1995; McCallum et al. Reference McCallum, Barlow and Hone2001). We observed patterns indicative of both types of transmission processes, dependent on the scale of observation. In the laboratory experiment, transmission rate was positively correlated with both parasite density and exposure dose, which suggests density-dependent transmission. However, this pattern may not be truly indicative of natural transmission, as the densities in the laboratory experiment exceeded all field measurements (Hallett et al. Reference Hallett, Ray, Hurst, Holt, Buckles, Atkinson and Bartholomew2012; Ray et al. Reference Ray, Holt and Bartholomew2012). McCallum et al. (Reference McCallum, Barlow and Hone2001) discuss the difficulties in applying transmission rates or patterns identified from small-scale homogeneous experiments to large-scale heterogeneous landscapes. Our controlled laboratory studies identified important relationships between transmission, water velocity and water temperature, but direct extrapolation of these rates to a natural river would be unrealistic because of the high parasite densities achieved in the laboratory. The field experiments were more representative of the natural conditions encountered by juvenile salmonids, and the patterns observed in these studies suggest that the in-river transmission of the actinospore to the salmonid host is frequency dependent. Although tentative, this is an important observation as it has been shown that frequency-dependent transmission nullifies the importance of the host density threshold for a pathogen to persist within a population (Getz and Pickering, Reference Getz and Pickering1983).
In the Klamath River in California , C. shasta infections have been linked to high mortality rates in emigrating juvenile salmon and reduced abundance of returning adults (Fujiwara et al. Reference Fujiwara, Mohr, Greenberg, Foott and Bartholomew2011). Although both water velocity and temperature affect the transmission dynamics of C. shasta, velocity is the more crucial environmental factor and also potentially easier to manipulate in this system. Thus, fish that can tolerate higher velocities (>0·3 m s−1) could experience lower transmission of the actinospore stage. The range of estimated transmission values and the predictive model based on velocity, density and temperature will be incorporated into the epidemiological model to provide improved simulations of disease dynamics under different environmental conditions (Ray et al. Reference Ray, Rossignol and Bartholomew2010).
ACKNOWLEDGEMENTS
We would like to thank Matt Stinson and Charlene Hurst for assistance with field experiments. Thanks to Gerri Buckles, Kourtney Hall, Taylor Derlacki and Jamie Green for processing the gill tissues and water samples. Thanks to Dr Julie Alexander and Dr Sascha Hallett for insight and comments on this manuscript. We thank the staff at California Department of Fish and Game – Iron Gate Hatchery for providing the Chinook salmon and the owners of Fisher's R. V. Park for providing us secure access to the Klamath River throughout this study.
FINANCIAL SUPPORT
Funding for this project was provided by the Bureau of Reclamation through Cooperative Agreement R09AC20022, Cooperative Ecosystems Study Unit 3FC810873.