





Impact statements
As the global water crisis continues to intensify, questions of water wastage and conservation are becoming increasingly important. This case study explores the application of sonification, the representation of data through sound, as a decision support system for manual irrigation tasks. Sonification is intended to provide information about soil-moisture levels to help support decision-making aimed at reducing the risk of runoff and deep percolation during the manual irrigation of shallow-rooting plants. A prototype system is explored in which soil-moisture data are converted into sound to provide both real-time feedback during irrigation tasks and to provide retrospective information on patterns of relative change in soil moisture over time.
This case makes the argument for the application of sonification in water research more generally by demonstrating how it can be designed to support the interpretation of rich and dynamic water-related data and provide information during manual irrigation. Sonification does not seek to replace visual methods but rather to complement and extend them by providing an additional layer of information that can help to support a user in achieving their irrigation objectives when visual attention is preoccupied with the task of manual irrigation. Thus, sonification may have practical value as an additional tool for supporting decision-making and interpreting environmental data.
Introduction
In early 2026, the United Nations declared that the world had entered an era of ‘global water bankruptcy’ (Madani, Reference Madani2026). This rapidly unfolding global water crisis (UN Water, 2026) is driven by factors like climate change and compounded by inadequate water infrastructure and, critically for this case study, inefficient irrigation practices. Roughly 72% of global freshwater withdrawals are accounted for by agriculture (Hernandez Lagana and Mejias Moreno, Reference Hernandez Lagana and Mejias Moreno2025). However, much of this water is wasted through surface runoff, where water fails to soak into the soil, and deep percolation, where water moves below the root zone of a given plant species. These factors account for 40% of water diverted for irrigation at the farm level (Food and Agriculture Organization of the United Nations, n.d.). Roughly 5.52 billion people are living in water-insecure countries (MacAlister et al., Reference MacAlister, Baggio, Taing, Qadir, Perera and Smakhtin2023), while 4 billion experience severe water scarcity for at least 1 month every year (UNESCO, 2023).
Under such global conditions, there is an urgent need to improve the efficiency of irrigation practices. Efficient, accurate and reliable interpretation of soil-moisture readings may support improved conservation of water resources. Research in water usage for irrigation and related contexts increasingly contends with rich time-series data sources across a multitude of scales, often with a focus on monitoring processes across a number of inter-related levels from basic water chemistry to automated irrigation systems (Jenkins and Block, Reference Jenkins and Block2024; Oğuztürk, Reference Oğuztürk2025). Decision support systems have become increasingly important in irrigation contexts where good watering practices can contribute to effective management of water resources. Recent research exploring decision support systems for irrigation contexts tended to rely on visual dashboards to present data from broader automated systems for irrigation and water management (Todorović et al., Reference Todorović, Ivković, Kordić, Dimitrieski and Luković2018; Htun et al., Reference Htun, Rojo, Ooge, De Croon, Kasimati and Verbert2022; Araújo et al., Reference Araújo, Peres, Filipe, Manta-Costa, Lidon, Ramalho and Barata2023; Amini et al., Reference Amini, Emami and Dehghanisanij2025). Many of these systems are focused on irrigation scheduling, sensor networks at farm-scale and the integration of soil data with additional measurements (Soulis et al., Reference Soulis, Elmaloglou and Dercas2015; Navarro-Hellín et al., Reference Navarro-Hellín, Martínez-del-Rincon, Domingo-Miguel, Soto-Valles and Torres-Sánchez2016; Flores Cayuela et al., Reference Flores Cayuela, González Perea, Camacho Poyato and Montesinos2022; Hamouda et al., Reference Hamouda, Puig-Sirera, Bonzi, Remorini, Massai and Rallo2024).
Sonification, the representation of data through sound, has emerged in recent years as a useful tool across a diversity of water-related contexts, including the tracking of water resource consumption (Seznec and Pauletto, Reference Seznec and Pauletto2022), the quantification of drought-related impacts (Han, Reference Han2017), the representation of wetlands transformation (Angeler et al., Reference Angeler, Alvarez-Cobelas and Sánchez-Carrillo2018) and to analyse and understand the water cycle (Woo et al., Reference Woo, Richards, Selker and Udell2023) and how it relates to water scarcity (Rustad et al., Reference Rustad, Cortada, Quinn, Hallett, Alexandra, Jay Stratton and Gerd2018). The sonification of plant biosignals and soil data (Hu et al., Reference Hu, Chou and Kakehi2023; Kurundkar et al., Reference Kurundkar, Lathiya, Kurade, Likhitkar and Lokhande2023), as well as the conversion of these data into music, has also been explored (Suchánek, Reference Suchánek2020; Miller and Cox, Reference Miller and Cox2024), albeit outside of a decision support context. Critical for the current case study, however, is the fact that auditory displays have been shown to provide useful information in tasks where visual attention is substantially preoccupied by demanding tasks (Wickens et al., Reference Wickens, Goh, Helleberg, Horrey and Talleur2003; Karimi et al., Reference Karimi, Mondor and Mann2008). Yet task-oriented sonification remains underexplored as a complementary decision support system for manual irrigation contexts. To this end, the current case study explores this approach to sonification as a near-surface soil-moisture monitoring interface for shallow-rooting plants. The system is intended to provide decision support for manual irrigation tasks where monitoring in both real-time and retrospective contexts can help to achieve irrigation objectives.
Case study implementation
Design rationale
The prototype is designed for the manual irrigation of shallow-rooting plants in scenarios where the users’ visual attention must remain fully focused on the often delicate task of watering. In such contexts, sonification can become a useful decision support tool, providing an additional layer of information that can be processed by a user without requiring them to remove their visual attention from the irrigation task. To this end, the prototype operates in a live mode that renders moisture changes audible in real time, providing moment-to-moment feedback on the watering process. For example, during the manual watering of shallow-rooting plants, changes in pitch and timbre let the user know when water is reaching the soil surrounding the probe. Thus, the user can monitor the watering process visually, while simultaneously hearing what is happening below the surface of the soil. Sonification, however, is especially well suited to identifying patterns and trends in time-series data (Walker and Nees, Reference Walker, Nees, Hermann and Neuhoff2011). As such, a sonification of logged sensor values provides additional retrospective information on changes in moisture levels over longer timescales. Although the live mode is designed to provide moment-to-moment information to guide adjustments during the manual irrigation process, the logged mode allows for the analysis of broader trends that can inform higher-level decision-making about how best to allocate and schedule watering resources. Together, these modes are intended to provide complementary forms of information for manual irrigation tasks. The technical details of the implementation explored here have been reported in detail elsewhere (Roddy, Reference Roddy2025a). The case study presented here makes a distinct contribution by examining the prototype design from a decision-support perspective. It describes the design rationale for the prototype with reference to the water irrigation tasks for which it was developed, as opposed to the purely technical factors involved in its implementation. Further, it provides a critical appraisal of the limitations of the design, and it develops recommendations for the use of sonification in water-monitoring contexts. This prototype is concerned with the manual irrigation of shallow-rooting plants and its application to larger-scale agricultural and industrial contexts remains the subject of future work.
Prototype iteration 1
Prototype development involved two distinct stages. The first prototype was developed as a cost-effective proof of concept to explore the feasibility of mapping real time moisture sensor data to acoustic parameters on embedded hardware in a low-resource environment. Previous research had demonstrated how Frequency Modulation (FM) synthesis can be used to sonify data from environmental sensors (Roddy, Reference Roddy2024). Developed in the digital domain by John Chowning (Reference Chowning1977) in the late 1970s, FM synthesis produces complex sounds by varying the input frequency of one oscillator with the output of another. The algorithm is computationally efficient and thus suited to low-resource environments. The prototype collected moisture data with an MH-series hygrometer, which was then passed to an Arduino Uno R3 to be sonified with FM synthesis techniques and played back over a 5 W 4 Ohm speaker. While it demonstrated the feasibility of a basic pipeline that converts soil-moisture values to sonified data, there were, of course, severe limitations in terms of processing power, audio quality and sound intelligibility, as FM synthesis proved challenging to implement as the ATMEGA328P chip could only produce a single 9-bit channel of audio at a 31.25 kHz sample rate. Moreover, the wide range of timbral possibilities provided by FM synthesis were not needed for the sonification of a single data stream.
Prototype 2
Prototype 2 was developed to address requirements emerging from the development of the proof-of-concept, as well as those surfaced by task analysis. Table 1 relates each of these requirements to the feature implemented to address it in Prototype 2. It also includes the rationale for the feature and, finally, the limitations that nonetheless remain after feature implementation.
Application and design requirements identified through task analysis and development of a proof-of-concept prototype, corresponding features implemented in Prototype 2, supporting rationale for these features, along with limitations and future work

Table 1. Long description
A table of application and design requirements identified through task analysis and development of a proof-of- concept prototype, corresponding features implemented in Prototype 2, supporting rationale for these features, along with limitations and future work
Drawing from learnings with the first prototype iteration, a second iteration was developed to address key requirements outlined in Table 1. These included the need for (i) high-quality real-time audio to (ii) support hearing in noisy environments, (iii) fix the mismatch between the data and sound synthesis techniques and (iv) support the sonification of logged data. The second prototype iteration was built with a Raspberry Pi Pico 1 (Raspberry Pi, n.d.) and a Pimoroni Pico Audio Pack (‘Pico Audio Pack [Line-Out and Headphone Amp]’, n.d.) for audio amplification and output. While the PCM5100A DAC supports up to 32-bit stereo audio at a sample rate of 384 kHz, the Pico is capped at 16-bit stereo at 48 kHz. This addresses (i) the need for high-quality real-time audio and is a dramatic improvement over the Uno implementation used in iteration 1. The problem of hearing in noisy environments is addressed with the introduction of headphone listening via the PAM8908JER stereo headphone amplifier. The final two design objectives, which involved choosing a more relevant sound synthesis strategy (iii) and (iv) introducing the facility to sonify recorded data logs, required additional work. An overview of the hardware design and layout of the second prototype iteration is presented in Figure 1.
Hardware design and layout for Prototype 2.

Figure 1. Long description
A diagram of the electronic components used to create the prototype with labels for critical components. It shows each individual component and how these connected together, powered, and where relevant, produce or intercept signals.
Wavetable synthesis
Wavetable synthesis was chosen as the sound-synthesis technique for sonification. From the perceptual point of view, it allows for the blending of one sound into another. The sounds chosen in this context were smooth and pure sine-like tones to represent readings from wetter soils and more complex, rough sawtooth tones for drier readings. This was reinforced with a pitch-mapping whereby wetter values have lower pitches and drier values have higher pitches. This mapping strategy was informed by research in sonification (Roddy, Reference Roddy2015), which shows lower pitches can be perceived as representative of larger volumes while higher pitches are representative of lower volumes. The timbral choices are informed by timbral perception research, which suggests that although sine waves are perceived as smooth and dark, sawtooth waves are heard as bright and rough (Wallmark, Reference Wallmark2022), concepts related to moisture and dryness, respectively.
Wavetable synthesis produces a sound S by performing a weighted interpolation between two commonly indexed samples of two distinct single-cycle audio waveforms (A and B) on the basis of some interpolation factor k.

To produce our sonified signal X at time t, we can substitute the interpolation factor k with our normalised data dt, allowing dt to control the interpolation:

The wavetable implementation involves three oscillators, indexed by n ∈{0,1,2}, and with relative pitch frequencies that correspond to the root, third and fifth of a basic chordal triad. While the exact pitches of the oscillators are determined by the data, this harmonic relationship is maintained as the data changes.

The frequency of each oscillator n is then a function of d ∈[0,1], producing an inverted pitch mapping strategy where the pitch drops as moisture levels increase and rises as it decreases.
In summary, this approach can be thought of as a weighted two-point interpolative wavetable synthesis (Massie, Reference Massie, Kahrs and Brandenburg2002) where both wavetables involve oscillators for root, third and fifth triadic positions. Wavetable A (WTA) uses a simple sine wave shape for each oscillator, while WTB uses a sawtooth waveform. Sonically, this has an interesting effect because the oscillators across both wavetables are pitched to a common set of frequencies; interpolation between tables has the effect of morphing from a clean and clear timbre for the sine waves to a buzzy and dense timbre for the sawtooth waveforms as additional frequency partials above those three core frequencies are introduced. The sawtooth waveform, consisting of odd and even harmonics above the fundamental frequency of a given oscillator, occupies much more spectral space than the sine waves do and so can be more salient and perceptually discriminable in noisy environments. While sensor values are directly mapped to sound synthesis parameters in an inverted manner, the associated timbral transformations, from rough buzzy sawtooth waves to simple and pure sine tones, provide more evocative associations to wetness and dryness. As such, changes in the data are reflected in the sound as changes in the tonal centre of a given chord triad as well as changes to the overall timbre of that triadic sound.
Sonification of data logs
While the initial prototype iteration could only handle live data, the second prototype includes a data-logging facility wherein sensor data (at 1 Hz) are written to the 2 MB flash memory on the Pico. Memory resources can be extended through the addition of an SD/microSD module. The device can be booted into one of three modes: live sonification (a), logged sonification (b) and data-logging mode (c). Live sonification mode (a) sonifies the data in real time, whereas logged sonification mode (b) produces a sonification of all of the data values stored in memory. The live sonification mode (a) is intended for real-time monitoring of values in the field, while the logged sonification mode (b) operates under the assumption that the device has been in place and collecting data over a timespan of interest. In such cases, the device is booted into data-logging mode (c), where it simply acts as a recording device for incoming data. In live sonification mode (a), a button push produces a triad wherein both the notes of the chord and the complexity of the timbre represent the data.
Low moisture values produce higher chords with buzzier, more complex timbres, as per Figure 2a and higher data values produce lower, clearer chords as seen in Figure 2b. The logged sonification mode (b) plays the entire log of recorded sensor values in a sequence of short pulses, with each pulse representing another sensor value. Individual values are represented by quick chordal pulses of 0.125 s in length with a 0.8 s release. A warm, rounded tone is achieved by triggering the note release before the 0.2 s attack has reached its full amplitude. Because each pulse begins to sound ~1.125 s after the previous one, the sequence of 108 values took roughly 2 min and 2 s to play through. The prototype does not permit the selection of a bespoke playback window in its current state but rather plays back the entire sequence of recorded data values, though these are features that may be implemented as the interface develops in future work. Regardless of mode, the device is inserted into the soil as per Figure 3.
Mel-frequency spectrogram of chords produced for (a) lower and (b) higher soil-moisture levels.
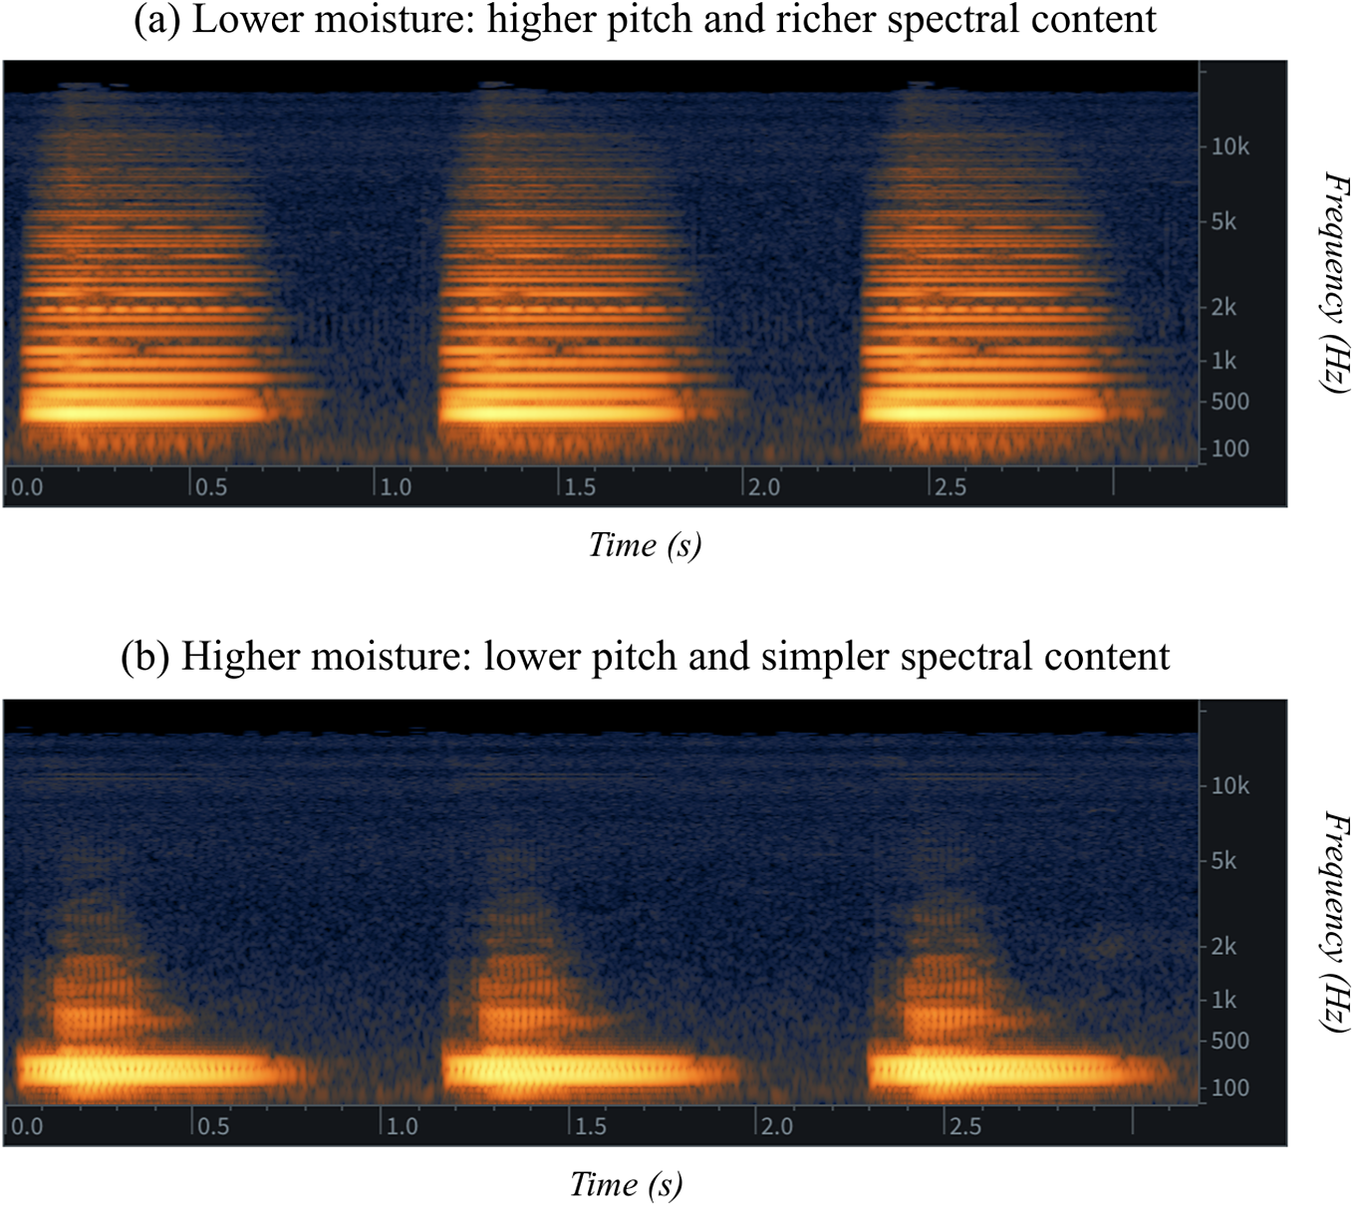
Figure 2. Long description
An image of the mel-frequency spectra for lo moisture sounds and high moisture sounds respectively with higher amplitudes represented in white and mid-power and lower amplitudes in orange and blue respectively.
Placement of Prototype 2 for use during manual irrigation.
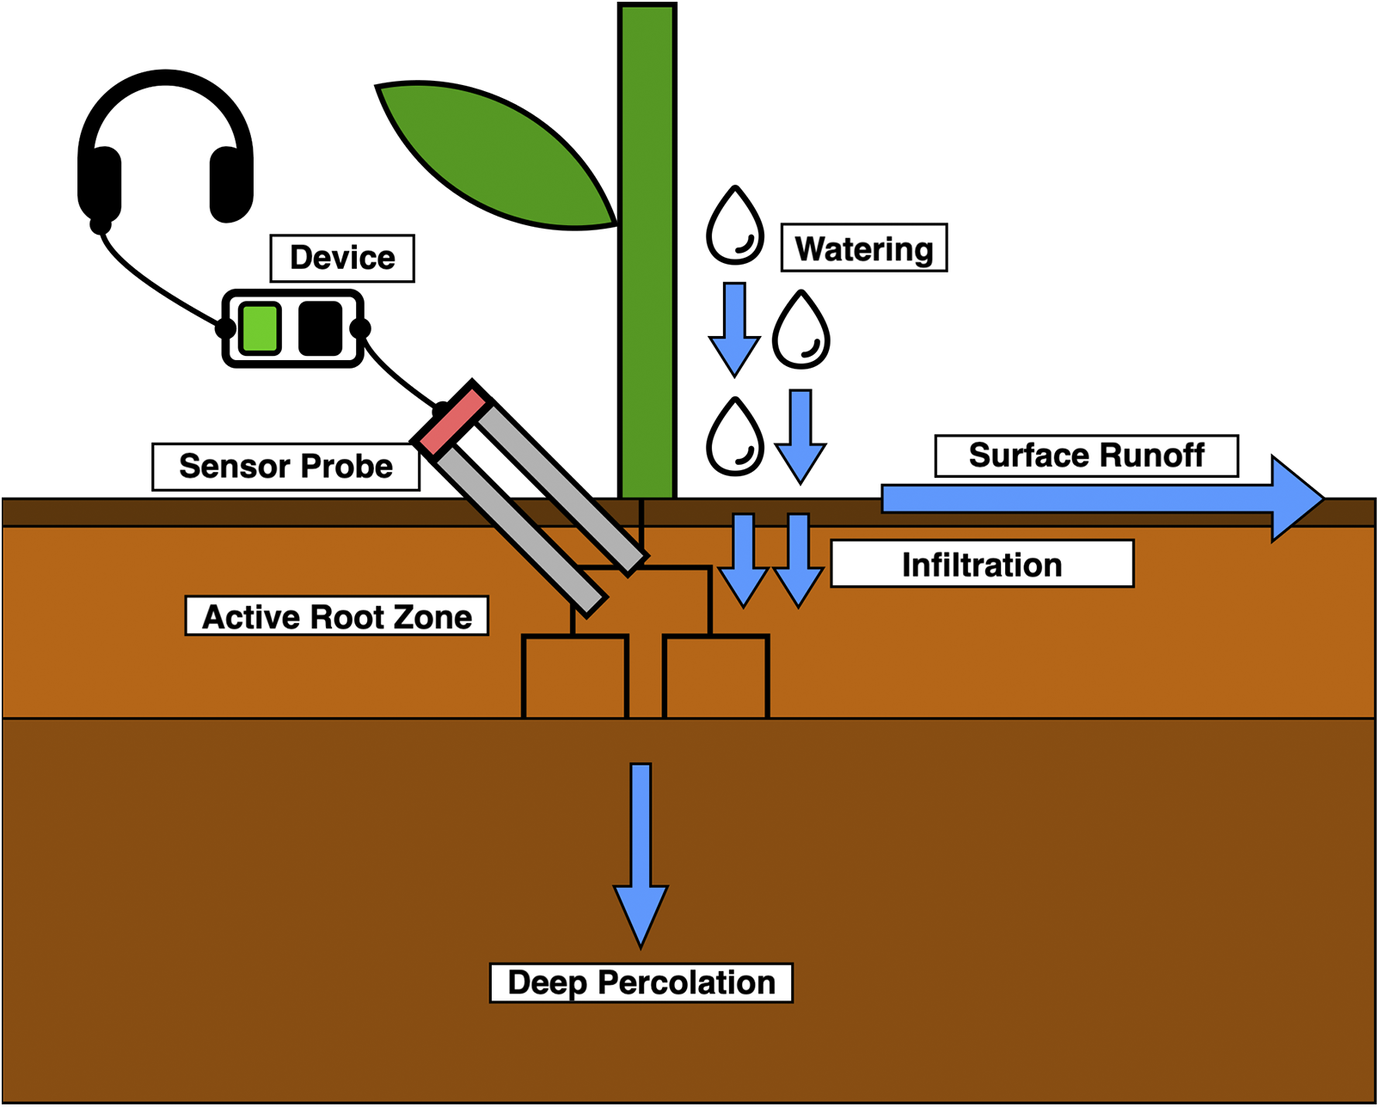
Figure 3. Long description
A diagram of the prototype illustrating how it can be deployed in the field to capture data from the soil and convert it into sound. It shows the probes inserted the active root zone of a plant as water percolates through the soil.
Throughout development, a number of mapping polarities were explored. The relevant schematics, diagrams, source code and video demonstrations to illustrate the operation of Prototype 2 have been made available in an open repository (Roddy, Reference Roddy2025b). The video demonstration provides audible examples of the mapping strategy described here, wherein drier sensor readings are represented with sounds that are higher in pitch and rougher or more complex in timbre, while wetter readings are produced by smoother sounds at lower pitches. The video file ‘p2_live_son’ demonstrates the operation of the prototype in live mode, where it produces a sonification of the soil-moisture levels in real time, while ‘p2_logged_son_2’ demonstrates the sonification of logged sensor values. Further schematics and diagrams are also provided in the repository. Both the technical and the perceptual dimensions of the sonification are reflected in these materials, and they provide an overview of how the prototype operates in practice. A full evaluation of the performance of the system for water conservation tasks is the subject of future work.
Critical evaluation
Several key constraints identified in the initial implementation are addressed in the design of Prototype 2. High-quality audio playback was achieved by switching from the Arduino Uno to the Raspberry Pi Pico with the Pimoroni Pico Audio Pack. This hardware stack supported efficient real-time sonification through CircuitPython’s (‘CircuitPython’, n.d.) C/C++ based ulab (‘ulab’, n.d.) and synthio (‘synthio’, n.d.) libraries. The second prototype supports listening over headphones, which may prove practical when the prototype is used in noisy real-world environments. Weighted two-point wavetable synthesis is well suited to creating a direct redundant mapping from a single sensor value to multiple interpretable acoustic parameters. The inclusion of a facility for recording and sonifying data logs ensures that the system is useful beyond immediate live monitoring, supporting the retrospective assessment of soil-moisture values along a compressed time-series.
Some important limitations nonetheless remain. The sensor probe’s short 6 cm form factor constrains the device to near-surface monitoring, allowing it to reach only part of the active root zones of shallow-rooting plants. As such, it cannot access the entire root zone. When deployed over extended time periods, the MH series hygrometer probes can become vulnerable to corrosion and calibration drift. The current prototype was developed for short-term logging and was specifically developed with overnight monitoring in mind as opposed to long-term deployment. Moreover, reliable readings depend on correct probe placement in the area of soil from which the relevant plant draws water. Poor soil structure and uneven water distribution can complicate this further. Additionally, the system needs to be calibrated for each monitoring task, as soil texture strongly impacts the interpretation of watering conditions and some plant species require much more water than others.
A preliminary user evaluation (n = 9) reported elsewhere (Roddy, Reference Roddy2025a) has provided limited evidence for the communicative effectiveness of the second prototype with participants successfully differentiating wet from dry soil for the live sonification conditions. Participants also tracked falling moisture levels in the logged sonification.
Following a short demonstration session where participants learned how to use the prototype, they were presented with the prototype and a recently watered plant and a drier plant. A brief training process, in which participants hear wet and dry reference conditions, is currently required to familiarise the participants with the mapping from data to sound. Participants took readings from both plants in live mode before listening to retrospective sonifications in logged mode, where they heard a log of 108 gradually decreasing moisture measurements. Six of nine participants correctly identified the wetter plant from the drier one in the live sonification. Plants were scored with mean moisture ratings of 3.44 and 2.44 on a five-point scale from very dry to very wet. Six of nine participants correctly identified the downward trend of the logged sonification. A BUZZ scale test (Tomlinson et al., Reference Tomlinson, Noah and Walker2018) performed across all participants produced a mean score of 64.00 (SD = 7.16) out of a possible maximum score of 77. The data from the original evaluation have been rescored here in line with the published BUZZ scoring procedure in order to account for the reverse-scoring of negatively worded items. These results suggest that broad moisture conditions and simple temporal trends were distinguishable by some participants. While these results did not hold across all participants, they provide some preliminary evidence for the interpretability of the prototype. This was a user evaluation focused solely on the participants’ experience and interpretation of the device, and it did not directly evaluate the performance of the hardware itself or its efficacy in reducing water wastage.
Implications of the case
The prototype outlined in this case study highlights how sonification may be useful as a complementary near-surface monitoring interface to provide decision support for manual watering tasks involving shallow-rooting plants in contexts where water loss through runoff and deep percolation are a concern. The live sonification mode provides active feedback during watering tasks, which is intended to inform decision-making in real time. By contrast, the logged sonification mode provides information on the basis of a retrospective analysis of moisture data over a time period of interest. This case also highlights the importance of context-specificity when deploying technologies of this nature. The prototype is highly dependent on correct probe placement and alignment with the root zone, as well as calibration for soil texture and plant species. As such, the prototype offers an additional layer of contextual information that should be interpreted relative to real-world conditions, rather than a generalised sensing device operating with universally standardised measurements.
The prototype explored here was designed for the manual irrigation of individual shallow-rooting plants. It is not designed for deployment in commercial or large-scale irrigation systems and is not well-suited to automated irrigation in its current configuration. As such, scaling the current prototype for wider usage would involve a redesign of the hardware, software, device interface and form factor. The device would require robust housing for extended outdoor operation, supporting a handheld approach for live sonification and stationary placement for data logging. Multiple sensors at different depths would provide a fuller picture of irrigation dynamics. These sensors would need to be more durable to survive across longer timescales. Adapting the prototype for automated irrigation contexts would require a fundamental change of approach, where a network of in-situ sensing devices would record their data and relay it over a communications infrastructure to a network server. There, it could be sonified at the application layer of the network, in much the same way as visual dashboards collect together data and graph it at this layer. This approach has been pursued in the context of Smart City sonification previously (Roddy, Reference Roddy2024).
Applications of the method
Holding down the push-button allows for live monitoring of moisture levels. This becomes particularly useful during manual watering tasks as the changing moisture conditions in the plant’s active root zone can be tracked in real-time. The user can respond directly to the sound, adjusting how they water to achieve their desired soil-moisture condition. For example, when watering a potted shallow-rooting plant, the lower-pitched and smoother-sounding chords associated with increasing moisture tell the user that water is reaching the region of soil around the probe, allowing the user to adjust their watering accordingly. While a static visualisation of the moisture data requires focused visual attention, auditory feedback can provide the necessary data while allowing visual attention to focus on watering tasks. This is an advantage of hearing over sight. Vision extracts information from narrow focal centres, while hearing processes simultaneous streams of information across soundscapes. Thus, sonification can provide an additional layer of decision support to complement visual monitoring while visual attention is otherwise engaged.
The sonification of logged data supports an entirely different form of decision-making activity. Rather than focusing on moment-to-moment intervention, the logged sonifications present a retrospective review of moisture levels over a timespan of interest. The system provides information intended to support the identification of trends and patterns in time-series data by representing each individual moisture value as a sonic pulse wherein the timbre and triad involved are directly mapped from the data. This may help the user to understand how moisture conditions change over time as expressed on a compressed and manageable timescale in the sonification. For example, the device can be used to log changes in moisture levels in a potted plant overnight and present these data to a listener in a compressed sequence the next day. As such, it may prove useful for identifying the rate at which moisture levels change, assessing the effects of various watering practices on different plant and soil conditions, and for providing support when scheduling manual irrigation.
Moisture data related to irrigation are dynamic, reflecting the living interaction between plant, soil and water. Patterns of interest are revealed in these data as both sequences of changes over time and instantaneous values telling us how plant and soil are reacting to watering methods in real-time. Logged sonification can render those patterns audible. In the case explored here, for example, soil-moisture data are heard as timbral and chordal differences between sequential pulses. Drying curves can also be tracked over longer timeframes, and this may help to identify watering needs and schedule irrigation, thereby reducing the risk of over-irrigation and deep percolation. Live sonification, by contrast, renders moisture changes in the soil region around the probe audible to a listener in real time. In the case explored here, rapid changes in soil-moisture readings can be heard as large leaps in pitch and instantaneous variation in timbre, suggesting that water has reached the measured region of the soil and so watering behaviour can be adjusted correspondingly to help reduce the risk of runoff.
Conclusions and field recommendations
The case explored here suggests that the practice of sonification may hold broad value for water-related monitoring tasks. Further, it suggests that sonification is a relevant tool for the provision of decision support during manual irrigation practices. The final aim of such a system is the reduction of water wastage. As water monitoring and detection technologies grow increasingly sensitive and complex (Jones and Horsburgh, Reference Jones and Horsburgh2025), additional representational modes will be needed to support interpretation and analysis of water data. While sonification can provide one such auditory display mode, it also proves useful for revealing patterns of interest in data that are not immediately obvious through visual inspection alone (Walker and Nees, Reference Walker, Nees, Hermann and Neuhoff2011). With this in mind, four field recommendations for the application of sonification to address water wastage in irrigation tasks are presented below.
First, sonification designs for irrigation must address the relevant soil, plant, and root zone conditions. Sonification is always context-dependent and so designs must account for the specifics of a given context. Calibration is thus key to ensuring that sonifications remain meaningful across different soils, plants and watering tasks.
Second, sonification design must account for the specific task it supports. This is evidenced in the present case where real-time sonification supports live watering tasks and logged sonification supports retrospective analysis of data logs. Both modes are enabled by a task-oriented data-sensitive mapping strategy (Barrass, Reference Barrass1997) based on weighted two-point interpolative wavetable synthesis.
Third, live and logged sonification designs serve distinct but complementary functions. Live sonifications can provide moment-to-moment feedback during irrigation tasks, and logged sonifications can reveal important patterns taking place over longer time spans.
Fourth, sonification is not a replacement for existing and functional visual methods. Rather, it can provide:
-
(i) a supplementary layer of information to complement conventional visualisation methods.
-
(ii) a technique for perceptualizing data where visual methods are impractical.
Future work should therefore focus first on identifying irrigation tasks for which sonification can provide effective decision support under real-world conditions. This should involve evaluations of live and logged sonification strategies for a diverse combination of plants, soils and watering tasks. Broader user testing will be needed to understand the efficacy of such systems beyond the preliminary evaluation reported in Roddy (Reference Roddy2025a).
Where the current prototype makes use of a shorter moisture-sensor probe, the system also supports longer probes that can reach and monitor deeper root zones. Calibration is key to the successful deployment of effective sonification systems, and future work needs to determine correct calibration procedures for a diversity of soil, planting and task conditions. More broadly, water data are often dynamic and complex, involving multivariate time-series measures. While such data can be difficult to represent with traditional two-dimensional graphs (Walker and Nees, Reference Walker, Nees, Hermann and Neuhoff2011), there is scope for the development of sonification systems to meet this challenge.
In conclusion, this article has explored a prototype soil-moisture sonification system to provide decision support during the irrigation of near-surface, shallow-rooting plants. It suggests that sonification can provide an extra layer of information that might support manual irrigation practices through real-time feedback and retrospective analysis of moisture levels. While the design is limited by form factor constraints and highly dependent on correct calibration, it nonetheless provides an illustration of the value that sonification holds in terms of decision support for manual irrigation and the representation of complex water data more generally.
Open peer review
To view the open peer review materials for this article, please visit http://doi.org/10.1017/wat.2026.10033.
Data availability statement
Source code, hardware diagrams and schematics and audiovisual demonstrations of the live and logged sonification modes (p2_live_son and p2_logged_son_2) are available in an open Zenodo repository (Roddy, Reference Roddy2025b; https://doi.org/10.5281/zenodo.17193530).
Acknowledgements
The author would like to acknowledge the Radical Humanities Laboratory for providing a space in which to develop the technical components of this research, and the Department of Digital Humanities Colloquium Series for providing an opportunity to develop some of the theoretical components of this work.
Author contributions
The entire article has one single author responsible for all components.
Funding statement
This research received no specific grant from any funding agency, commercial or not-for-profit sectors.
Competing interest
The author declares no conflict of interest.
Ethics and approvals
No new human participant research was conducted for this article. The preliminary user evaluation summarised here was originally conducted for the study reported in Roddy (Reference Roddy2025a). Participation was voluntary, and participants provided informed consent.



 Open access

