1. Introduction
Livelihood vulnerability, poverty and food insecurity persist as major development challenges among rural communities in the developing world, and are linked to water scarcity related problems in many ways (Castillo and Namara, Reference Castillo, Namara and Molden2007; IFAD, 2011; Critchley and Gowing, Reference Critchley and Gowing2012). Rainwater management (RWM)Footnote 1 can provide a promising adaptation strategy in rainfed agriculture to address these challenges by improving productivity and livelihood resilience (Rockström et al., Reference Rockström, Barron and Fox2002; Molden, Reference Molden2007a; de Fraiture et al., Reference de Fraiture, Karlberg, Rockström, Wani, Rockström and Oweis2009; Wani et al., Reference Wani, Rockström and Oweis2009). Positive impacts can be enhanced by promoting appropriate technologies for better adoption and sustained use among farmers (Pagiola, Reference Pagiola1998; Fox et al., Reference Fox, Rockstrom and Barron2005; Molden, Reference Molden and Molden2007b), and by improving governance, infrastructure and the policy and institutional environment (Soussan, Reference Soussan2004; Rockström, Reference Rockström and Molden2007).
Decision making focused on RWM innovations, such as technology selection, investment prioritization and targeting for enhanced impact can be improved using feedbacks from ex ante and ex post impact assessments (Merrey and Gebreselassie, Reference Merrey and Gebreselassie2011). In addition to quantifying the benefits, such assessments help in understanding the process of change, improving the effectiveness of interventions and informing decision making (Gottret and White, Reference Gottret and White2001; Stroud, Reference Stroud2004). However, assessing and empirically measuring the livelihood development and poverty reduction impact of RWM innovations remains conceptually and methodologically difficult (Gottret and White, Reference Gottret and White2001; Lodha and Gosain, Reference Lodha and Gosain2008; Kemp-Benedict et al., Reference Kemp-Benedict, Bharwani, de la Rosa, Krittasudthacheewa and Matin2009). A relevant question in this regard is whether it is more appropriate to assess and measure the impact pathways rather than the impact per se, in order to make impact assessment comprehensive and process oriented. Gottret and White (Reference Gottret and White2001) proposed the paths to development impact methodology as an analytical framework designed to monitor outputs and intermediate outcomes as elements within the impact pathway. They suggest using selected indicators for ex ante assessment to measure expected impacts from interventions. Bond and Mukherjee (Reference Bond and Mukherjee2002) and Stroud (Reference Stroud2004) suggest that impacts from development interventions should be monitored at the process level to influence intervention planning, implementation and monitoring, rather than being considered only at the end of the intervention process. In such a way, impact assessment helps to identify impact pathway constraints to inform subsequent intervention planning and implementation schemes to better achieve long-term impacts.
This paper proposes a Rainwater–Livelihoods–Poverty Index (RLPI) as a methodological improvement over conventional economic techniques for ex ante (and ex post) impact assessment to inform RWM-related decisions. The RLPI methodology, using selected indicators, assesses and measures impact pathways as elements of the complex internal and external processes that affect outcomes and impact from RWM-related interventions. The index is constructed from a comprehensive set of indicators intended to reflect the complex intermediate processes and impact pathway that influence the actual outcomes and impact in the water–livelihood–poverty nexus. The index construction procedure can be replicated fully at temporal and spatial scales. The paper contributes to the rural water security and livelihoods development literature by extending the indicator-based approach to RWM impact assessment.
The following sections discuss conventional and indicator-based approaches to RWM impact assessment. This is followed by a discussion of the conceptual framework of RLPI construction. Information about the study area and the data set used in the empirical analysis is provided. Finally, the results are discussed, followed by a summary of the advantages and the limitations of the RLPI methodology.
2. Approaches to rainwater management impact assessment
2.1. Conventional economics
Methodologies for assessing impacts from RWM interventions are typically based on conventional economic techniques, such as economics of rainwater harvesting and investment analysis that measure economic returns generated from RWM technologies (Malesu et al., Reference Malesu, Oduor and Odhiambo2007). The conventional technique of investment analysis assesses the feasibility of RWM-related project interventions. Econometric analysis, another conventional technique, establishes the causal relationships between RWM technologies and outcomes (e.g., crop yield and farm income) and identifies determinants of technology adoption. Examples of empirical application of conventional economics in RWM analysis include gross margin analysis to land and labor from RWM catchments of different size (Hatibu et al., Reference Hatibu, Mutabazi, Senkondo and Msangi2006) and feasibility analysis of bunds as RWM technologies for rice production (Lazaro et al., Reference Lazaro, Senkondo, Kajiru, Hatibu and Mahoo2000) in Tanzania. Kassie et al. (Reference Kassie, Holden, Kohlin and Bluffstone2008) and Faltermeier and Abdulai (Reference Faltermeier and Abdulai2009) used econometric analysis to assess the impact of water conservation and intensification technologies on farm output and income in Ghana and on crop value in Ethiopia, respectively. Amha (Reference Amha2006) used econometric techniques to assess determinants of adoption of rainwater harvesting pond technologies and their impact on agricultural intensification and productivity in southern Ethiopia. Considerable attention has also been given to the issue of water productivity in the water management literature, including the impacts of RWM on crop and livestock yield in rainfed systems (Molden, Reference Molden2007a; Descheemaeker et al., Reference Descheemaeker, Amede and Haileslassie2010).
However, conventional impact assessment techniques tend to follow a positivist approach that assumes linearity and non-complexity in innovation processes and technology-impact relationships (Douthwaite et al., Reference Douthwaite, Kuby, van de Fliert and Schulz2003). The techniques give little attention to the complex intermediate processes and pathways that foster (or constrain) the realization of economic returns. This limits their scope and importance, especially from the perspective of the sustainable livelihoods framework. Such techniques might be less useful also in the context of integrated water management, a concept focused on system analysis by addressing social and environmental considerations in addition to economic issues in the search for a sustainable development path (Rockström et al., Reference Rockström, Karlberg, Wani, Barron, Hatibu, Oweis, Bruggeman, Farahani and Qiang2010; Merrey and Gebreselassie, Reference Merrey and Gebreselassie2011). Conventional techniques are also criticized as being non-participatory and detached from the reality on the ground (Dreze, Reference Dreze2002; Rao, Reference Rao2002).
The status quo suggests the need for more robust methodologies. Gottret and White (Reference Gottret and White2001), Bond and Mukherjee (Reference Bond and Mukherjee2002) and Douthwaite et al. (Reference Douthwaite, Kuby, van de Fliert and Schulz2003) discuss the desirability of complementing conventional economic assessment methods with evaluation techniques that can accommodate non-linearity and complexity as observed realities in the process of innovation and impact generation. Douthwaite et al. (Reference Douthwaite, Kuby, van de Fliert and Schulz2003) acknowledge the importance of taking a constructivist (or impact pathway evaluation) approach in assessing the impacts of interventions aimed at sustainably improving people's livelihoods. The approach suggests the need to learn from the processes of change as a means to construct knowledge by fitting new information into existing wisdom. Brown Gaddis et al. (Reference Brown Gaddis, Falk, Ginger and Voinov2010) and Voinov and Bousquet (Reference Voinov and Bousquet2010) highlight the importance of considering the dynamics of social and technical factors in natural resource planning and management processes by using participatory approaches. As such, we proposed an indicator-based approach in this paper in an attempt to make livelihood development and poverty reduction impact assessment from RWM-related interventions process-oriented, comprehensive and participatory.
2.2. Indicator-based approaches
The livelihood development and poverty reduction impact of agricultural water management investments depend on an array of pathways (Hussain, Reference Hussain2005; Castillo and Namara, Reference Castillo, Namara and Molden2007). It is therefore important that assessments aimed at informing decisions on RWM innovations take into account the role of such pathways and related processes. This fosters positive impacts through better identification and prioritization of interventions and investment needs. Methodological gaps in such attempts can be addressed by using indicator-based approaches to impact assessment at a household level in order to account for the myriad of factors that affect development pathways at a grassroots level. Such approaches can make the analysis measurable and participatory.
Indicator-based approaches summarize the characteristics of a system using indicators and provide a useful mechanism to assess the roles of different factors in affecting desired objectives and impact of actions (Saisana and Tarantola, Reference Saisana and Tarantola2002; Hemphill et al., Reference Hemphill, Berry and McGreal2004). Such approaches could enhance impact assessment of alternative RWM interventions using relevant pathway-related indicators. Based on information on each indicator used, the approaches help in prioritizing and targeting interventions and investments to enhance positive impacts. This is especially useful in consideration of the importance of the livelihoods-based approach to water-related interventions which favors a holistic and household-centered strategy to ensure success (Douthwaite et al., Reference Douthwaite, Kuby, van de Fliert and Schulz2003; Faurès and Santini, Reference Faurès and Santini2008). Using indicator-based approaches for intervention, impact assessment can help to obtain feedback and data directly from farm households as intervention targets, program implementers and beneficiaries. As such, the approaches provide a mechanism to use opinions directly elicited from farmers as local observers. According to Brown Gaddis et al. (Reference Brown Gaddis, Falk, Ginger and Voinov2010) and Oliver et al. (Reference Oliver, Fish, Winter, Hodgson, Heathwaite and Chadwick2012), this makes impact assessment participatory. Indicator-based approaches also ensure measurability as a complement to multidimensionality. The measurability of indicators makes it possible to aggregate the roles and impacts of multidimensional factors into a single yet meaningful quantitative indicator. In such a way, impact from interventions can be easily interpreted and communicated. Provided that selected indicators are used, fully replicating impact assessment at temporal and spatial scales for a comparative analysis purpose is also possible.
Developments in using methodologies with comprehensive and measurable indicators for livelihood and poverty impact assessment include indexing approaches, for example, Lawrence et al. (Reference Lawrence, Meigh and Sullivan2002), Lindenberg (Reference Lindenberg2002), Sullivan et al. (Reference Sullivan, Cohen, Faurès and Santini2003a); Sullivan et al., Reference Sullivan, Meigh and Giacomello2003b, Lodha and Gosain (Reference Lodha and Gosain2008), Hahn et al. (Reference Hahn, Riederer and Foster2009) and Cohen and Sullivan (Reference Cohen and Sullivan2010). Such approaches show the pertinence of using relevant aspects of livelihoods and poverty impact pathways to construct indicator indices to anticipate and evaluate intervention impacts and to monitor developments. Sullivan et al. (Reference Sullivan, Meigh and Giacomello2003b) consider indexing approaches as effective tools for integrating the wide variety of information relevant to water issues, as they give useful information about the water situation in a particular location (region), while capturing the underlying complexities.
However, indicator-based approaches are also not free from methodological limitations, suggesting the need for caution in their implementation. According to Molle and Mollinga (Reference Molle and Mollinga2003), indicator-based approaches are often plagued by poor data quality, arbitrariness of weights, bias and loss of information in the data aggregation process. Consequently, it is imperative that index construction processes be explicit and the underlying assumptions be made clear.
3. Rainwater-Livelihoods-Poverty Index (RLPI)
3.1. Conceptual framework: the water–livelihoods–poverty nexus
The livelihoods-based approach to water-related interventions for rural development and poverty reduction advocates shifting away from a top-down approach towards a more holistic and household centered one to enhance effectiveness (Faurès and Santini, Reference Faurès and Santini2008). Such a shift is relevant given heterogeneities among rural households that limit their ability to benefit equally from non-targeted water-related interventions (Kemp-Benedict et al., Reference Kemp-Benedict, Bharwani, de la Rosa, Krittasudthacheewa and Matin2009).
Depending on their individual situations and the physical and institutional environment, rural households may face water challenges having multiple dimensions. Challenges might include unavailability of water resources in their locality for some households, but lack of access to the available water resources or a combination of multiple challenges for some others. As a result, a livelihoods-based approach to water-related interventions looks beyond water availability to address water infrastructure, water governance and equity, and markets and user capacity related issues to ensure that water is accessible and usable in an economically feasible, socially equitable and ecologically sustainable manner (Sullivan et al., Reference Sullivan, Cohen, Faurès and Santini2003a; Merrey, Reference Merrey and Molden2007; Faurès and Santini, Reference Faurès and Santini2008). This implies that a comprehensive technique with relevant indicators is needed to take into account multidimensional issues related to livelihood and poverty dynamics among communities and farm households.
Although the choice for the appropriate technique depends on the particular nature of a given impact assessment, the innovative yet complex conceptual framework of livelihoods approach to rural development is often analyzed using qualitative rather than quantitative techniques (Ansoms and McKay, Reference Ansoms and McKay2010). Scoones (Reference Scoones1998) argues that this is the case because there is no simple algorithm to objectively measure sustainable livelihoods. On the other hand, Bagchi et al. (Reference Bagchi, Blaikie, Cameron, Chattopadhyay, Gyawali and Seddon1998) suggests the need for an inclusive livelihood trajectory research approach, both conceptually (with respect to multiple disciplines and development paradigms), methodologically (through use of both quantitative and qualitative techniques) and contextually (in consideration of sociocultural, political and policy issues). As proposed in this paper, RLPI provides an aggregate quantitative indicator of the livelihood and poverty status of households adopting RWM technology based on quantitative and qualitative response data obtained from farm households. The index is a composite indicator constructed from multidimensional water-related components and subcomponents that is intended to capture and reflect the role of complex processes and impact pathways that translate RWM innovations into livelihood development and poverty reduction outcomes and impacts.
3.2. RLPI construction
The indexing approach described by Hahn et al. (Reference Hahn, Riederer and Foster2009) and (Cohen and Sullivan, Reference Cohen and Sullivan2010) provides empirical background on index construction from multiple components and subcomponents. In a similar way, each component of RLPI is comprised of different subcomponents in order to account for various factors that enter the impact pathway.Footnote 2 In addition to water resource availability and accessibility, RLPI incorporates the capacity of farm households to cope with shocks and to maintain and increase assets without undermining the natural resource base and agro-ecological balance.
3.2.1. Components and subcomponents
The fundamental procedure for constructing the index involves the identification of components (and subcomponents) as building blocks, followed by identification of indicator values for each component (and subcomponent). Once the indicator values are standardized,Footnote 3 they can be aggregated to a single index, i.e., a composite indicator, using equal or varying weights. Identification of components and subcomponents for index construction can be difficult as the decision involves unavoidable tradeoffs between the number of components and subcomponents included and the importance of each of these in the final index (Sullivan et al., Reference Sullivan, Cohen, Faurès and Santini2003a). Saisana and Tarantola (Reference Saisana and Tarantola2002) stress the importance of ensuring that components and subcomponents are relevant to the phenomenon measured, although there is not a fully objective way to select them. Sullivan et al. (Reference Sullivan, Cohen, Faurès and Santini2003a) suggest three to five components, each of them computed on the basis of one or two subcomponents, as a good tradeoff where the multiple dimensions of the issue treated are adequately taken into account without excessive complexity, and where differences between the scores of the individual components and subcomponents remain significant for their inclusion in the index construction to be meaningful.
As further discussed below, we selected five components to construct RLPI, based on their perceived theoretical and practical relevance as factors affecting the dynamics and pathway to water-related rural livelihood development and poverty reduction. Faurès and Santini (Reference Faurès and Santini2008) suggest that rural and agricultural water use be analyzed in terms of three main components: access, control and management. Sullivan et al. (Reference Sullivan, Cohen, Faurès and Santini2003a) and Lawrence et al. (Reference Lawrence, Meigh and Sullivan2002) considered the issues of water availability and water access in constructing the Water Livelihood Poverty Index (WLPI) and the International Water Poverty Index (WPI), respectively. Drawing upon these, the preliminary idea of RLPI and its components was discussed at the Nile Basin Development Challenge (NBDC) Science Reflection Workshop held in Addis Ababa, Ethiopia, in May 2011. At a later stage, the final list of the RLPI components and subcomponents was further discussed with experts working on RWM under the NBDC project (a research project aimed at developing innovative RWM interventions to be implemented at a landscape scale across agro-ecosystems in the Ethiopian Highlands with the purpose of improving system productivity and livelihood resilience). The five components selected for RLPI construction following this procedure are water availability, water accessibility, livelihood strategies, ecological sustainability of management practices and resilience of livelihoods to rainfall variability. These components are comprised of 21 subcomponents altogether. By embedding the concept of the sustainable livelihoods framework in the assessment, the components and subcomponents considered are intended to reflect livelihood strategies of farm households and appropriate internal and external opportunities and constraints in the water–livelihoods–poverty nexus.
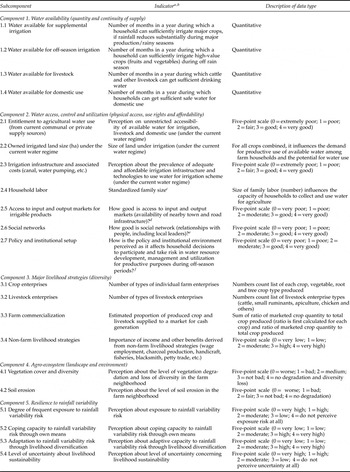
The proposed RLPI components and subcomponents are assumed statistically independent in view of the distinct nature of the particular issues pertaining to each component.Footnote 4 Although the impact on the relative importance of each component and subcomponent can be considerable (Sullivan et al., Reference Sullivan, Cohen, Faurès and Santini2003a), the effect of using competing components and subcomponents (the worst possible case against the assumption of statistical independence) on the value of the composite indicator is assumed to be limited. This is particularly the case when the composite indicator is constructed using an equal weighting scheme on the components (and subcomponents) as is the case in this paper. The equal weighting scheme tends to avoid the possibility of assigning excessive weight to a relatively insignificant component or subcomponent or vice versa. The details regarding components and subcomponents used in calculating RLPI are provided in table 1.
RLPI components, subcomponents and indicators

Notes: aAs a baseline scenario, all responses are drawn by taking into account the current water regime, which is characterized by use of common water sources from rivers, springs, ponds, dug wells, etc. while RWMs are either absent or minimal. On the contrary, responses for the comparative (treatment) case will be based on the assumption that innovative RWMs are adopted by farm households, including those strategies that make water available for supplemental irrigation purposes from common sources, such as reservoirs.
bQuestions used in the household survey for data collection are those entries under the second column (Indicators).
cStandardized family refers to family in adult equivalent, calculated as: a 1x 1+a 2x 2 + a 3x 3 + a 4x 4, where a i = parameters (a 1 = 1, a 2 = 0.85, a 3 = 0.75 and a 4 = 0.45), x 1 = adults in household (age > 16 years), x 2 = children between 10 and 16 years of age, x 3 = children between 6 and 10 years of age and x 4 = children below 6 years of age.
dMarket access influences costs and incentives to participate in the production of income-generating activities, some of which use irrigation.
eSocial networks influence information sharing and decision making about RWMs adoption and practice.
fThe policy and institutional context affects participation, property rights, decisions, etc.
(a) Water availability. Physical and economic water scarcity constrains rural livelihood
development and poverty reduction efforts by limiting crop and livestock productivity and livelihood diversification and resilience (Molden, Reference Molden2007a). While physical water scarcity, i.e., lack of water because of surface and ground water shortages, is becoming an increasingly important global phenomenon, mainly as a result of climate change events and erratic rainfall patterns, the problem of economic water scarcity, or the inability to make use of the available water resources for productive and consumptive purposes because of limited investment, is also important, especially among rural communities. This highlights the need for adaptive management interventions in rural areas to make water available in sufficient quantity and quality, and to improve its productivity by improving water use efficiency. RWM innovation can be a source of water for supplemental irrigation, livestock production and domestic use in rural areas dependent on rainfed agriculture. While available options for RWM extend from in situ to ex situ techniques, this can be made possible through aquifers improving water resources as a result of watershed management (Joshi et al., Reference Joshi, Jha, Wani, Joshi and Shiyani2005; World Bank, Reference Bank2005). However, the relevant question is whether farm households and communities can successfully manage watersheds (and rainwater) to be water secure for livelihood development and poverty reduction. The first few questions in table 1 (section 1, column 2) aim at eliciting farmers’ opinions with regard to such aspects of the impact pathway in the water–livelihoods–poverty nexus.
(b) Water accessibility. Poor access to water resources is as significant as the problem of inadequate water availability in that both constrain production, consumption and livelihood diversification and resilience. Access to water resources, like other livelihood dynamics, is influenced by a host of micro- and macro-level factors. Household resources or assets can be considered as micro-level factors and policies as macro-level factors affecting water accessibility. The sustainable livelihoods framework (DFID, 1999) recognizes the importance of the macro–micro linkage in its role in influencing and shaping livelihood dynamics and outcomes. Policies influence the context in which livelihoods function, and thus livelihood strategies and outcomes by defining institutions such as property rights that affect ownership of and access to water and other environmental resources. The sustainable livelihoods framework emphasizes the importance of influencing policies and institutions in such a way that they promote a pro-poor development by addressing the special needs and constraints of the poor.
Access issues considered under the water accessibility component of RLPI include such micro-level issues as physical distance of households from water sources and infrastructure (Molden, Reference Molden2007a), ownership of land and water resources (Hussain, Reference Hussain2007), labor availability (Samson et al., Reference Samson, Belayneh, Degeye, Belay, Demeksa, Estifanos, Zelalem, Addisu, Tucker and Zemede2010) and ability to pay for water-related services such as for water and maintenance and operation costs. Macro-level factors include governance-related issues manifested in the form of user right and entitlement and functioning laws, policies and institutions (Soussan, Reference Soussan2004; World Bank, Reference Bank2005).
(c) Livelihood strategies. The potential contribution of water-related interventions to livelihood development and poverty reduction will not necessarily be similar across different households and livelihood strategies. Water resource management interventions make a significant contribution to rural livelihood development where livelihood strategies can make use of the water resources made available and accessible. Livelihood strategies dominated by horticultural production, small ruminants and apiculture typically benefit more from such interventions, since their productivity can be improved as a result of available and accessible water. According to Faurès and Santini (Reference Faurès and Santini2008), the provision of water for small productive activities, such as home gardens, fruit trees and small off-season vegetable plots, can have a considerable poverty reduction impact. On the other hand, water availability and accessibility will have only limited impacts if livelihood strategies are predominantly non-farm based. Impacts will also be limited for those households that are unable to use water for productive purposes. Therefore, as stated by Ellis (Reference Ellis1998), it is important to remove constraints and expand opportunities for livelihood diversification in order to give individuals and households more capabilities to improve their livelihoods by using water resources. Prioritizing and targeting interventions accordingly can make a difference in terms of impacting livelihood development and poverty reduction among rural households.
(d) Ecological sustainability of practices. Increased water availability due to successful interventions must be evaluated in view of the relationship between those interventions and the ecosystem services which water would provide (Molden, Reference Molden2007a). Malesu et al. (Reference Malesu, Oduor and Odhiambo2007) and Nassef and Belayhun (Reference Nassef and Belayhun2011) argue that human activities to develop water resources must take into account the capacity of ecosystems to replenish and sustain themselves. Therefore, it is important to ensure that RWM interventions are complemented with natural resource management practices to preserve and enhance the hydrological balance and biological functions of ecosystems towards ensuring sustainability.
(e) Resilience of livelihoods to rainfall variability. RWM provides adaptive mechanisms and improves rural livelihood resilience to shocks arising from climate change events and rainfall variability by improving farmers’ capacity to use supplemental irrigation during dry spells to maintain and enhance crop and livestock productivity. Therefore, perceptions of rural households regarding the extent of their exposure to rainfall variability risk, along with their ability to cope and adapt as a result of RWM innovations, can indicate the potential impact of RWM interventions on livelihood resilience.
3.2.2. Weighting and standardization
(a) Weighting. Composite indicators are sensitive to the techniques used in the index
construction process, including weights assigned to components and subcomponents (Molle and Mollinga, Reference Molle and Mollinga2003; Saisana et al., Reference Saisana, Saltelli and Tarantola2005). Weighting modifies the relative importance of specific components and makes index construction sensitive to manipulation due to the inherent subjectivity in assigning weights (Sullivan et al., Reference Sullivan, Cohen, Faurès and Santini2003a). The problem becomes more significant as the number of components and subcomponents considered decreases. In such cases, weighting considerably affects the relative share of each component and subcomponent, with a significant impact on the index value. Weighting is therefore a technically useful but methodologically controversial issue in composite index construction.
Though somewhat difficult, the ideal weighting scheme would involve using the impact of each component on the ultimate objective as weights (Chowdhury and Squire, Reference Chowdhury and Squire2006). Index construction using equally weighted components is commonplace in empirical studies, either based on the simplifying assumption that different components and subcomponents have equal importance or in the absence of a sound weighting procedure to use. For example, the Human Development Index (HDI), a widely known composite indicator developed by UNDP (1990), is constructed based on equally weighted components. Sullivan et al. (Reference Sullivan, Cohen, Faurès and Santini2003a) used an equal weighting scheme as a neutral choice to construct the WLPI. Hahn et al. (Reference Hahn, Riederer and Foster2009) applied equal weight to components to construct the Livelihood Vulnerability Index (LVI). Lawrence et al. (Reference Lawrence, Meigh and Sullivan2002) used equal weighting to calculate the WPI and argue that it is likely that a simple average is as useful as a weighted one. Chowdhury and Squire (Reference Chowdhury and Squire2006) and Nguefack-Tsague et al. (Reference Nguefack-Tsague, Klasen and Zucchini2011) found equal weighting schemes used for HDI construction convenient and consistent with expert views and results obtained from statistical analysis. Saisana and Tarantola (Reference Saisana and Tarantola2002) provide a partial list of additional empirical literature which used equal weighting schemes for index construction.
In consideration of its wider application in empirical analysis and its simplicity and straightforwardness, we adopted an equal weighting scheme in this study as suggested by Sullivan et al. (Reference Sullivan, Cohen, Faurès and Santini2003a); Sullivan et al., Reference Sullivan, Meigh and Giacomello2003b as a neutral choice. Accordingly, RLPI construction is based on equally weighted components and subcomponents. Our decision to use an equal weighting scheme is also partly driven by the lack of established empirical evidence about the relative importance of the specific components and subcomponents considered in the study. The decision entails an implicit assumption that each component and subcomponent contributes equally in affecting water-related livelihood development and poverty reduction processes, outcomes and impacts.
The proposed RLPI is calculated as a simple average of equally weighted component indices (equation (4)). Each component index, in turn, is calculated as a simple average of subcomponent indices (equation (3)).
 $$\hbox{Household index}^5 \lpar LP_{hi}\rpar ={X_{hi}-Min.\, X \over Max.\, X-Min\, .X}$$
 $$\hbox{Subcomponent index} \lpar LPSC_{k}\rpar \, ={\sum_{i=1}^p {LP}_{hi} \over p}$$
 $$\hbox{Component index} \lpar LPC_{i}\rpar ={\sum_{k=1}^z W_{LPSCk} LPSC_k \over \sum_{k=1}^z W_{LPSCk}}$$
 $$\hbox{Rainwater--Livelihoods--Poverty Index} \lpar RLPI\rpar ={\sum_{i=1}^5 W_{LPCi} LPC_i \over \sum_{i=1}^5 W_{LPCi}}$$
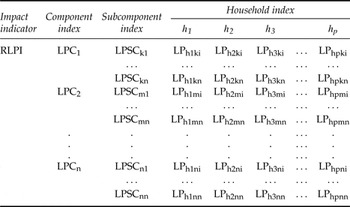
where k is a subcomponent, z is number of subcomponents, w is weight attached to a respective component and subcomponent, p is number of households, X hi is value observed for each household over each subcomponent, LP is livelihood–poverty index of an individual household (hi), LPSC is average livelihood–poverty index for each subcomponent, and LPC is average livelihood–poverty index for each component (table 2). Observed X hi data are values on perceptions, expectations and observations of each household with regard to pertinent issues in each subcomponent. Such data are key inputs for RLPI construction since they capture the link between water and related processes and livelihood development and poverty reduction outcomes and impacts.
Index calculation scheme
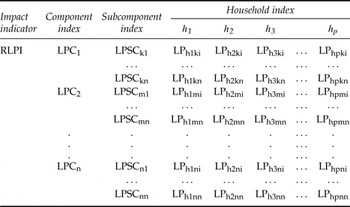
Notes: h1, h2, …, hp stand for household 1, 2, …, n, respectively.
(b) Standardization. Sullivan et al. (Reference Sullivan, Meigh and Giacomello2003b) encourage incorporation of data collected through participatory processes for indexing approaches. RLPI is based on quantitative and qualitative data collected through household surveys which reflect household perceptions, expectations and observations. Quantitative data have positive numeric values while qualitative data have five-point scale values ranging from 0 to 4.Footnote 6 Quantitative data for different subcomponents have different measurement units and also have a scale difference with the qualitative data. The first step is therefore to standardize the quantitative data to eliminate the units and then to match the data scale-wise to the qualitative data to allow index construction using the arithmetic operations shown in equations (2)–(4).
Standardization is performed by using the indexing approach shown in equation (1). The Household index (LP hi), calculated for quantitative indicators only, standardizes data observed for individual households by taking the ratio of  $\lpar X_{hi} -Min.\, X\rpar $ to
 $\lpar Max.\, X-Min.\, X\rpar $ (equation (1)). This is repeated for each household and for each quantitative subcomponent used for RLPI construction. The procedure transforms the indicator values into indices whose values range between 0 and 1 (inclusive). We decided to use this method for RLPI construction as it is commonly used in similar empirical analyses (e.g., Sullivan et al., Reference Sullivan, Cohen, Faurès and Santini2003a; UNDP, 2010). In the case of indicators with qualitative data, LP hi takes categorical values ranging from 0 to 4 as observed (i.e., without standardization). After calculating the ratio of
 $\lpar X_{hi}-Min.\, X\rpar $ to
 $\lpar Max.\, X-Min.\, X\rpar $ across all observations of the continuous variables to ensure standardization, each resulting ratio is multiplied by 4 to adjust the scale of the quantitative data ratios to that of the qualitative data. This standardization and scale adjustment allows arithmetic operation on the quantitative and qualitative response data obtained from households across all the subcomponents to produce a single quantitative indicator – RLPI. In effect, RLPI becomes a hybrid construct of standardized indices on quantitative data and absolute scales on qualitative data.
The LP hi values of households are averaged to construct a livelihood–poverty index for each subcomponent (LPSC) (equation (2)). This is repeated for each household and for each subcomponent used for RLPI construction. Respective LPSC values are then averaged to calculate livelihood–poverty index values for each component (LPC) (equation (3)), whose average, in turn, gives an RLPI value (equation (4)). The smallest possible RLPI value is 0 (suggesting lack of improvement in the livelihood development and poverty reduction status of farm households from RWM innovations), while the maximum is 4 (suggesting considerable improvement in the livelihood development and poverty reduction status of farm households as a result of RWM innovations). The closer the RLPI value to 4, the better the livelihood development and poverty reduction impact of RWM innovations, and vice versa.
4. Application: RLPI for Diga district, western Ethiopia
4.1. The study area
Diga district is located at 09 01’ 29.2” N and 036 27’ 28” E, approximately 343 km west of Addis Ababa, Ethiopia. Its elevation ranges from 1,380 to 2,300 masl with 68.2 per cent arable land, 12 per cent grazing land and 17 per cent forest land. The district has both lowland (60 per cent) and midland (40 per cent) agro-ecologies. With fluctuations experienced over years, the district has a mono-modal rainfall pattern. It receives rain from mid-March through November, mainly from June to September during which the major crop production activities take place.
Agriculture, characterized by a subsistence crop–livestock mixed farming system, is the major livelihood strategy in Diga district. The major crops produced include maize, barley, faba bean, coffee and sesame. While agriculture is mainly rainfed, there is also small-scale irrigation practice in the lowland and midland areas. Land degradation, caused by such interrelated factors as population pressure, farmland expansion, overgrazing, deforestation and cultivation of steep slopes, is a major challenge facing agricultural production activities in the area. Seasonal water shortage is an additional problem faced by farmers, especially in the lowland areas where physical water scarcity for agriculture, livestock and domestic uses is a common incident. The seasonal water shortage problem in the district can be addressed through RWM interventions. We calculated the RLPI value for the district using survey data collected from sample farm households in the area to assess the potential impact of RWM-related interventions and to prioritize investment needs to enhance such impact. The assessment results and the investment needs to enhance impact are discussed in section 5.
4.2. Data set
One of the methodological advantages of RLPI, as mentioned earlier, is its use of data directly generated from households as adopters, implementers and beneficiaries of RWM innovations.Footnote 7 RLPI construction for Diga district is based on a comprehensive set of quantitative and qualitative data collected from farm households on each component and subcomponent discussed in table 1. The data are collected by conducting a field survey in four sample peasant associations (Arjo Gudatu, Bikila, Degaga Didessa and Wayessa Dimtu). The peasant associations were selected randomly among those found in the middle and low-altitude areas of the district where seasonal water shortage is an important constraint to agriculture as a major livelihood strategy. We used 120 sample respondents for the survey by randomly selecting 30 farm households from each of the four peasant associations. We considered an equal number of sample households from each peasant association since each has a reasonably equal number of farm households (except Arjo Gudatu which has a slightly larger number of farm households). The data collection activity lasted for about three weeks (6–25 November 2012). The survey questions used, organized by component and subcomponent categories, are the entries in the second column of table 1. The majority of the sample farm households have a family size of four to six persons and average farm land size of 2–3 ha.
5. Results and discussion
5.1. Calculated RLPI value
RLPI for Diga district is constructed from the five components discussed earlier (water availability, water accessibility, livelihood strategies, ecological sustainability and resilience to rainfall variability) and the respective subcomponents, using an equal weighting scheme. The calculated RLPI value is 1.97.
It is possible to make judgments about the potential impacts of RWM innovations in Diga district by comparing the calculated RLPI value with the maximum possible RLPI value (i.e., 4). The calculated RLPI value of Diga (1.97) is more than half way below the maximum possible RLPI value, perhaps suggesting only a moderate improvement in the livelihood development and poverty reduction status of farm households from RWM innovations.
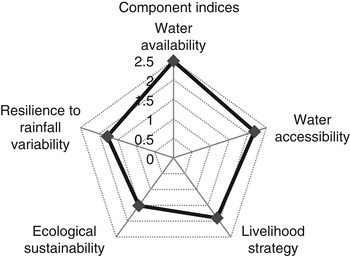
It is necessary to identify factors (among the components and subcomponents used in the RLPI construction) that limit the potential livelihood development and poverty reduction impact of RWM intervention in Diga district and their relative importance in order to prioritize investment needs. Figure 1 shows that problems related to livelihood strategies, resilience to rainfall variability and ecological sustainability tend to constrain the livelihood development and poverty reduction impacts of RWM innovations in the area. Lack of livelihood diversification (limited number of livelihood strategies), the problem of soil erosion and vegetation degradation and poor resilience to rainfall variability appear as important constraints. The finding suggests the need to prioritize investments that address such particular constraints in the study area.
RLPI component indices

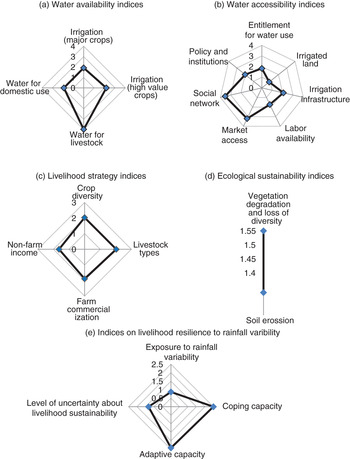
Each RLPI component can be further assessed in terms of the role of each subcomponent it is comprised of in affecting pathways to livelihood development and poverty reduction. Figure 2 shows the subcomponents comprising each RLPI component and their respective roles in promoting and constraining the livelihood development and poverty reduction impacts of RWM innovations. For example, in the case of the water availability component (figure 2a), irrigation water for major crops, irrigation water for high-value crops and water for domestic use are unmet, compared to water for livestock. Accordingly, these subcomponents deserve more focus and investment priority to improve the impact of RWM innovations. Similarly, figure 2b shows lack of entitlement (to access water), lack of irrigable land and poor irrigation infrastructure as limiting factors that might lessen the potential impact of RWM innovations. The implication is that such subcomponents too deserve investment priority. By so doing, RLPI helps to identify the continuum of investment needs that improve the livelihood development and poverty reduction impacts of RWM innovations.
RLPI subcomponent indices

5.2. Expert opinions and result validation
Decision model results are generally bound to uncertainty as a result of possible problems in model structure and parameters, wrong assumptions used and lack of robust data (Hosack et al., Reference Hosack, Hayes and Dambacher2008). Like any other indicator-based methodology (Molle and Mollinga, Reference Molle and Mollinga2003), the RLPI result obtained in this study might have limitations arising from the assumptions made in the process of index construction, especially in relation to component and subcomponent selection and the weighting scheme. This can be an important source of uncertainty to use the RLPI value for decision-making purposes with regard to RWM innovations. In such circumstances, expert opinions can be used as legitimate and best available information sources to validate model results, to get additional information that can lead to more accurate model forecasts and better decisions (Winkler and Clemen, Reference Winkler and Clemen2004; Leal et al., Reference Leal, Wordsworth, Legood and Blair2007; Krueger et al., Reference Krueger, Page, Hubacek, Smith and Hiscock2012).
Oliver et al. (Reference Oliver, Fish, Winter, Hodgson, Heathwaite and Chadwick2012) argue that research projects designed to inform policy and practice may rely on data obtained from farmers as expert observers of ground-level processes to better understand decisions that can impact development. An important aspect of RLPI in this regard, perhaps rendering the index construction process a participatory nature, is its use of perceptions and opinions from farmers as sources of local-level expert knowledge. The participatory nature of the analysis qualifies RLPI as a methodology based on local-level expert knowledge to rely on its results to inform intervention decisions. Yet, to assess how RLPI findings converge with the opinions of field-level experts other than farmers, we further elicited opinions from Innovation Platform facilitators who work with farmers, public officers and other actors on RWM-related issues in the study area (Diga district) where the RLPI methodology is empirically tested.Footnote 8 The experts selected for the elicitation purpose have the relevant knowledge and field-level experience in RWM-related issues in the study area. Because developing a widely applicable analytic and decision model needs iterative processes, the expert opinions sought from the experts can also be important sources of information for future endeavors aimed at improving RLPI or developing its variants.
The expert opinion elicitation process in this study involved a face-to-face discussion between the researchers and the experts on the different RLPI construction related issues, followed by a group discussion among the experts to express opinions on a consensus basis. We talked with four Innovation Platform experts about the purpose of RLPI, the construction process (components, subcomponents and weighting scheme) and the results obtained for the Diga case study and the message from the results in terms of the potential livelihood development and poverty reduction impacts of RWM innovations in the area. After such discussions, the experts were allowed (and left alone) to freely discuss the above-mentioned RLPI-related issues among themselves (by exchanging ideas) and to give shared opinions on each relevant issue by consensus.Footnote 9
The elicitation results show the perceived importance of constructing and using RLPI for assessing the livelihood and poverty impacts of RWM-related interventions by focusing on impact pathways. The experts acknowledged the usefulness of the proposed indexing approach as it helps to get feedback and first-hand information on farmers’ perceptions about the potential impacts of (and constraints to) RWM innovations on rural livelihoods. Using RLPI for such purposes is found commendable by the experts on the grounds that it gives indications about the constraints (and opportunities) that need to be prioritized in order to achieve livelihood development and poverty reduction impacts among communities. The experts found that the components and subcomponents considered were appropriate. Moreover, they found the RLPI value obtained from the Diga case study acceptable and rated the implied message similar to what is currently being perceived, experienced and observed at a field level.
The experts made important suggestions to improve RLPI construction for a wider and practical application. A remark was made that analysts constructing and using RLPI should ascertain whether it is necessary to use all the components and subcomponents considered in this particular study indiscriminately, underscoring the importance of site-specific considerations. Accordingly, a valid RLPI is considered to be context specific in terms of its components and subcomponents. The experts suggested that future endeavors be more cautious about the weighting schemes used, in order to reflect reality in terms of the relative importance of each component and subcomponent considered in influencing impact. It was also advised that index values obtained for each component and subcomponent (and RLPI value) be interpreted cautiously as the ex ante perceptions of farmers about each of such issues might differ from perceptions after implementing RWM interventions and experiencing the outcomes.
6. Conclusions
Assessing the livelihood development and poverty reduction impact of RWM innovations gives useful insights to inform subsequent intervention decisions. However, the assessment is often challenged by conceptual and methodological problems, including lack of established ex ante impact analysis techniques to help intervention selection, prioritization and targeting. Whether it is empirically more appropriate to assess and measure the impact pathways than the impact per se is also a relevant methodological issue in the field.
The proposed RLPI methodology in this paper helps to develop a quantitative aggregate indicator for ex ante (and ex post) livelihood development and poverty reduction impact assessment of RWM innovations in a comprehensive, measurable and participatory way. The methodology focuses on assessing and measuring impact pathways using quantitative and qualitative household response data. The focus on impact pathways helps to get feedback that inform priority setting in subsequent RWM planning, implementation and monitoring processes. Using household data makes the methodology participatory and allows farmer engagement to use their local expert knowledge (expectations, perceptions and observations) to inform RWM decisions. The methodology aims to feature the key aspects of the sustainable livelihoods framework: comprehensiveness (multiple components), household participation (farm households as center of analysis) and combination of quantitative and qualitative information for impact analysis. The proposed index can be modified and made context specific by including (or excluding) selected issues as components and subcomponents.
The case study in Diga district came up with a quite low RLPI value, indicating the limiting role of specific component and subcomponents in translating RWM innovations to livelihood development and poverty reduction impacts. Such limiting factors include lack of irrigation water, lack of irrigable land, poor irrigation infrastructure, lack of entitlement to access available water, limited livelihood strategies, high rate of soil degradation and low level of livelihood resilience. It is therefore important to address such limiting factors in order to develop livelihoods and reduce poverty among the community using RWM-related interventions.
RLPI contributes towards making a comprehensive, measurable and participatory impact assessment. Yet, the methodology may need further improvement before it is ready to be widely used for the proposed impact assessment purpose. In particular, future research activities using RLPI and iterations to improve the methodology may find it necessary to subject component and subcomponent selection processes and weighting schemes to formal statistical scrutiny.