I. INTRODUCTION
To satisfy the increasing global demand for (multi)functional silicon-based covalent ceramics, it is required to develop new products and technologies. The high temperature pyrolysis of organosilicon polymer precursors has been used for the synthesis of amorphous silicon oxycarbide (Si–O–C) and silicon carbonitride (Si–C–N) ceramics. Reference Kroke, Li, Konetschny, Lecomte, Fasel and Riedel1–Reference Mera, Navrotsky, Sen, Kleebe and Riedel3 Polymer derived silicon-based ceramics have unique structures containing corner sharing Si-based tetrahedra and, in most cases, “free” carbon. In the case of Si–O–C ceramics, a fraction of the tetrahedral units consists of identical bonds (SiC4 and SiO4) and the remaining contains mixed bonds (SiO i C4−i ; i = 1–3). Reference Renlund, Prochazka and Doremus4–Reference Widgeon, Sen, Mera, Ionescu, Riedel and Navrotsky6 Similarly for most Si–C–N ceramics, the structure contains Si tetrahedra with both identical and mixed bonds (SiN j C4−j ; j = 0–4). Reference Dixmier, Bellissent, Bahloul and Goursat7–Reference Haug, Lamparter, Weinmann and Aldinger9 Although the development of new Si-based ceramic products from polymer precursors has advantages such as the formation of tailored atomic structures and the capability of shaping polymers into a variety of forms, exploring alternative routes for making similar compositions/structures, particularly at nanoscale dimensions, is desirable as the chemistry and structure of polymer derived ceramics are dictated and therefore limited by the starting polymer. Along with the polymer approach, a variety of deposition techniques (e.g., CVD, sputtering, and PLD) for making Si–O–C and Si–C–N thin films have been used. Reference Yang, Oh, Ryu, Kim, Jing, Choi, Lee, Um and Chang10–Reference Park, Kim and Sung14 Although the synthesis of Si–O–C and Si–C–N nanoparticles using laser spray pyrolysis of Si-organic precursors has been reported, Reference Gonsalves, Strutt, Xiao and Klemens15,Reference Kortobi, d’Espinose de la Caillerie and Legrand16 the synthesis of nanoparticles using solely inorganic Si-based starting materials has not been documented to the best of our knowledge. Here, we present a straightforward technique for the synthesis of silicon oxycarbide nanoparticles. We selected the Si–O–C system mainly for two reasons. (i) Polymer derived Si–O–C compositions have been shown to be thermodynamically stable relative to the competitive crystalline components of SiO2, SiC, and C, Reference Varga, Navrotsky, Moats, Morcos, Poli, Muller, Sahay and Raj17,Reference Morcos, Navrotsky, Varga, Blum, Ahn, Poli, Muller and Raj18 implying the potential to form them by other pathways in both laboratory and natural settings, including planetary interiors and/or during planetary accretion. This possibility is supported if one can achieve the synthesis of similar Si–O–C materials through alternative methods in addition to the polymer route. (ii) A very recent report reveals outstanding gas sensing behavior of mesoporous Si–O–C ceramics. Reference Karakuscu, Ponzoni, Aravind, Sberveglieri and Soraru19 Thus making Si–O–C nanoparticles with high surface area may not only improve the performance of the ceramic as a gas sensor but also be implemented for other applications such as batteries and catalysts.
II. EXPERIMENTAL PROCEDURES
A custom-made gas-phase condensation setup designed for laser evaporation of a solid target in a controlled atmosphere chamber (see Ref. Reference Eilers and Tissue20 for details) was used for the synthesis. Two target compositions were used: (i) amorphous silicon monoxide (SiO x ; x ≈ 1) pellets prepared by spark plasma sintering of SiO x powders (Sigma-Aldrich, St. Louis, MO) at 1200 °C for 10 min under 100 MPa pressure; (ii) fused silica disks (Technical Glass Products, Painesville, OH). Prior to the vaporization, the synthesis chamber was evacuated below 9 × 10⁻³ Torr using an oil-free scroll pump and then filled to 10 Torr with 99.9% acetylene (C2H2) gas. The CW–CO2 laser beam, focused on the target rotating at 6 rpm, was set at an operating power of 25 W throughout the evaporation time of ∼30 min. Due to a slight pressure increase in the synthesis chamber during the synthesis process, possibly due to the formation of gaseous reaction byproducts, the chamber was evacuated and refilled with acetylene every 5 min. Deposits formed by condensation were collected on a stainless steel shim located 50 mm from the target. After synthesis, the as-deposited powders were scraped off the steel shim and stored.
X-ray diffraction (XRD) patterns were collected using a Bruker AXS D8 Advance diffractometer applying Cu Kα radiation (40 kV/40 mA). Chemical analysis was performed by Mikroanalytisches Labor Pascher applying combustion based techniques for hydrogen, oxygen, and carbon and inductively coupled plasma atomic emission spectroscopy (ICP-AES) for silicon. The morphology of the as-deposited powders was determined by transmission electron microscopy (TEM) using a JEOL JEM-2500SE instrument operated at 200 kV. For sample preparation, the particles were dispersed in ethanol and subsequently drop-cast on holey carbon films supported by TEM specimen grids. Selected area electron diffraction (SAED) was performed on particles reaching over holes to avoid electron diffraction intensity from the amorphous carbon support. Full adsorption/desorption isotherms of nitrogen at partial pressures P/P 0 = 0–1 (P 0 is the saturation pressure at −196 °C) were collected using a Micromeritics ASAP 2020 instrument. Surface area was measured applying the Brunauer Emmett Teller (BET) method. A Netzsch 449 TG/DSC instrument was used for the thermogravimetric (TG) analysis. The evolved gas was analyzed using a MKS Cirrus 2 mass spectrometer.
29Si magic-angle-spinning nuclear magnetic resonance (MAS NMR) and 13C(1H) cross-polarization (CP) MAS NMR spectroscopic measurements were performed on each sample. 1H MAS NMR measurements were performed on the sample obtained using the fused silica target. The 29Si and 13C NMR spectra were collected using a 4 mm Bruker CPMAS probe and a Bruker Avance solid-state spectrometer operating at a field strength of 11.7 T. Samples were loaded into a ZrO2 rotor and spun at 10 kHz for 29Si and 13C(1H) measurements. The single-pulse 29Si NMR spectra were collected at a Larmor frequency of 99.3 MHz using a 60° tip angle (2.39 μs) and a recycle delay of 120 s. Approximately 1000 free induction decays (FIDs) were averaged and Fourier transformed to produce the final spectra. 29Si chemical shifts were externally referenced to tetramethylsilane. 13C(1H)CPMAS measurements were collected at a Larmor frequency of 125.8 MHz for 13C, using a 90° pulse of 2.75 μs, a 1H spin-locking frequency of 38.5 kHz with a contact time of 2 ms, and a recycle delay of 5 s. FIDs were collected under a two-pulse-phase-modulated proton decoupling with a phase modulation angle of 15° and a pulse duration of 6.5 μs in the proton channel. Between 13,000 and 15,000 FIDs were averaged to obtain the spectra. 13C chemical shifts were referenced to glycine. Single-pulse 1H MAS NMR spectrum was collected at a Larmor frequency of 499.75 MHz using a 1.2 mm Agilent CPMAS probe and an Agilent VNMRS spectrometer equipped with an Oxford wide-bore magnet (11.7 T). The sample was spun at 55 kHz in a ZrO2 rotor. A total of 160 FIDs were collected using a pulse tip angle of 45° (0.8 μs), recycle delay of 60 s, and chemical shift was referenced to adamantane.
High temperature oxidative drop solution calorimetry was used to determine the enthalpy of formation of the sample. This method is well developed Reference McHale, Kowach, Navrotsky and DiSalvo21–Reference Navrotsky24 and has been applied previously to study Si–O–C ceramics. Reference Varga, Navrotsky, Moats, Morcos, Poli, Muller, Sahay and Raj17,Reference Morcos, Navrotsky, Varga, Blum, Ahn, Poli, Muller and Raj18,Reference Tavakoli, Armentrout, Narisawa, Sen and Navrotsky25 Using this technique, 1–2 mg pellets were dropped from room temperature into molten sodium molybdate (3Na2O·4MoO3) solvent at 802 °C in a custom built Tian-Calvet twin microcalorimeter Reference Navrotsky22,Reference Navrotsky23 under an oxidizing atmosphere. The reaction rate of the pellet with solvent was accelerated and oxidizing conditions maintained by bubbling oxygen through the solvent at ∼5 mL/min. The pellet dissolved in the solvent within an hour, and converted to cristobalite and CO2 and H2O gases evolved as a result of oxidation. To remove the evolved gases, the oxygen flow at 90 mL/min was used to continuously flush the headspace above the solvent inside the calorimeter. Multiple runs of 1–2 mg pellets were done to obtain appropriate statistics. The calorimeter was calibrated using the heat content of platinum pieces, as described earlier. Reference Liang, Topor, Navrotsky and Mitomo26–Reference Zhang, Navrotsky and Sekine28
III. RESULTS AND DISCUSSION
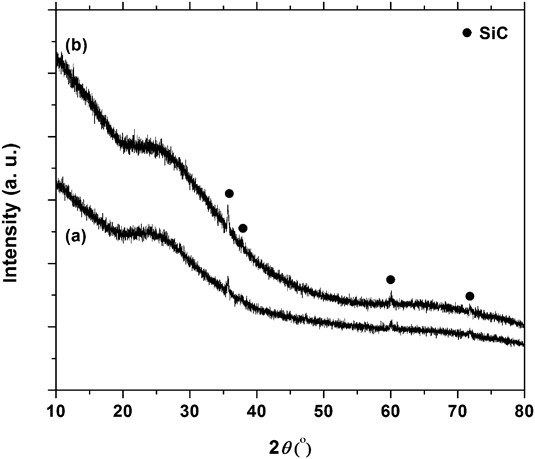
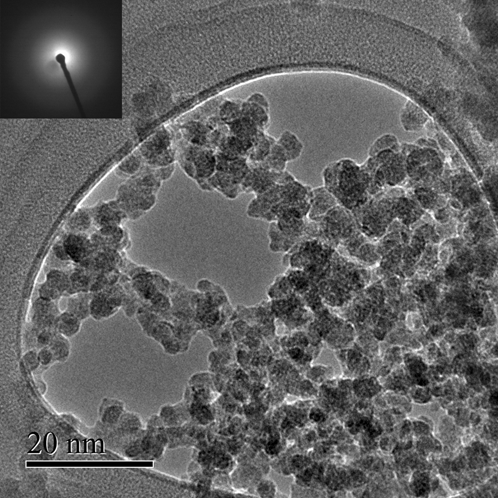
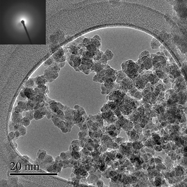
The XRD patterns of the as-obtained deposits are shown in Fig. 1. Except for a few weak peaks that can be readily assigned to SiC, no other peaks were detected, indicating that the deposited materials are mainly amorphous. The bright field TEM image taken from the deposits obtained using the fused silica target is shown in Fig. 2. The particles are nanometer sized with a narrow size distribution ranging from 5 to 10 nm and are highly agglomerated. Their SAED pattern, inset of Fig. 2, shows the halo rings commonly observed for amorphous materials. Thus, the TEM study confirms the formation of amorphous nanoparticles. Since no sign of crystalline SiC was detected by TEM, in contrast to the XRD patterns, we believe that crystalline SiC may not be a product of the primary evaporation/condensation process. In this connection, we observed that a thin layer of SiC forms on the target during the course of synthesis. We surmise that when the high-density laser beam hits the target, some SiC particles detach from the target surface, reach the steel shim, and contaminate the amorphous nanoparticles. We did not detect any crystalline phase by the TEM analysis because, most probably, large and relatively dense SiC particles were segregated during the TEM sample preparation and only the light fluffy amorphous deposits were dispersed in acetone and drop-cast on the TEM grid.
XRD patterns of the samples obtained using SiO (a) and fused silica (b) targets.

Bright field transmission electron microscope (TEM) image taken from the deposits obtained using fused silica target. SAED pattern is shown in the inset of the figure.

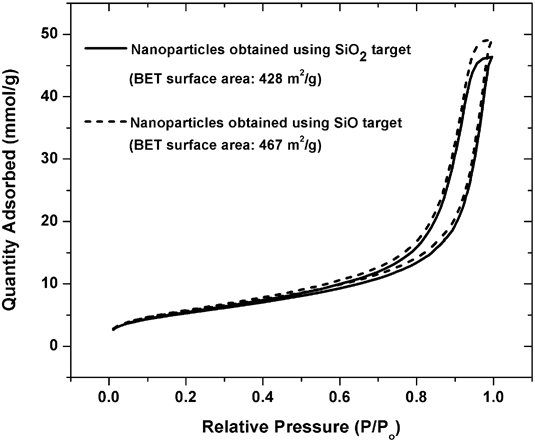
The N2 adsorption/desorption isotherms showed pronounced desorption hysteresis (Fig. 3), suggesting the existence of mesopores between particles. The BET surface areas (SAs) were 467 ± 2 and 428 ± 1 m2/g for the amorphous nanoparticles obtained using silicon monoxide and fused silica targets, respectively. The amorphous nanoparticles obtained in this work have SAs almost three times greater than the mesoporous silicon oxycarbide ceramic for which good gas sensing behavior has been reported. Reference Karakuscu, Ponzoni, Aravind, Sberveglieri and Soraru19 Thus, the new product introduced in this work may be an excellent candidate for use as a gas sensor.
Full N2 adsorption/desorption isotherms measured on the as-obtained deposits after degassing at 400 °C.

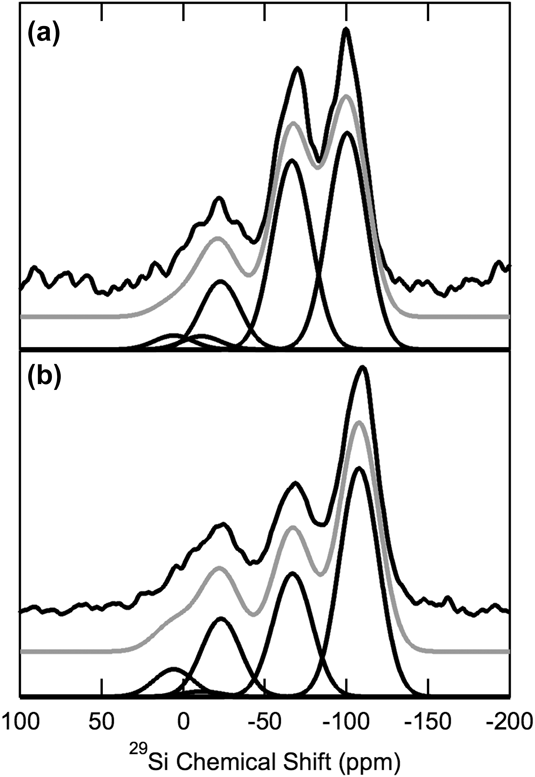
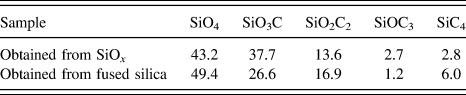
The 29Si MAS NMR spectra are shown in Fig. 4. Silicon in both samples exhibits a highly variable bonding environment. The strongest peak in these spectra in Fig. 4 corresponding to SiO4 environments is characterized by chemical shifts of −100 and −107 ppm for the samples obtained using silicon monoxide and fused silica targets, respectively. Although the latter chemical shift is consistent with that observed in amorphous polymer-derived SiOC ceramics, Reference Widgeon, Sen, Mera, Ionescu, Riedel and Navrotsky6 the peak at −100 ppm most likely corresponds to a Q3-type SiO4 environment with three bridging oxygen atoms and one terminating OH group. The second strongest peak near ∼66 ppm in both 29Si MAS NMR spectra corresponds to a SiO3C unit with one nonbridging oxygen Reference Sen, Widgeon, Navrotsky, Mera, Tavakoli, Ionescu and Riedel29 or possibly a terminating OH group, suggesting a lesser degree of polymerization in these samples. These observations are consistent with the high hydrogen content in these samples (see below). The remaining peaks for SiO2C2, SiOC3, and SiC4 units are located at −23, 6, and −11 ppm, respectively, as in Widgeon et al. Reference Widgeon, Sen, Mera, Ionescu, Riedel and Navrotsky6 The relative abundances of each of these sites, as obtained from spectral line shape simulation (Fig. 1), are listed in Table I. Using the measured chemical composition of the sample obtained using the fused silica target (see Table II), we can estimate that ∼90% of oxygen atoms are bridging. The nonbridging oxygen atoms are believed to be linked to hydrogen because, on the one hand, other than Si, C and O, H has been the only element available in the synthesis environment and, on the other hand, the surface water chemisorbed after exposing the obtained nanoparticles to air atmosphere can cause the formation of OH groups.
29Si MAS NMR spectra samples obtained using SiO (a) and fused silica (b) targets. The raw spectra are shown on the top in black, fitted spectra in gray, and individual components in black on the bottom. The peaks at ∼ −100, −66, −23, 6, and −11 ppm correspond to SiO4, SiO3C, SiO2C2, SiOC3, and SiC4, respectively.

Silicon site occupancies of each sample inferred from 29Si MAS NMR measurements.

Elemental analysis of the Si–O–C–H sample.

wt%, at.% in parentheses. Uncertainty is two standard deviations of the mean.
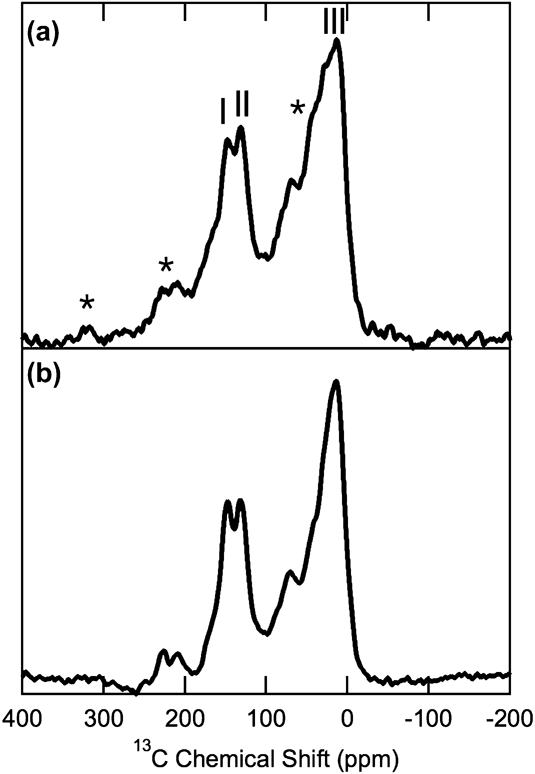
13C(1H) CPMAS NMR spectra are shown in Fig. 5. Three peaks are evident. The first two peaks at approximately −150 and −130 ppm correspond to sp 2 coordinated carbon as in Widgeon et al. Reference Widgeon, Sen, Mera, Ionescu, Riedel and Navrotsky6 The third peak at −15 ppm corresponds to sp 3 coordinated carbon in the Si-based tetrahedral network. CPMAS NMR spectra being nonquantitative, the ratio of sp 2/sp 3 C cannot be estimated from these spectra.
13C CPMAS NMR of the samples obtained using SiO (a) and fused silica (b) targets. Peak I (∼150 ppm) and Peak II (∼130 ppm) correspond to sp 2 hybridized “free” carbon. The sidebands of these peaks are labeled with asterisks. Peak III (∼15 ppm) corresponds to sp 3 hybridized carbon in the silica network.

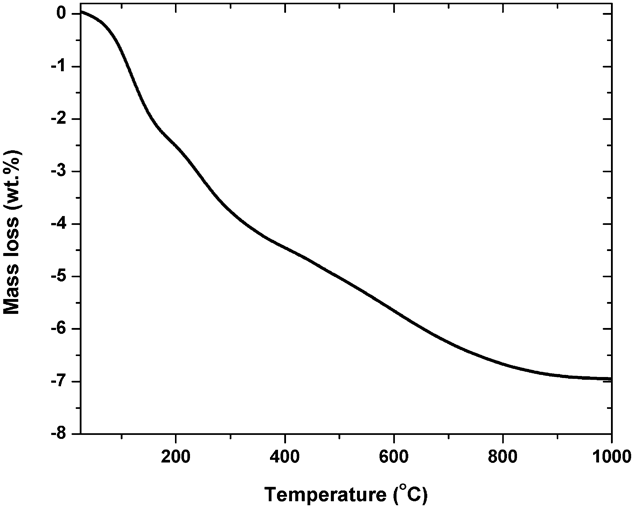
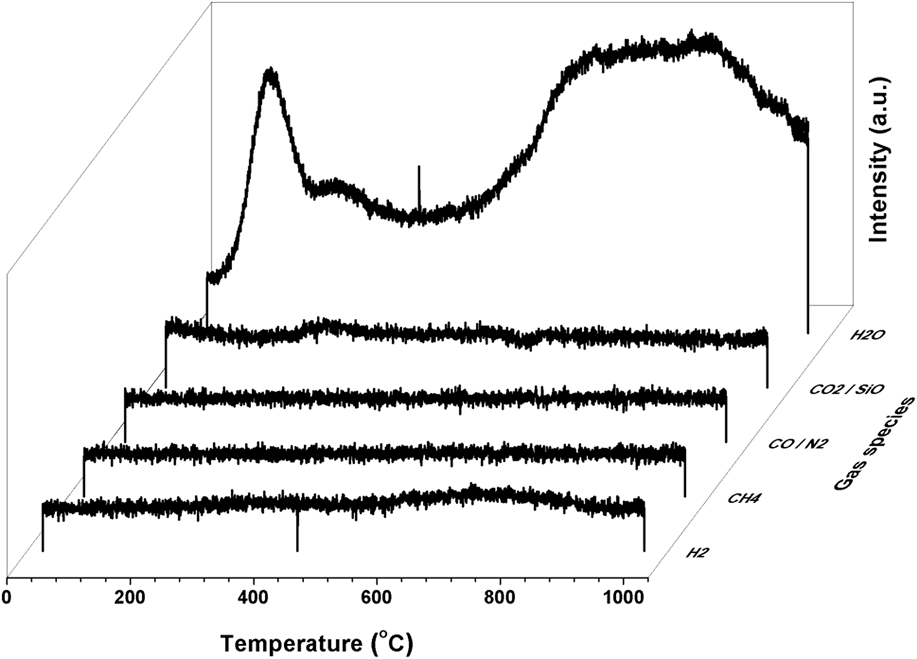
The amorphous Si–O–C–H sample obtained using the fused silica target was used to check the thermodynamic stability. Its analyzed composition is given in Table II. To assign a chemical composition to the nanosample, the amounts of adsorbed surface water and crystalline SiC impurity need to be quantified. Using the TG analysis conducted from 25 to 1000 °C, a weight loss of 7 wt% was measured (Fig. 6). Evolved gas analysis done by a mass spectrometer throughout the TG measurement confirmed that only H2O evolves, as no signal from the evolution of other gases like H2, CH4, CO, CO2, or SiO was detected (Fig. 7). Thus, the whole mass loss is attributed to water loss. Although the results of the XRD analysis indicate the existence of a small fraction of crystalline SiC, the 29Si MAS NMR spectra do not show any indication of the crystallinity. Therefore, the amount of crystalline SiC cannot exceed a few mol% and such a small amount of the contamination may only affect the results of calorimetric measurements within their uncertainties. So, we disregarded the crystalline SiC phase amount in our calculations. Accordingly, the composition of the nano Si–O–C–H sample was determined to be 0.857Si0.22O0.32C0.20H0.26·0.047H2O (Si0.19O0.32C0.17H0.32). (This formula is given in the current format to be consistent in recalling the composition of the anhydrous Si–O–C–H phase throughout the manuscript.) When a Si–O–C–H pellet is dissolved in the solvent during the drop-solution calorimetric measurement, the oxidative dissolution reaction, represented by Eq. (1), has a corresponding enthalpy, which we call ΔH ds of Si–O–C–H:
 $$0.857{\rm{S}}{{\rm{i}}_{0.22}}{{\rm{O}}_{0.32}}{{\rm{C}}_{0.20}}{{\rm{H}}_{0.26}} \cdot 0.047{{\rm{H}}_2}{\rm{O}}\left( {{{25}^\circ }{\rm{C}}} \right) + 0.277{{\rm{O}}_2}\left( {{{802}^^\circ }{\rm{C}}} \right) = 0.188{\rm{Si}}{{\rm{O}}_2}\left( {{{802}^\circ }{\rm{C}}} \right) + 0.171{\rm{C}}{{\rm{O}}_2}\left( {{{802}^^\circ }{\rm{C}}} \right) + 0.158{{\rm{H}}_2}{\rm{O}}\left( {{{802}^\circ }{\rm{C}}} \right)\quad {\rm{.}}$$
TG measurement results of the nano Si–O–C–H sample obtained using the fused silica target indicating the weight loss as a function of temperature.

Mass spectrometric analysis results of gas(es) evolved during the TG measurement. The detected signals corresponding to a number of potential gas species are plotted as a function of temperature.

The ΔH ds measured for the nano Si–O–C–H sample equals −90.9 ± 3.0 kJ/g-atom. The ΔH ds for the sample after correction for the surface water, through the thermodynamic cycle given in Table III, is −110.1 ± 3.1 kJ/g-atom. In our thermochemical calculations, the surface water was presumed to be physisorbed, as an attempt to measure the enthalpy of chemisorption failed, most probably due to the hydrophobic surface nature of the nanoparticles. Considering that the adsorption of water on hydrophobic surfaces, as are likely to exist in these samples, is expected to be weak, treating all the water as physisorbed water for correcting the experimentally obtained ΔH ds is a good approximation. The corrected ΔH ds value, combined with other known thermodynamic quantities, was used to calculate the oxidation enthalpy at 25 °C, ΔH ox, the enthalpy of formation from the elements, ΔH f, elem, and the enthalpy of formation from components SiO2, SiC, C, and H2, ΔH f, comp, through the thermodynamic cycles given in Table IV. The obtained ΔH ox, ΔH f, elem, and ΔH f, comp values, listed in Table V, are −129.9 ± 3.1, −185.8 ± 3.1, and −36.1 ± 3.2 kJ/g-atom, respectively, indicating that the amorphous nano Si–O–C–H sample is energetically more stable than a mixture of the thermodynamically most stable crystalline elemental and binary components. It is notable that our data sensitivity analysis assuming 5 mol% SiC contamination indicated that the enthalpy of formation changes only for ∼2.5 kJ/g-atom, which is within the uncertainty of our measurements as expected. Since the sp 3-bonded Si–O–C network is amorphous and disordered, one expects that the sample is higher in entropy than the mixture of crystalline components. Accordingly, the negative enthalpy of formation coupled with the expected positive entropy of formation from these components ensures a negative Gibbs free energy of formation, confirming thermodynamic stability.
Thermodynamic cycle for correcting the enthalpy of oxidative drop-solution for the surface water.

Thermodynamic cycles for the determination of (a) enthalpy of oxidation
 $\left( {\Delta H_{{\rm{ox}}}^0} \right)$
, (b) enthalpy of formation from the elements
 $\left( {\Delta H_{{\rm{f,}}\;{\rm{elem}}}^0} \right)$
, and (c) enthalpy of formation from the components
 $\left( {\Delta H_{{\rm{f,}}\;{\rm{comp}}}^0} \right)$
at 25 °C for amorphous Si0.22O0.32C0.20H0.26.
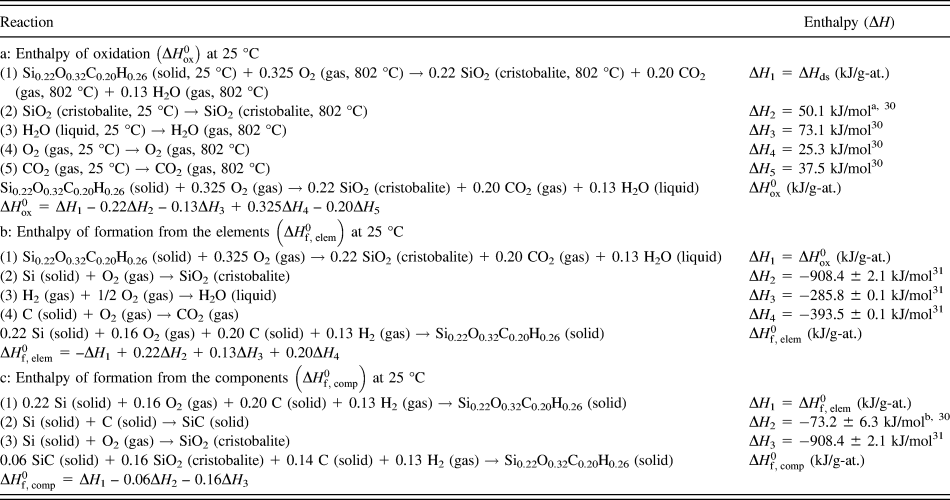
a Low cristobalite at 25 °C, high cristobalite at 802 °C.
b Enthalpy of formation of β-SiC.
Enthalpy of oxidative drop-solution at 802 °C corrected for the surface water and SiC impurity (ΔH ds, corrected), enthalpy of oxidation at 25 °C (ΔH ox), enthalpy of formation from elements at 25 °C (ΔH f, elem), and enthalpy of formation from components SiO2, SiC, C, and H2 at 25 °C (ΔH f, comp) for the amorphous nano S–O–C–H sample.

a Uncertainty is two standard deviations of the mean. The number inside the parentheses is the number of experiments.
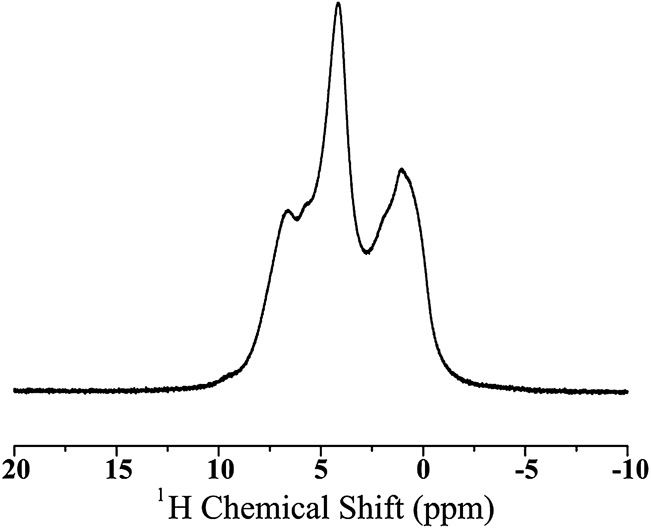
In the following, the structural and energetic impact of hydrogen are addressed, as the sample contains, perhaps unexpectedly, a considerable amount of H (32 at.%). Even after correcting the composition for water, as explained above, the H content of the anhydrous nanosample is still very high (26 at.%), indicating that only a small fraction of the measured H is bonded to the surfaces as physisorbed water. To confirm the chemical environment of H in the structure, a high-resolution 1H MAS NMR spectrum of the nano Si–O–C–H sample, obtained using the fused silica target, was collected at very high spinning speed (55 kHz) (Fig. 8). Three dominant peaks are present in this spectrum at 1.0, 4.2, and 6.7 ppm. The resonances at 1.0 and 6.7 ppm are readily identifiable as C–H bonds with sp 3 and sp 2 carbon, respectively. Reference Silverstein, Bassler and Morrill32,Reference Widgeon, Mera, Gao, Sen, Navrotsky and Riedel33 The peak at 4.2 ppm can correspond to either physisorbed water or Si–OH, as in El Kortobi et al., Reference Kortobi, d’Espinose de la Caillerie and Legrand16 in agreement with our 29Si MAS NMR measurements and the previously reported 1H MAS NMR spectroscopic results on Si–O–C glasses, Reference Bréquel, Parmentier, Walter, Badheka, Trimmel, Masse, Latournerie, Dempsey, Turquat, Desmartin-Chomel, Le Neindre-Prum, Jayasooriya, Hourlier, Kleebe, Sorarù, Enzo and Babonneau34 suggesting the existence of Si–OH. The origin of H in the Si–OH groups could be either chemisorbed water or acetylene (H–C≡C–H) gas used as a carbon source for the synthesis. Although the formation of Si–OH groups through the dissociation of water is easily understandable, the reaction mechanism through which Si–OH groups possibly form by interacting the silicon source and acetylene is unclear. The origin of H forming C–H bonds is believed to be only acetylene gas, as the triple C≡C bonds in acetylene are extremely unstable and easily cleave during the synthesis but the single C–H bonds could remain on the surface or within the structure of the nanoparticles. To estimate the energetic role of hydrogen, we consider the formation reaction of the anhydrous Si–O–C nanoparticles containing H functional groups from a H-free bulk Si–O–C with a similar composition as the nanoparticles and H2 gas, as follows:
 $${\rm{S}}{{\rm{i}}_{0.30}}{{\rm{O}}_{0.43}}{{\rm{C}}_{0.27}} + 0.175{{\rm{H}}_2} \to {\rm{S}}{{\rm{i}}_{0.30}}{{\rm{O}}_{0.43}}{{\rm{C}}_{0.27}} \cdot 0.175{{\rm{H}}_2}\quad {\rm{.}}$$
1H MAS NMR spectrum of the nano Si–O–H–C sample obtained using the fused silica target. Dominant peaks are evident at 1.0, 4.2, and 6.7 ppm.

Although the ΔH f, comp of the H-free composition in Eq. (2) is not known, the ΔH f, comp value for a similar composition (Si0.31O0.47C0.22) has been measured (ΔH f, comp = −9.9 ± 2.0 kJ/g-atom). Reference Tavakoli, Campostrini, Gervais, Babonneau, Bill, Soraru and Navrotsky35 Assuming that ΔH f, comp values for these two similar compositions Si0.30O0.43C0.27 and Si0.31O0.47C0.22 are equal, the enthalpy of formation of the anhydrous Si–O–H–C nanoparticles according to Eq. (2) equals ΔH f = ΔH f, comp (Si0.30O0.43C0.27·0.175H2) – ΔH f, comp (Si0.30O0.43C0.27) = −38.8 ± 4.3 kJ/g-atom of the Si–O–C composition (−221.7 ± 24.5 kJ/mol of H2). (The enthalpy value was taken from Table V.) The strongly exothermic enthalpy obtained for reaction (2) suggests that, despite the unfavorable surface enthalpy due to the high surface area of the nano sample, the negative enthalpy originating from the functional H atoms is large enough to make the formation of hydrogenated nanoparticles energetically favorable relative to bulk hydrogen-free material. Similar stabilization driven by the surface functional groups has been suggested recently for onion-like carbon and diamond nanoparticles. Reference Costa, McDonough, Gogotsi and Navrotsky36,Reference Gustavo, Shenderova, Mochalin, Gogotsi and Navrotsky37
IV. CONCLUSIONS AND IMPLICATIONS
A reactive laser evaporation technique was applied to make Si–O–C nanoparticles without using Si-organic precursors. The technique itself is extremely versatile and can be applied for the synthesis of other complex covalent ceramics such as Si–C–N and B–C–N compounds. The obtained 5–10 nm amorphous nanoparticles contain mixed bonds (O–Si–C) and a significant amount of H bonded to C and to O. The origin of H is mainly from the reactive gas (C2H2) used for the synthesis and partly due to the surface water. The hydrogenated nanoparticles are thermodynamically more stable than the thermodynamically most stable components SiO2, SiC, C, and H2. The nanoparticles are also energetically stabilized relative to a bulk polymer derived SiOC ceramic of similar composition, implying that the stabilizing effect of hydrogenation is greater than the destabilization caused by a high surface to volume ratio. The Si–O–C–H nanoparticles are expected to show promising functional properties, particularly when having a high surface area is desirable. The ability to synthesize SiOC materials with mixed bonding by a direct deposition route, without recourse to pyrolysis of organometallic polymers, is further evidence of their intrinsic stability as confirmed by calorimetric measurements. The laser evaporation/condensation route is much closer to the possible synthesis pathways in planetary condensation and these observations further support our earlier suggestion Reference Sen, Widgeon, Navrotsky, Mera, Tavakoli, Ionescu and Riedel29 that such SiOC materials could form in geologic and planetary environments.
ACKNOWLEDGMENTS
We thank Jorgen Rufner and Dana Reusser for their assistance in TEM and mass spectrometric measurements. We acknowledge financial supports by the National Science Foundation, grant DMR-124077 for salary support and materials science aspects of this work and by the Deep Carbon Observatory funded by the Sloan Foundation for inspiring us to consider the geologic and planetary relevance of these studies.