I. INTRODUCTION
It is known that the zirconium carbide is widely used in the nuclear industry (protective coating of nuclear fuel), Reference Jackson, Lee and Jackson1,Reference Katoh, Vasudevamurthy, Nozawa and Snead2 aviation and aerospace technology (protective coatings of gas turbine system and nozzles of the missiles). Investigation of high temperature properties of carbide and Zr–C phase diagram is important for modern technology and industry. Zr–C phase diagram has been developed for a number of years; one of the variants was proposed in Ref. Reference Guillermet3. So far, the phase diagram is being refined, as not all parts of the phase diagram were checked by the experiments. The limitations of stationary research require the development of the pulsed methods of experimental studies of high-temperature properties of zirconium carbide. One of this method, developed in recent years, is the method of millisecond pulsed laser heating, presented in papers. Reference Jackson, Jayaseelan, Lee, Reece, Inam, Manara, Perinetti-Casoni, De Bruycker and Boboridis4–Reference Manara, Jackson, Perinetti-Casoni, Boboridis, Welland, Luzzi, Ossi and Lee6 The advantages of this method are: (i) the possibility of obtaining the highest temperatures; (ii) the absence of the crucible and the absence of the specimen contamination; (iii) the possibility of conducting experiments in a controlled atmosphere at a controlled shape of the laser pulse; (iv) the saving of the specimen after the experiment for further research. However, this method does not allow investigating the bulk properties of the specimen such as enthalpy, heat capacity, electrical resistance, and the heat of fusion. All of these properties allows you to explore another method of pulsed heating—pulsed electrical heating method. Reference Savvatimskiy and Onufriev7 This method also makes it possible to measure the true temperature of the specimen in the solid and liquid phase using the black body model. Reference Onufriev, Savvatimskiy and Kondratyev8
Apparently, the method of fast pulsed electric heating was applied for the first time to study carbides in 2011. Reference Knyazkov, Kurbakov, Savvatimskiy, Sheindlin and Yanchuk9 Sputtered film of zirconium carbide with a high carbon content was studied in Ref. Reference Kondratyev, Muboyadzhyan, Onufriev and Savvatimskiy10 using pulse current heating. The temperature of ZrC–C eutectic is turned out to be 3150 K, Reference Kondratyev, Muboyadzhyan, Onufriev and Savvatimskiy10 which practically coincides with the equilibrium value. In this report the same method of fast (microseconds) heating was used to obtain thermophysical properties of sintered by SPS method zirconium carbide (resistance, Joule energy, specific heat) at high temperatures, including the melting region and liquid phase. Solidus, liquidus, and heat of melting were simultaneously measured. The issue regarding the applicability of the results obtained by the method of pulse heating for the equilibrium phase diagram is discussed in the literature; according to our preliminary data, such a correspondence is observed for the eutectic temperature. Reference Kondratyev, Muboyadzhyan, Onufriev and Savvatimskiy10 In the present study, the thermophysical properties of ZrC for the solid and for the liquid state are proposed up to 5000 K.
II. MATERIAL AND METHODS
A. Specimen preparation
A block of zirconium carbide in the form of a disk with a diameter of about 40 mm and with a thickness of 5 mm was produced by the SPS method (Spark plasma sintering method) in the Russian Aviation Institute (VIAM). It was used with the ZrC powder with a grains size <40 µm. The mode of sintering: temperature—2300 K; pressure—35 MPa; holding time—30 min.
The block was cut into the plates (width 5 mm, length 15 mm, a thickness of about 250 µm) using a diamond disk. Further, the obtained plates were polished manually on the diamond skins to obtain a thickness of 50–100 µm. Finally the specimen surface was treated with diamond sandpaper with grain size of 7 µm. Similar methods were used by us earlier. Reference Onufriev, Savvatimskiy and Yanchuk11
The density of the carbide was determined by weighing the part of initial disk by an electronic balance GR-202 (A&D Corporation, Tokyo, Japan) and the determination of its geometric dimensions. It has a density equals to 6.57 g/cm3. The calculation of the density ZrC x according to the formula for nonporous carbide is given in the review Reference Katoh, Vasudevamurthy, Nozawa and Snead2 :
 $$d = 6.05 + 0.24x + 0.32{x^2}\;\left( {{{\rm{g}} \mathord{\left/ {\vphantom {{\rm{g}} {{\rm{c}}{{\rm{m}}^3}}}} \right. \kern-\nulldelimiterspace} {{\rm{c}}{{\rm{m}}^3}}}} \right)\quad .$$
Analysis shown for our case x = 0.95 (ZrC0.95) and it gives a density equals to 6.567 g/cm3. The coincidence of the measured and calculated density indicates a very low porosity of the specimens. The tests of the specimens were carried out at JIHT RAS and Prokhorov General Physics Institute (PGPI). SEM, element and XRD analyses were performed at JIHT RAS; and XRD analysis—at PGPI.
B. SEM and elemental analyses
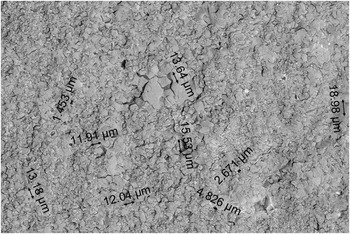
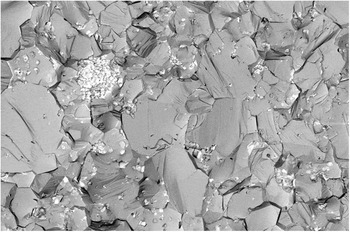
The analysis of the microstructure and assessment of elemental composition on the surface of the plate fracture was carried out by the microscope Nova NanoSem 650 (FEI Company, Hillsboro, Oregon) using the secondary electron detector, a ring detector of back-scattered electrons, and EDAX system. The analysis found that the fracture of the specimen had a developed relief surface with dispersed inclusions of C. Microstructure of the ZrC specimen is shown in Figs. 1 and 2. The specimens had the following composition: (the average data for three points are shown, at.%): C—45.0; Zr—47.4; Hf—0.4; N—3.4; O—3. The rest of the impurities were Fe, Ni, Na, Al. The ratio of C/Zr equals 0.95.
The general view of microstructure of the fracture surface of the ZrC specimen: it has observed grains sizes from ≈2 to 20 µm. The regions with ∼1–2 wt% free carbon phase are dominated on the fracture surface.

The microstructure of the fracture surface of the ZrC specimen (10-fold increase in comparison with Fig. 1). Energy dispersive analysis found that the bases of the gray phases are Zr and C, and the light phase is enriched by C.

C. XRD analysis
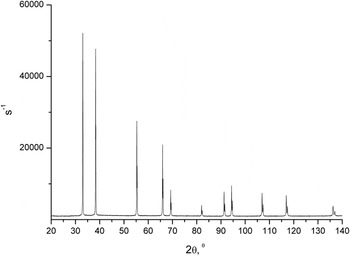
Analysis of ZrC specimens was performed by X-ray diffractometer Bruker D8 Discover A25 DaVinci Design (Bruker Corporation, Karlsruhe, Germany) using Cu Kα radiation. Decoding of the spectra was performed using the database PDF-2 version 2011.
The obtained diffraction pattern is shown in Fig. 3, which corresponds to the cubic zirconium carbide ZrC.
An example of a diffraction pattern obtained from the surface of the plate ZrC. The position of peaks and their sizes correspond to the standard diffraction pattern for ZrC (may be obtained through database PDF-2 version 2011). The calculated parameter for unit cell is 4.6987 ± 0.0003 Å.

The X-ray diffraction analysis was performed additionally (by the installation DRON-2, Cu Kα radiation) according to standard methods on the study of phase composition of the specimen. The study was performed on a powder sample prepared from the plate of ZrC. The analysis showed that the dominant phase in the material is a zirconium carbide, having the lattice parameter 4.694 ± 0.001 Å. The lack of physical broadening of the diffraction lines for zirconium carbide indicates a high degree of perfection of the crystal lattice of ZrC. The latter is possible only at a sufficiently constant ratio of C/Zr in the volume of the lattice. The average size of coherent scattering regions of ZrC is not less than 100 nm. Along with the zirconium carbide, in the material it was recorded the presence of graphite. In powder sample the content of graphite is ≈1 vol%.
According to Ref. Reference Jackson, Lee and Jackson1 cell parameter of zirconium carbide (under there are impurities of oxygen and nitrogen) can be estimated by the formula (a—in Å)
 $$a = 4.5621 + 0.3418x - 0.2080{x^2} - 0.80y(1 - x)\quad ,$$
where “x is the C/Zr atomic ratio and y is the (O + N)/Zr atomic ratio”. Reference Jackson, Lee and Jackson1 In our case, x = 0.949 and y = 0.135, which gives the lattice parameter 4.6937 Å. This value is near to the value obtained by the diffraction pattern of the installation DRON-2 (a = 4.694 ± 0.001 Å).
D. Cell for specimen fixing
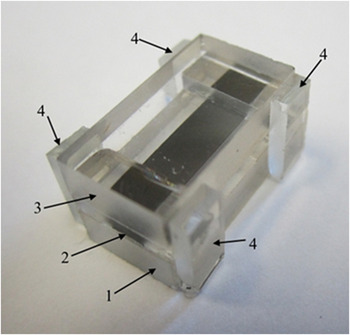
The carbide specimen was glued on the bottom plate of quartz glass (3.3 × 8 × 15 mm) and then clamped between the bottom and the top plate of quartz glass in such a manner that there was a small gap (about 20–35 μm) above carbide plate, which prevents from the appearance of cracks in the top plate. The glue thickness was about 10 μm. And after that the additional plates made of glass pasted the side of the cell (Fig. 4). And finally, the cell was clamped by the ends between two electrodes. Thus, the specimen was clamped in a confined volume. Heating and expansion of the specimen led to a slight increase in pressure in the cell.
A quartz glass cell with a specimen of zirconium carbide (thickness 100 µm, width 5 mm, length 15 mm). 1—The bottom plate of quartz glass; 2—the end of carbide specimen; 3—the top plate of quartz glass; 4—side glass plate (glued with super glue-point).

E. Installation and temperature measurement
The method of heating and the installation are presented in Ref. Reference Kondratyev, Muboyadzhyan, Onufriev and Savvatimskiy10. Temperature measurement was carried out by radiance of a specimen with the help of high-speed pyrometer, based on the photo-detector PDA-10A (Thorlabs Inc., Newton, New Jersey). Reference Kondratyev, Muboyadzhyan, Onufriev and Savvatimskiy10 Before a pulse experiment, the pyrometer was calibrated against a temperature tungsten lamp SI-10-300 (Moscow Electric-Bulb Plant, Moscow, Russia) at a temperature of 2515 K. Measurements were performed at a wave length λ = 856 nm. The surface temperature of the carbide specimen was calculated by the formula
 $$T = {{{C_2}} \over {\lambda \ln \left[ {{{{U_0}{\varepsilon _{n\lambda }}{\tau _\lambda }} \over {U\varepsilon _{n\lambda }^0\tau _\lambda ^0}}\left( {\exp {{{C_2}} \over {\lambda {T_0}}} - 1} \right) + 1} \right]}}\quad ,$$
where C
2 is a constant in Planck’s formula; U
0; U—signal of the pyrometer under calibration and the signal from the specimen; ε
nλ,
 $\varepsilon _{n\lambda }^0$
—normal spectral emissivity of the surface for carbide and for tungsten ribbon lamp SI-10-300;
 ${\tau _\lambda } = \prod\limits_i {{\tau _{i\lambda }}}$
—the total transmittance of the top plate of the cell (τ1λ) and protective glass (τ2λ)—the elements that are missing during the calibration of the pyrometer;
 $\tau _\lambda ^0$
≈ 0.92—transmittance for the window of the lamp temperature; T
0 = 2515 K—a temperature for lamp SI-10-300. The transmittance τiλ was measured by Shimadzu UV-240 spectrophotometer (Shimadzu Corp., Kyoto, Japan) at a wave length 856 nm.
Measuring of the specimens’ temperature requires knowledge of the surface emissivity of the carbide in solid and liquid phases. The emissivity values (λ = 856 nm) were chosen through the results of investigations of Refs. Reference Manara, Jackson, Perinetti-Casoni, Boboridis, Welland, Luzzi, Ossi and Lee6, Reference Kondratyev, Muboyadzhyan, Onufriev and Savvatimskiy10, Reference Reithof, Acchione, Branyan and Herzfeld12, and Reference Zapadaeva, Petrov and Sokolov13. These values for solid phase varied from 0.5 Reference Kondratyev, Muboyadzhyan, Onufriev and Savvatimskiy10,Reference Reithof, Acchione, Branyan and Herzfeld12 at 3000 and 2670 K up to 0.563 ± (3.3%) at 2900 K Reference Zapadaeva, Petrov and Sokolov13 , and 0.581 ± (7.3%) at 3155 K. Reference Manara, Jackson, Perinetti-Casoni, Boboridis, Welland, Luzzi, Ossi and Lee6 We accepted ε nλ = 0.6 for solid phase of the ZrC, taking into account that the specimen surface in present study was rough (surface was treated with diamond sandpaper). ε nλ = 0.487 ± (7.2%) at 3155 K (eutectic melt) was obtained for liquid phase in Ref. Reference Manara, Jackson, Perinetti-Casoni, Boboridis, Welland, Luzzi, Ossi and Lee6, and ε nλ = 0.6 ± 0.1 was obtained at 3260 K. Reference Kondratyev, Muboyadzhyan, Onufriev and Savvatimskiy10 In this study we accepted for the liquid phase ε nλ = 0.6 also.
Read more on the methods of temperature measurement during a pulsed heating process in Ref. Reference Kondratyev, Muboyadzhyan, Onufriev and Savvatimskiy10.
F. Uncertainties
We have measured: temperature, Joule energy, specific heat, heat of melting, specific resistivity (ignoring thermal expansion of a specimen). The last has uncertainty ±10% due to not perfect specimen geometry. Specific Joule energy, usually measured by this method with an accuracy of about 5–6%, in the present study was measured with an uncertainty of ±10% for the same reason. Estimation shows that the main contribution to the uncertainty of temperature measurement δT/T in present study introduces the uncertainty of emissivity δε nλ/ε nλ ≈ 10%. So δT/T, may be evaluated by the expression
 $${{\delta T} \over T} \approx {{\lambda T} \over {{C_2}}}{{\delta {\varepsilon _{n\lambda }}} \over {{\varepsilon _{n\lambda }}}}\quad .$$
Formula (4) follows from (3); in the conclusion we may obtain δT ≈ ±60 K at 3000 K (solid phase) and δT ≈ ±110 K at 4000 K (liquid phase). The uncertainty of specific heat measurement equals ±26% for solid and liquid phases (excepting phase transition).
III. RESULTS FOR THE PULSE EXPERIMENTS
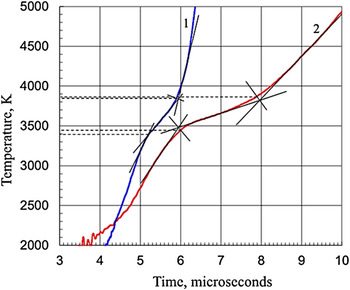
All the experiments were fulfilled in the air. Figure 5 shows the dependence of the temperature against time for the two specimens under different velocity of heating.
The result of direct temperature measurements for the two experiments under different times of heating. 1—The faster heating for the specimen of 45 µm thickness; 2—the slower heating for the specimen of 102 µm thickness. The regions of phase transition (melting) are the areas with a reduced rate of temperature rise.

Figure 5 shows the possibility of measuring temperature during melting under fast heating by electrical pulse current. Unfortunately, we have to use tangents lines to determine the start and the end of phase transitions, because these transitions appear as smooth sections in the temperature curve. However, even these two experiments show that the beginning of the phase transition temperature is close to the 3450 K (the slower heating was chosen, since in this case there is a gentle curve, it is thus possible to more precisely determine the temperature of the phase transition). The final temperature of the phase transition is close to 3850 K for both experiments. These temperatures are indicated by dashed lines (Figs. 5 and 6) and arrows in the following figures (Figs. 7 and 8), given as an example for one of the experiments.
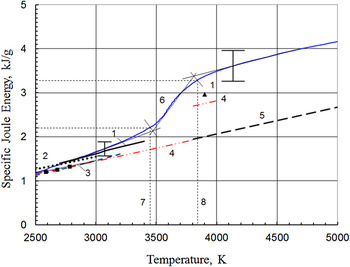
The dependence of input Joule energy against temperature. Comparison with the data on enthalpy. 1—(solid black curve—solid phase; triangle 1—liquid phase) Ref. Reference Schick14; 2 (dotted line)—Ref. Reference Sheindlin, Chekhovskoy and Shpilrain15; 3—Ref. Reference Bolgar, Turchanin and Fesenko16 for 2500–3000 K; 4 (dotted-dashed line)—Ref. Reference Barin17 for 2500–3900 K; 5 (dashed line)—data of Ref. Reference Chase18 for liquid phase. Data of Ref. Reference Chase18 for solid phase are practically coincide with the data for solid phase of Refs. Reference Bolgar, Turchanin and Fesenko16 and Reference Barin17; 6—present investigation; 7—temperature for the start of phase transition T sol = 3450 K (Joule energy E 1 = 2.2 kJ/g); 8—temperature for the end of phase transition T liq ≈ 3850 K (Joule energy E 2 = 3.3 kJ/g). Heat of melting equals E 2 − E 1 = 1.1 kJ/g. Squares—experimental data of Ref. Reference Levinson19. Dashed curve (up to 3200 K)—calculated data of Storms et al. Reference Storms and Griffin20 The uncertainties of present study are shown by horizontal and vertical bars. For temperature 3000 K (solid phase) we obtain δT ≈ ±60 K; for temperature 4000 K, δT ≈ ±110 K (liquid phase). The temperature dependence of H(T) (curve 5), Reference Chase18 up to 3805 K practically coincides with the data of Ref. Reference Barin17 (curve 4) and for liquid state data of Ref. Reference Chase18 (curve 5) continue rising up to 5000 K.

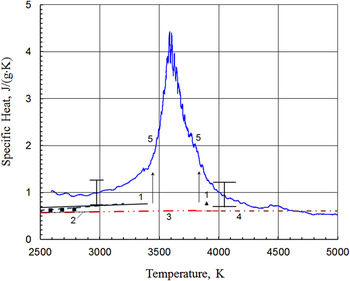
The specific heat for ZrC. 1 (solid line)—Ref. Reference Schick14; 2 (solid line)—Ref. Reference Bolgar, Turchanin and Fesenko16 for 2500–3000 K; 3 (dotted-dashed line)—Ref. Reference Barin17 for 2500–3900 K; 4 (dotted-dashed line)—data of Ref. Reference Chase18 for liquid phase. Data of Ref. Reference Chase18 for solid phase are coincide with data for solid phase of Refs. Reference Bolgar, Turchanin and Fesenko16 and Reference Barin17; 5—present investigation. Squares—data of Ref. Reference Levinson19; dashed line (up to 3200 K)—calculated data of Storms et al. Reference Storms and Griffin20 Arrows indicate the start (3450 K) and the finish (3850 K) of melting (according to result of Fig. 5). The uncertainties are shown by horizontal and vertical bars. We obtain δT ≈ ±60 K at 3000 K (solid phase) and δT ≈ ±110 K at 4000 K (liquid phase).

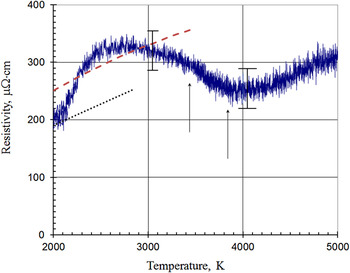
The resistivity for ZrC (referred to initial dimensions). Solid line—present experiment; dashed line—Ref. Reference Petrov, Chekhovskoy, Sheindlin, Nikolaeva and Fomina21; dotted line—recalculated to initial dimensions data of Ref. Reference Grossman22. Temperatures of solidus (3450 K) and liquidus (3850 K) are shown by arrows, just the same as it was obtained in Fig. 5. The uncertainties are shown by horizontal and vertical bars at 3050 and 4050 K. The diminishing of the ρ after the temperature ≈3000 K may be caused by the (unmeasured) rising pressure in the cell shown in Fig. 4 (resistivity is rather sensitive under changing the pressure).

The area of melting in these curves has a reduced slope (with a reduced rate of temperature rise). Fig. 5 shows the method for determining the start and the end of phase transition, i.e., the temperature of a solidus (T sol) and liquidus (T liq), respectively. It also shows that the T sol in the two experiments equal to 3400 and 3450 K; and T liq for these two experiments were almost identical and equals to 3850 K.
Coincidence of temperatures of phase transition at a varying speed of heating (in the frame of 10 microseconds) indirectly indicates constant spectral emissivity of the specimen during heating: the absence of significant changes (oxidation) of the surface of the specimen in a closed cell. The results of the experiments presented in Ref. Reference Kondratyev, Muboyadzhyan, Onufriev and Savvatimskiy10, also show a small influence of the medium surrounding the specimen (water or air in a closed glass cell), on the temperature measurement.
Figure 6 shows the dependence of the input energy
 $E = {1 \over m}\int_0^t {IU\,{\rm{d}}t}$
(where m—is the mass of a specimen; I—is the current through the specimen; U—the voltage along the specimen) against the temperature for the specimen (shown as 2 in Fig. 5). The start of the phase transition T
sol = 3450 K, takes place at the specific Joule energy E
1 = 2.2 kJ/g. The end of the phase transition T
liq = 3830 K (Fig. 6), practically coincides with T
liq, measured by the thermogram (Fig. 5). The end of melting corresponds to a specific Joule energy E
2 = 3.3 kJ/g. Thus, the heat of fusion of ZrC0.95 (density 6.57 g/cm3) equals to (3.3–2.2) = 1.1 kJ/g.
We estimate the heat loss during the heating of the carbide specimen. Upon heating the specimen, the adhesive layer connecting the specimen with the bottom plate, evaporated, and the bottom plate is separated from the specimen by a gap filled with the vapor of glue. Thus, the contact of the specimen with the lower quartz plate is missing and therefore the loss of the heat in the plate by conduction is negligible. Top plate is also separated from the specimen gap and the loss of heat to it by conduction is also small. Thus, the heated carbide specimen loses heat mainly by radiation and, as shown in Ref. Reference Kondratyev, Muboyadzhyan, Onufriev and Savvatimskiy10, these losses are small.
The presence of gap is important from another point of view. Due to the gaps between the carbide plate and the quartz glass plates, the pressure in the cell during heating will increase slightly, i.e., the heating process can be considered isobaric and specific Joule energy to be equal to the enthalpy of the specimen. That is why we compare (in Fig. 6) measured input Joule energy with the enthalpy data obtained from the literature.
Earlier Reference Knyazkov, Kurbakov, Savvatimskiy, Sheindlin and Yanchuk9 (without temperature measurement) it was obtained for ZrC (volume density 6.6 g/cm3) E 1 = 2.1 kJ/g; E 2 = 3.0 kJ/g. The difference—melting heat is 0.9 kJ/g.
The temperature dependence of the specific heat, obtained from data for Joule energy and temperature, calculated in the same way as in Ref. Reference Kondratyev, Muboyadzhyan, Onufriev and Savvatimskiy10, shown in Fig. 7.
Resistivity ρ (referred to initial dimensions) at 3000 K equals to ≈320 ± 20 µΩ cm. At the start of melting (3450 K) resistivity equals to ≈290 ± 20 µΩ cm. Resistivity equals to ≈250 ± 20 µΩ cm at the finish of melting (3850 K). Above 3850 K it starts monotonic increase in the electrical resistivity of liquid zirconium carbide (up to 5000 K in Fig. 8).
IV. DISCUSSION
A. The enthalpy
We measured the Joule energy of heating, which, due to the low pressure growth in the cell in present study (see above), is close to the enthalpy H(T). A comparison of our data with published data on the enthalpy is presented in Fig. 6 that shows the results of original works and the most well-known reference data on H(T) for zirconium carbide stoichiometric or near stoichiometric composition. Up to 3000 our data are agree with the data of Refs. Reference Schick14 and Reference Sheindlin, Chekhovskoy and Shpilrain15. Discrepancy above 3000 K—the steeper growth of our data before melting, can be associated with the formation of nonequilibrium point defects (see below). The data of Refs. Reference Bolgar, Turchanin and Fesenko16–Reference Storms and Griffin20 practically coincide with each other for the solid phase up to 3000 K. These data are below of our data by ≈10%. The data of Ref. Reference Barin17 at a temperature of 3805 K (melting temperature) change abruptly to a higher value corresponding to the liquid phase, which is ≈20% below of our data for the liquid state. The temperature dependence of H(T), Reference Chase18 up to 3805 K practically coincides with the data of Ref. Reference Barin17, at the melting point does not undergo the jump, and continues up to 5000 K. The work Reference Chase18 is the only one in which there is no jump of enthalpy at the melting point.
The heat of melting for ZrC x (the difference between the enthalpies of the liquid and solid phases) was measured in Ref. Reference Knyazkov, Kurbakov, Savvatimskiy, Sheindlin and Yanchuk9 and was calculated in Ref. Reference Brykin23. The value obtained in Ref. Reference Knyazkov, Kurbakov, Savvatimskiy, Sheindlin and Yanchuk9 (without temperature measurement) equaled 0.9 kJ/g. It was noted in Ref. Reference Brykin23 that the calculated enthalpy of melting is strongly dependent on the composition, i.e., on the ratio of x = C/Zr. The dependence of enthalpy of melting of ZrC system against x was shown in Ref. Reference Brykin23, and for C/Zr = 0.95 (this is the case of present study), gives a heat of fusion of about 1.07 kJ/g. Reference data give (Fig. 6): Ref, Reference Schick14—1.07 kJ/g; Ref. Reference Barin17—0.77 kJ/g. In this study, we have obtained 1.1 kJ/g (Fig. 6) that is in a reasonable agreement with the calculation of Refs. Reference Schick14, Reference Barin17, and Reference Brykin23 and previously measured value. Reference Knyazkov, Kurbakov, Savvatimskiy, Sheindlin and Yanchuk9
B. The specific heat
Our data for the solid phase lie above the data of other works of about 25% (Fig. 7). The dashed curve in Fig. 7 shows the dependence C p(T), Reference Storms and Griffin20 which is a derivative based on H(T), shown as a dashed curve in Fig. 6. Squares are the data Reference Levinson19 obtained by differentiating the dependence of enthalpy on temperature. The accuracy of these data is not specified and could be large enough that, as it was known, due to the procedure of differentiation. Our data represent a direct measurement of C p (for the temperature step of 150–250 K).
In Refs. Reference Bolgar, Turchanin and Fesenko16 and Reference Turchanin24 it was found that the excess of the enthalpy of zirconium carbide at temperatures above 2200 K over the values obtained by extrapolation of the data obtained up to 2200 K. This increase was related to thermal equilibrium vacancies formation and the energy of the vacancies formation was calculated in Refs. Reference Bolgar, Turchanin and Fesenko16 and Reference Turchanin24. In our case of microsecond heating the mechanism of the formation of thermal equilibrium vacancies, associated with their diffusion in the sample, is not working; the relaxation time of such point defects is estimated to be much larger than the heating time. However, in our experiments it is also observed enthalpy growth (Joule energy growth) and the steep increase in the specific heat under approaching to the melting point. Consistent explanation for this case is the assumption that there is a formation of nonequilibrium Frenkel defects (vacancy + interstitial atom).
C. The specific resistivity (referred to initial dimensions)
The review Reference Jackson, Lee and Jackson1 provides data on the specific resistivity ρ(T) for ZrC x in the range of temperatures from room temperature up to 3500 K. It was observed large scatter of the data resulting from differences in the stoichiometry of the specimens, the crystal structure, presence of impurities, porosity, excess carbon, and the method of preparation. The saturation (the change of resistivity curve up to maximum level) is observed for the temperature dependence at high temperatures (2200–2500 K for single crystal and near the melting point for a polycrystalline specimen). In our case, saturation is also observed at temperatures of 2500–3000 K, followed by the fall ρ(T) before the end of the melting and further increasing in the liquid phase.
Resistivity equals to 280 µΩ cm (single crystal); 330 µΩ cm (sintered carbide ZrC1.06), all for temperature 3000 K. Reference Jackson, Lee and Jackson1 In our experiment (Fig. 8) for zirconium carbide (≈ZrC0.95) the resistivity for T = 3000 K equals to 320 µΩ cm. Resistivity of zirconium carbide (close to stoichiometry Reference Katoh, Vasudevamurthy, Nozawa and Snead2 ) equals to ≈280 µΩ cm for 3000 K (extrapolation). There is an impurity of oxygen and nitrogen in our specimens; however, as it was indicated in Ref. Reference Jackson, Lee and Jackson1, the influence of these impurities on ρ(T) has not been studied.
The data of Ref. Reference Petrov, Chekhovskoy, Sheindlin, Nikolaeva and Fomina21 obtained on the sintered sample with an initial porosity of 12.6% are shown in Fig. 8 also. The sample contained (in at.%): free carbon before the experiment—4.48 and after—1.41, as well as oxygen and nitrogen impurities 1.2–1.27 and 2.43–1.77 respectively. The ratio of C/Zr in the course of the experiments changed from 1.08 to 1.03. From Fig. 8 it can be seen that the data of Ref. Reference Petrov, Chekhovskoy, Sheindlin, Nikolaeva and Fomina21 (3% error in resistivity) lie in our experimental uncertainty band, excluding the region near 2000 K, where our data coincide with the data of Ref. Reference Grossman22. The specimens in Ref. Reference Grossman22 were obtained by hot pressing, and were similar in composition (C/Zr = 1.02 and 1.042) and porosity (9.1%) to the samples studied in Ref. Reference Petrov, Chekhovskoy, Sheindlin, Nikolaeva and Fomina21. But the nitrogen content in the specimens of Ref. Reference Grossman22 was ∼10 times lower. In our specimens the content of nitrogen and oxygen is about two times higher than in Ref. Reference Petrov, Chekhovskoy, Sheindlin, Nikolaeva and Fomina21, and the porosity (∼0.6%), that is 20 times lower.
D. Liquidus temperature for ZrC0.95
Liquidus temperature for ZrC x (0.85 < x <1) is close to the temperature of congruent melting of zirconium carbide. There are different values of this temperature in the phase diagrams, for example, Ref. Reference Katoh, Vasudevamurthy, Nozawa and Snead2 gives—3723 K; Ref. Reference Guillermet3—3700 K; Ref. Reference Sara25—3693 K; Ref. 26—3813 K. The liquidus temperatures of 3625 K (ZrC0.96) Reference Jackson, Jayaseelan, Lee, Reece, Inam, Manara, Perinetti-Casoni, De Bruycker and Boboridis4 and 3670 (ZrC0.90) Reference Jackson, Jayaseelan, Manara, Perinetti-Casoni and Lee5 were obtained in experiments with laser heating of zirconium carbide. The congruent melting temperature 3800 K was obtained in Ref. Reference Bgasheva, Brykin, Falyakhov and Sheindlin27 by millisecond laser heating.
Our measurements show a temperature of 3450 ± 60 K for the solidus and 3850 ± 100 K for liquidus line. The first value is consistent with the corresponding point (for C/Zr = 0.95) of phase diagram published in Refs. Reference Katoh, Vasudevamurthy, Nozawa and Snead2, Reference Guillermet3, and 26. The liquidus value (3850 K) is consistent with Refs. Reference Barin17, 26, and Reference Bgasheva, Brykin, Falyakhov and Sheindlin27 and is not consistent with Refs. Reference Katoh, Vasudevamurthy, Nozawa and Snead2–Reference Jackson, Jayaseelan, Manara, Perinetti-Casoni and Lee5 and Reference Sara25.
In the conclusion, mention some important points of the pulse investigation:
-
(1) The main achievement of this experimental study is to obtain thermophysical and electro-physical properties for sintered zirconium carbide (C/Zr ≈ 0.95) for solid and liquid states near the phase transition. The possibility of obtaining experimental data in the high temperature region where the use of stationary experiments are difficult, is demonstrated. Previously, such pulse current heating was used to obtain high temperature properties for sputtered layers of ZrC + C and ZrN. Reference Kondratyev, Muboyadzhyan, Onufriev and Savvatimskiy10,Reference Onufriev, Kondratyev, Savvatimskiy, Val’yano and Muboyadzhyan28
-
(2) The shape of the specimen and its position stayed unchanged due to the high rate of heating and due to the use of stabilizing cell. It gives a possibility to measure volume properties of the material (resistivity, specific heat, Joule specific energy) at high temperatures, including liquid state.
-
(3) It was established that the melting of the carbide occurs in the temperature range: solidus—3450 K and liquidus—3850 K, that is close to the values presented in some of equilibrium phase diagrams of the system Zr–C. In the previous study Reference Kondratyev, Muboyadzhyan, Onufriev and Savvatimskiy10 the eutectic temperature for ZrC–C system of 3150 K was measured, that is practically coincide with the calculated value (3200 K Reference Guillermet3 ). This entire means that there is no shift of the phase transition points at heating rates up to 108 K/s, and makes it possible to use this fast pulse electrical heating method for the study of high temperature behavior of complex substances. At present for investigation of the ultra-high temperature materials the pulsed laser heating method is used. Reference Cedillos-Barraza, Manara, Boboridis, Watkins, Grasso, Jayaseelan, Konings, Reece and Lee29
-
(4) The steep increase of the specific heat before melting may be associated with the formation of nonequilibrium pairs point Frenkel defects Reference Frenkel30,Reference Frenkel31 at high temperatures under fast heating. The energy goes not to increase temperature (as someone may conclude), but is accumulated in the lattice, increasing the specific heat and providing a short-term existence of nonequilibrium pairs point Frenkel defects before the emergence of advanced transition into the liquid phase. The same effect of high specific heat before melting is observed under fast heating for graphite specimens Reference Savvatimskiy, Onufriev and Kondratyev32 and for metal specimens (see Ref. Reference Savvatimskiy and Onufriev7). In this regard, it is welcomed calculations that take into account this effect. The approaches developed in Refs. Reference Brykin23 and Reference Orekhov and Stegailov33, are the most promising; as they seem to be the most flexible tool for the analysis of pulsed heating processes.
ACKNOWLEDGMENTS
The study is executed under support of the Russian Science Foundation in the framework of the grant no. 17-19-01099.