


INTRODUCTION
On October 2, 2012, with the general election weeks away, a Pennsylvania judge suspended the state’s new voter identification law, which would have required Pennsylvanians to show ID at the polls. Despite this, television ads highlighting the then-defunct requirement were still broadcast after the ruling and a large Spanish-language billboard stating that ID would be required remained on a prominent Philadelphia highway for weeks. This raised concerns that a lack of information would create confusion among voters.Footnote 1 Similar issues extend beyond Pennsylvania; between 2002 and 2012, twenty other US states adopted additional ID requirements for voting. Many voters—even in states without these new requirements—held inaccurate beliefs about whether they needed ID in the 2012 elections.Footnote 2 Amid heated debate over possible discriminatory effects of these laws, there has been concern that changes to voting requirements raise informational costs to voting, differentially reducing turnout among those with less access to information, such as the Spanish-speaking voters targeted by the Philadelphia billboard (Vercellotti and Andersen Reference Vercellotti and Andersen2009).
At the front lines of the effort to inform voters about new voting requirements stand nearly 8,000 “street-level bureaucrats,” the county and municipal administrators who implement the nation’s electoral laws (Kimball and Kropf Reference Kimball and Kropf2006). Like other street-level bureaucrats, local election administrators often have considerable discretion in how they manage the election system, operate with little direct oversight from state officials, and are frequently time and resource constrained (Burden et al. Reference Burden, Canon, Mayer and Moynihan2012; Reference Brodkin2013).Footnote 3 Scholars of bureaucracy have argued that when local bureaucrats have discretion in allocating effort and resources, racial, ethnic, or partisan bias can occur unless clear procedures are in place to prevent bias (Brodkin Reference Brodkin1997; Jones et al. Reference Jones, Greenberg, Kaufman and Drew1977; Lipsky Reference Lipsky1980). Discretionary bias from bureaucrats is of particular concern in the electoral system because differential treatment of potential voters has implications for the composition of the electorate and the nature of democratic political representation.
As a wave of new voting requirements is implemented across the US, do the street-level bureaucrats managing the electoral system discriminate by race or ethnicity in interactions with constituents about voting rules? We employ a large-scale, email-based field experiment, similar in design to Butler and Broockman (Reference Butler and Broockman2011) and McClendon (Reference McClendon2012), to explore whether minorities face higher costs than other voters to learning about voting requirements from election officials. In doing so, we conduct the first field experiment of this scale on street-level bureaucrats in the US. We test whether the local officials directly responsible for election administration provide different information about these requirements to Latino versus non-Latino white voters. We randomly assign essentially all county or municipal election officials in 48 US states (over 7,000 officials) to receive emails from fictitious constituents with either putatively Latino or non-Latino white names asking two questions about voting before the 2012 election: a question about voter ID or a control question measuring baseline differences in responsiveness.Footnote 4
Analyzing over 5,300 replies, we find clear, causally identified evidence of bias against Latinos in the responsiveness of local election officials. Emails from Latino names are roughly five percentage points less likely to receive a reply to a question about voter ID requirements than those from non-Latino whites. Replies that Latino emailers do receive are less likely to convey accurate information about ID requirements. There is some evidence that this bias is greater in responses to questions about voter ID compared to a baseline question, but this is not statistically significant across model specifications.
Our results cannot be explained by differences in the resource constraints or professionalization of bureaucrats and there is little support for plausible “statistical discrimination” mechanisms, such as if the bias were driven by the partisanship of local officials. We do, however, find evidence consistent with the claim that those working in institutions with mechanisms in place aimed at preventing discrimination are less discriminatory (Pager and Shepherd Reference Pager and Shepherd2008); despite bias against Latinos nationally across all types of officials, we find no bias in counties and municipalities covered under Sections 5 and 203 of the federal Voting Rights Act.Footnote 5
Overall, our results likely provide a lower bound for the bias real Latinos may face in interactions with these local election officials. Lipsky (Reference Lipsky1980) argues that bias will be highest for actions that are complex and costly to the bureaucrat; replying to the short emails in our experiment is particularly low cost.Footnote 6 Yet these emails stand in for a larger class of interactions between election officials and potential voters—from providing directions to polling places to determining voters’ registration eligibility—that can require more complicated actions and for which bias may be greater.Footnote 7 In addition, real bias can result from officials using a bundle of characteristics to decide who is deserving of their effort; characteristics such as ethnicity, race, class, accent, and literacy can all influence discrimination (Hancock Reference Hancock2007; Hosoda, Nguyen, and Stone-Romero Reference Hosoda, Nguyen and Stone-Romero2012; Purkiss et al. Reference Purkiss, Perrewé, Gillespie, Mayes and Ferris2006). But while these characteristics are correlated within the American population, including for Latinos, our experiment only primes ethnicity.Footnote 8 As a result, we likely provide a conservative estimate for the bias that could be faced by a poor, nonwhite, and/or non-English-speaking Latino voter in comparison to a wealthier, white, and English-speaking non-Latino voter.
We believe our experiment is strengthened by the realism of the design. Survey evidence (see footnote 2) indicates that many voters do not have accurate knowledge about ID requirements. While no existing data specifically measure rates at which voters email local officials about voter ID laws, Americans (including Latinos) are increasingly likely to contact officials like those in this study online.Footnote 9 Most importantly, we directly study the relevant population through real individual interactions, rather than observing bureaucratic behavior in the face of numerous confounders.
Ultimately, this research makes two main contributions. To our knowledge, this is the first large-scale field experiment on bureaucratic behavior in the US offering causal evidence of discrimination on the basis of ethnicity or race. This brings field experimental evidence to bear on long-standing debates about the conditions under which street-level bureaucrats are biased in responsiveness to constituents (e.g., Goodsell Reference Goodsell1983; Jones et al. Reference Jones, Greenberg, Kaufman and Drew1977; Lipsky Reference Lipsky1980; Mladenka Reference Mladenka1981).Footnote 10 Our experiment expands recent observational research on bias in implementation of social and welfare services (Keiser, Mueser, and Choi Reference Keiser, Mueser and Choi2004; Fording, Soss, and Schram Reference Fording, Soss and Schram2007; Davis, Livermore, and Lim Reference Davis, Livermore and Lim2011) to the study of election administration and more directly isolates whether individual-level patterns of bias are best explained by “taste-based,” strategic, or resource-driven factors than existing literature.
Second, our results have clear implications for states with new voter ID laws and for minority voting more generally. While evidence of aggregate turnout effects of these laws is mixed (Alvarez, Bailey, and Katz Reference Alvarez, Bailey and Katz2008; Ansolabehere Reference Ansolabehere2009; Erickson and Minnite Reference Erikson and Minnite2009; Mycoff, Wagner, and Wilson Reference Mycoff, Wagner and Wilson2009), they are often thought to have discriminatory effects because poor and minority voters are less likely to have required ID (Barreto, Nuño, and Sanchez Reference Barreto, Nuño and Sanchez2007, Reference Bertrand and Mullainathan2009) or because poll workers may challenge poor or minority voters to show ID more frequently (Atkeson et al. Reference Atkeson, Bryant, Hall, Saunders and Alvarez2010; Cobb, Greiner, and Quinn Reference Cobb, Greiner and Quinn2012). We instead explore a previously unexamined mechanism—the provision of information before election day—through which these laws may differentially affect voters. Observational evidence indicates that negative turnout effects of voter ID laws are largest when states have recently implemented them, especially among Latino voters and other groups that face steeper “learning curves” about new requirements (Vercellotti and Andersen Reference Vercellotti and Andersen2009). But more broadly, our finding of bias against Latinos even in states without voter ID suggests that minorities may face discrimination throughout their interactions with the electoral system.
This article proceeds as follows. In the next section, we review existing literature on bias by street-level bureaucrats and its implications for the implementation of voter ID laws. In the subsequent section, we introduce the hypotheses and design of our experiment, then present results and examine possible mechanisms. The final section concludes.
EXISTING LITERATURE
The behavior of street-level bureaucrats directly affects the realized forms of public policies (Brodkin Reference Brodkin1997; Lipsky Reference Lipsky1980). Although a policy might be written as universal, resource-constrained bureaucrats frequently have discretion over which services are delivered and to whom; discretionary decisions made by local bureaucrats often become de facto public policy. This behavior may also shape the long-run political context in which bureaucrats operate. Existing literature indicates that interactions with local bureaucracy—such as enrolling children in Head Start or receiving welfare benefits—can create feedbacks and influence rates of political participation (Bruch, Ferree, and Soss Reference Bruch, Ferree and Soss2010; Mettler and Soss Reference Mettler and Soss2004). If interactions with election officials have similar effects, bias could influence the long-term composition of the electorate by affecting who is a voter. Given their critical role, it is important to understand why bureaucrats may treat constituents differently in discretionary interactions.
Existing research has advanced two broad classes of explanations for observed differences in the treatment of constituents. First, some studies argue that decisions by bureaucrats are driven largely by organizational rules, such as the technical-rational criteria in place for responding to complaints, and available resources, such as the manpower available in different jurisdictions (Jones et al. Reference Jones, Greenberg, Kaufman and Drew1977; Mladenka Reference Mladenka1981). This predicts that bureaucrats respond differently to requests because of variation in procedures and resources, not because of individual-level bias against groups of constituents.
A second set of studies argues instead that differences in treatment of constituents do stem from biases. These works focus on how individual characteristics—including ethnicity and partisanship—of the bureaucrat, the citizen, or the interaction of the two affect bureaucratic behavior. This literature proposes a combination of taste-based and more strategic, or political, mechanisms for this bias. Much of this comes from studies of the welfare state. Focusing on administration of the Temporary Assistance for Needy Families (TANF) program, Keiser, Mueser, and Choi (Reference Keiser, Mueser and Choi2004) finds that nonwhite recipients’ benefits are sanctioned by case workers for violating program rules more than white recipients within each jurisdiction. Similarly, Ernst, Nguyen, and Taylor (Reference Ernst, Nguyen and Taylor2013) finds that a white applicant received higher quality information about benefits in an audit of welfare offices, arguing that white applicants may be seen by caseworkers as more deserving of benefits from the state. Fording, Soss, and Schram (Reference Fording, Soss and Schram2007) adds a political dimension, finding that more conservative localities have higher levels of TANF sanctions, and proposes that this is because local bureaucrats share their jurisdiction’s majority political ideology about welfare programs. Davis, Livermore, and Lim (Reference Davis, Livermore and Lim2011) finds that where local TANF program managers have closer ties to black political networks in areas with more black political power, black constituents are more likely to be given discretionary access to vocational training programs.Footnote 11
Existing studies of local election officials indicate that they may be similarly influenced by partisanship or ethnicity. The interaction between the partisanship of these officials and their district is associated with aggregate turnout (Burden et al. Reference Burden, Canon, Lavertu, Mayer and Moynihan2013), the number of provisional ballots cast and counted (Kimball, Kropf, and Battles Reference Kimball, Kropf and Battles2006), and local election officials’ support for provisional ballot policies (Kropf, Kimball, and Vercellotti Reference Kropf, Kimball and Vercellotti2013), all suggestive that partisanship may affect how vigorously election rules are enforced. There is also evidence that citizens of different ethnicities have different experiences on election day, with blacks and Latinos more likely to be asked for ID by poll workers (Ansolabehere Reference Ansolabehere2009; Atkeson et al. Reference Atkeson, Bryant, Hall, Saunders and Alvarez2010; Cobb, Greiner, and Quinn Reference Cobb, Greiner and Quinn2012) and reporting lower quality experiences at the polls (Hall, Monson, and Patterson Reference Hall, Monson and Patterson2009). As with the literature on discretionary bias in the welfare state, however, these studies cannot clearly distinguish whether these patterns emerge from underlying biases of local administrators and poll workers or if they are instead driven by more political and strategic considerations.
Recent changes to voter ID laws provide an important case in which to test theories of bureaucratic behavior. Between the passage of the federal Help America Vote Act (HAVA) in 2002 and 2012, 21 states adopted new ID requirements. As of 2012, 30 states currently ask for some type of ID on election day (National Conference of State Legislatures 2012). These laws fall on a spectrum from requiring a photo ID to those that allow voters to present nonphoto IDs and those which request some form of ID, but allow voters to cast ballots without it under certain conditions.
Even if these new laws are designed to simplify the voting process, they increase complexity in the short term by changing rules that voters and officials had become familiar with. This is especially true when laws are challenged in court and it is unclear whether they will be enforced. In states with new or legally contested voting laws, more voters can be expected to seek new information on requirements, and any underlying ethnic or racial differences in information provision may have a more pronounced effect on voting.
It may seem a priori unlikely that small differences in access to information about ID requirements would influence turnout. Recent scholarship, however, has shown that small changes in the costs of obtaining information about an action can significantly influence voluntary behaviors. For example, simplifying information and providing assistance in completing forms can lead to significantly higher rates of college enrollment among students from low-income families (Bettinger et al. Reference Bettinger, Long, Oreopoulos and Sanbonmatsu2012), more applications to selective colleges from high-achieving students who are eligible for scholarships (Hoxby and Turner Reference Hoxby and Turner2013), and higher uptake of valuable tax credits among eligible tax payers (Bhargava and Manoli Reference Bhargava and Manoli2013; Saez Reference Saez2009). Importantly, these experimental studies show that small information costs deter action even when substantial individual benefits are at stake. Similar information costs may also affect voting, which lacks such obvious benefits. Indeed, existing research has also shown that small changes to voting procedures, such as changing the location of polling places by several city blocks, decrease turnout by increasing information costs to voting (Brady and McNulty Reference Brady and McNulty2011; McNulty, Downing, and Ariotti Reference McNulty, Downing and Ariotti2009).
HYPOTHESES AND RESEARCH DESIGN
We conduct a field experiment measuring whether local election officials in 48 US states respond to email queries from constituents of different ethnicities at different rates or with information of differing quality.
Hypotheses
H1—Bias in responses against Latino emailers: Consistent with literature showing that discretionary bureaucratic behavior is influenced by constituents’ individual characteristics, we hypothesize that election officials respond to emails from putatively Latino constituents at lower rates than to those from putatively non-Latino white constituents. This bias could also manifest in less accurate, informative, and friendly responses.
H2—Greater bias against Latino emailers in emails about voter ID laws: We expect particularly strong bias in responses to questions about voter ID laws compared to other questions. This could be for two reasons. First, the focus on undocumented immigrants in public discourse on voter ID laws may have caused these laws to become “racialized,” priming underlying biases.Footnote 12 Alternatively, bias may be greater for tasks that are more complex for bureaucrats (Lipsky Reference Lipsky1980), with greater differences across ethnic groups in responses to more complicated queries.
H3—Greater bias against Latino names in states with stricter voter ID laws: Finally, we hypothesize that officials in states with stricter voter ID laws display greater bias in responsiveness against Latinos. We expect concerns about voting by noncitizens to be more salient in states with stricter laws. This may be because such concerns caused these states to adopt strict voter ID laws, or because exposure to more debate about ID requirements has made these laws more “racialized” in these states.
Experimental Setup
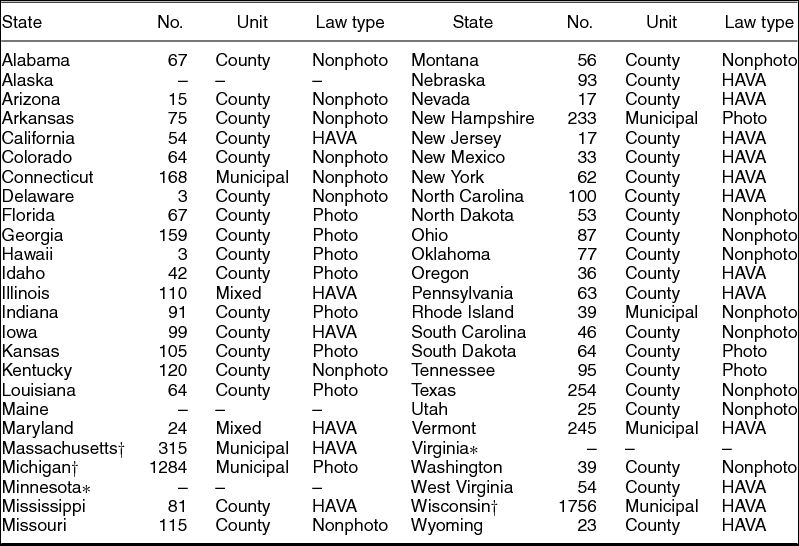
To test these hypotheses, we contacted every local official or election commission for each county or municipality at which elections are administered in 48 states. We sent emails to publicly available addresses through which these officials already field constituent requests.Footnote 13 Results are analyzed from 46 of these states (N = 6825); two states were dropped due to independence assumption violations.Footnote 14 Table 1 lists sample sizes and voter ID law types by state.Footnote 15
Number of Email Addresses Used by State

Notes: Total = 6825. †: 20 units from Massachusetts, Michigan, and Wisconsin were used in a pilot and dropped from the full experiment. *: Minnesota and Virginia were emailed, but not analyzed due to concerns about contamination. Law types are those in effect in September 2012, when our emails were sent, based on definitions from National Conference of State Legislatures (2012). The “photo” category includes any laws that request voters present photo ID; the “nonphoto” category includes any laws that require any identification; the “HAVA” category includes states without regulations beyond those required by federal law.
Each local official or commission received an email on September 4, 2012 with a randomly assigned text and name. The “voter ID email” asked a question about voter ID laws, while the “control email” asked a simpler and less-politicized question about voting in primary versus general elections. Having two questions allows us to distinguish between baseline discrimination and discrimination specific to voter ID. We also varied the sender of the emails among four names, two that are putatively Latino (“José Martinez” and “Luis Rodriguez”) and two that are putatively non-Latino white (“Greg Walsh” and “Jake Mueller”).Footnote 16 To send many emails in a short time window, we registered domain names and created email addresses such as lrodriguez@ajnmail.net. The text of the voter ID email was as follows:
Hello,
I’ve been hearing a lot about voter ID laws on the news. What do I need to do to vote?
Thank you,
(Jose Martinez, Jake Mueller, Luis Rodriguez, or Greg Walsh)
The control email was as follows:
Hello,
I’ve been wondering about this. Do you have to vote in the primary election to be allowed to vote in the general elections?
Thank you,
(Jose Martinez, Jake Mueller, Luis Rodriguez, or Greg Walsh)
In sum, there were eight treatment conditions (4 names × 2 email texts). We analyze the pairs of Latino or non-Latino names together, collapsing the study to four conditions.Footnote 17 These treatments were assigned within each state after pair matching localities, following Imai, King, and Nall (Reference Imai, King and Nall2009). We used coarsened exact matching (Iacus, King, and Porro Reference Iacus, King and Porro2012) to create pairs of counties or municipalities within states that were most similar in terms of population density, income per capita, proportion black, proportion Latino, and Democratic vote share in the 2008 presidential election.Footnote 18 This improves balance on observable covariates prior to randomization. Importantly, by matching on factors that should predict bureaucratic capacity (population density and income per capita), and more generally by randomizing the treatment, we ensure that any ethnic disparities observed in the experiment cannot be driven by differences in bureaucratic procedures or other jurisdiction-level factors.
The ethnicities of the email senders (Latino, non-Latino) and the two email texts were randomized within each pair with equal probabilities, such that one of the units received an email from a Latino name and the other did not.Footnote 19 After matching, balance for both treatments (text and ethnicity of emailer) remained imperfect, because of the small number of observations within some states (see Supporting Information).Footnote 20 For this reason, we control for these covariates in the analysis below rather than looking only at differences in means across treatment conditions.
Coding of Responses
We received over 5300 replies to these emails from at least 4557 local election officials.Footnote 21 Using a dataset of voter ID requirements in each state,Footnote 22 we used double-blind human coding to assess the accuracy of each of the 2549 replies to the voter ID email. Specifically, the names of our fictitious emailers were removed and research assistants were not told the research questions. Research assistants then determined whether each email was “absolutely accurate,” meaning the reply contained full and accurate information about voter ID requirements in the state, or fell into a range of other categories.Footnote 23 Each reply was initially coded by two research assistants; replies for which the two coders disagreed were sent to a third.Footnote 24
In contrast, the control email was designed to examine baseline differences in response rates and had a single, simple answer in all states; no state requires voting in primaries to vote in general elections and this email was answered accurately essentially everywhere. Therefore, we analyze differences between the two email texts in response rate, not in accuracy.
EXPERIMENTAL RESULTS
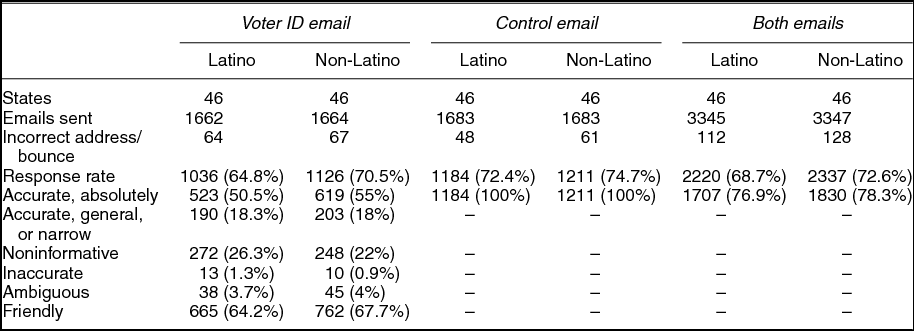
Table 2 contains summary statistics, broken out by treatment condition. Overall, officials responded to about 71% of emails, a higher response rate than in a similar study of elected state legislators (Butler and Broockman Reference Butler and Broockman2011). In addition, officials were more likely to respond to the control email than the voter ID email. This is consistent with the control email being marginally easier to answer; yet despite the low cost, officials responded to fewer than 74% of these emails. Only 46% of emails asking a question about voter ID got some type of accurate response. Furthermore, we find that local officials in states without voter ID laws were more likely to respond accurately to the voter ID email than those in states with additional requirements.Footnote 25 Finally, the summary statistics provide evidence of bias; Latino emailers receive responses at lower rates and are less likely to receive absolutely accurate responses than non-Latino emailers.
Summary Statistics, All States

Notes: “Incorrect address” refers to emails that either immediately were “returned to sender” or to which we received a reply informing us that the email was addressed to an incorrect recipient. Refer to text for other definitions.
Because randomization did not achieve perfect balance, we prefer parametric approaches that control for locality characteristics that may affect response rates.Footnote 26 We use two different modeling approaches. First, we run multi-level models in which coefficients for the effect of the Latino name and the intercept vary by state, while coefficients for the control variables are pooled across all states. This estimates different effects for every state, including those with small sample sizes, but borrows information across states (Gelman and Hill Reference Gelman and Hill2007). We also run a single fully pooled logistic regression model with state fixed effects. This allows intercepts for each state to vary, but estimates a single treatment effect for the entire country, driven more heavily by states with larger sample sizes. We report results from both models for comparison.
Response Rate
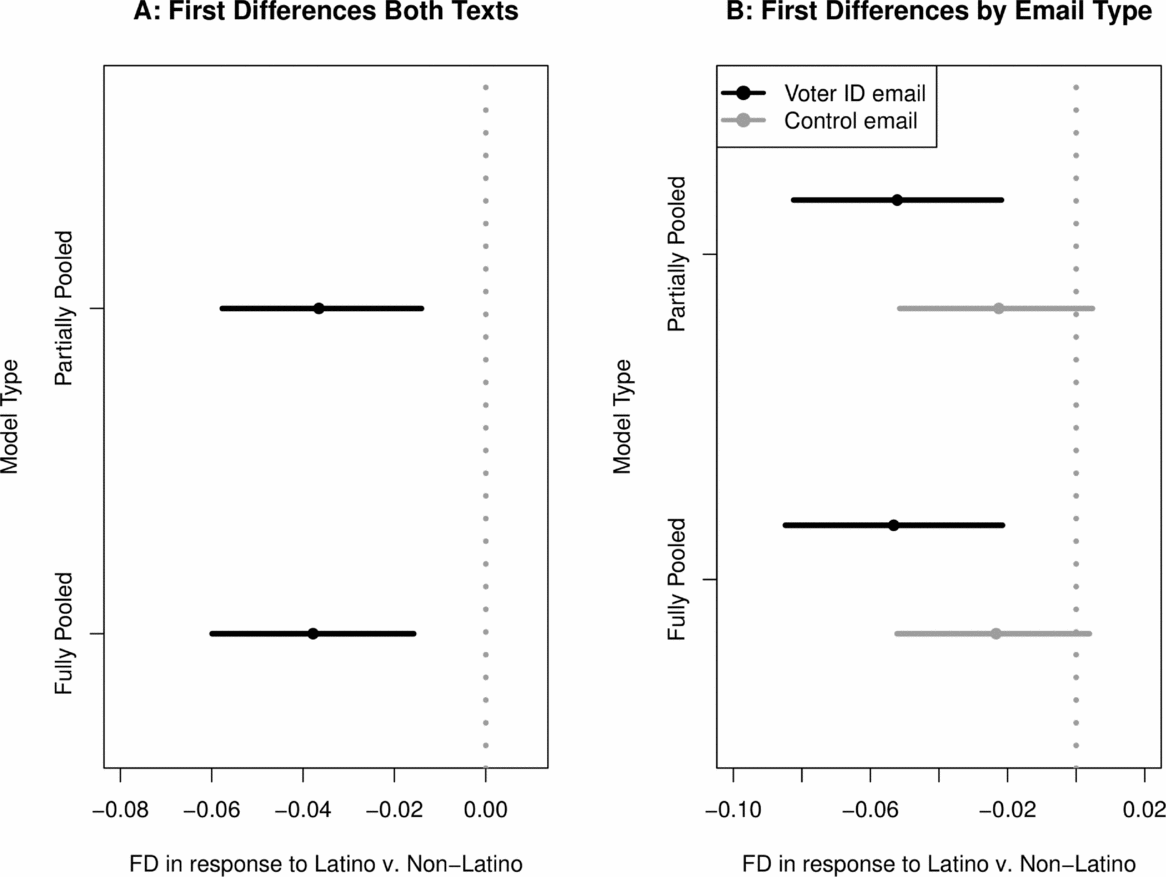
We find strong evidence supporting our first hypothesis that the response rate to Latino names is significantly lower than the response rate to non-Latino names (p < 0.001 in both models). Because logistic coefficients are difficult to interpret, panel (A) of Figure 1 plots the simulated first difference in the predicted probability of a response to a Latino versus non-Latino name for both email texts and 95% confidence intervals around these point estimates.Footnote 27 Responses to Latino names are three-and-a-half to four percentage points less likely than to non-Latino white names in both fully and partially pooled models.
First Differences in Overall Response Rates

We find limited support for our second hypothesis that the gap between response rates to non-Latinos and Latinos is larger for questions about voter ID laws than a general question. Panel (B) of Figure 1 shows the simulated first differences to Latino and non-Latino white names for each email text separately. The estimated bias is 5 percentage points (95% CI: − 0.08, − 0.02) for the voter ID email and 2 percentage points (95% CI: − 0.05, 0.01) for the control email. Bias against Latino emailers in responses to the voter ID email text is thus estimated to be approximately three percentage points larger than in the control email, but the difference between them is not statistically significant (p > 0.17 in both specifications).
We find no evidence supporting our third hypothesis that states with voter ID laws exhibit greater differences in response to Latinos versus non-Latinos.Footnote 28 Testing this final hypothesis involves a nonexperimental comparison of treatment effect sizes across states with different laws that were chosen endogenously. Furthermore, due to small sample sizes by law type (e.g., only 11 states with photo ID laws), we should only find evidence confirming our third hypothesis if the difference between states with different law types is very large. In two additional specifications, we include indicators for each state’s type of law, and interact these with the Latino name variable. We find no interactions between the type of voter ID law and the Latino name variable on response rate (the smallest p value on these interactions is 0.48; see Supporting Information).
Characteristics of Responses
We also investigate whether, conditional on receiving a reply, the nature of responses varies between emails to Latino and non-Latino aliases.Footnote 29 We focus only on responses to the voter ID email because these varied in accuracy.
First, Latino names are less likely to receive absolutely accurate responses (p < 0.05 in both specifications).Footnote 30 A key reason Latino emailers received fewer absolutely accurate responses is that rather than answering their question directly, local officials were more likely to respond to Latino emails “noninformatively,” side-stepping our direct question by, for example, asking whether the emailer wished to vote absentee or requesting that the emailer call the office to discuss the issue (p < 0.05 in both specifications).Footnote 31 Overall, simulations based on partially pooled models estimate Latino emailers to be 4 percentage points (95% CI: − 0.08, − 0.00) less likely to receive absolutely accurate responses and nearly 5 percentage points (95% CI: 0.01, 0.09) more likely to receive a noninformative response compared to non-Latino emailers.
In addition to the content of responses, we examine whether the tone or style of responses to Latino and non-Latino emailers differs. Two-thirds of all responses to the voter ID question were coded as “friendly.”Footnote 32 Latino emailers are estimated to be almost 4 percentage points less likely to receive a friendly response, but this result falls short of statistical significance in both model specifications (p = 0.13). Taken together, these results suggest differential treatment of Latino and non-Latino emailers, even after conditioning on response rate.
The Voting Rights Act: Bias under Monitoring
Within the clear aggregate pattern of bias in responsiveness against Latinos, we also find suggestive evidence that bias from local election officials varies with the degree of monitoring they face.Footnote 33 Research on racial and ethnic discrimination in employment, housing, financial, and consumer markets suggests that private sector employees are less likely to be discriminatory in discretionary decisions about clients when organizational procedures are in place to make them aware of the risk for discrimination and to explicitly monitor against it (Pager and Shepherd, Reference Pager and Shepherd2008, 14–7).Footnote 34 If similar dynamics hold for election officials, biased behavior should be less likely when institutional mechanisms are in place to prevent it.
We test this by analyzing response rates from jurisdictions that are and are not covered by two federal antidiscrimination policies explicitly aimed at preventing local-level discrimination in election administration. Under Section 5 of the federal Voting Rights Act (VRA)—which was in effect during our study—706 localities in our data were subject to “preclearance.” To prevent discrimination, this coverage placed localities under additional federal oversight and prohibited them from changing election procedures without federal approval. Under Section 203 of the VRA, 186 jurisdictions from our study are specifically required by the federal government to make all voting information and ballots accessible to Spanish-language voters because they have large Latino citizen populations, a high proportion of Latino citizens, or many eligible voters who are Spanish-language dominant.Footnote 35
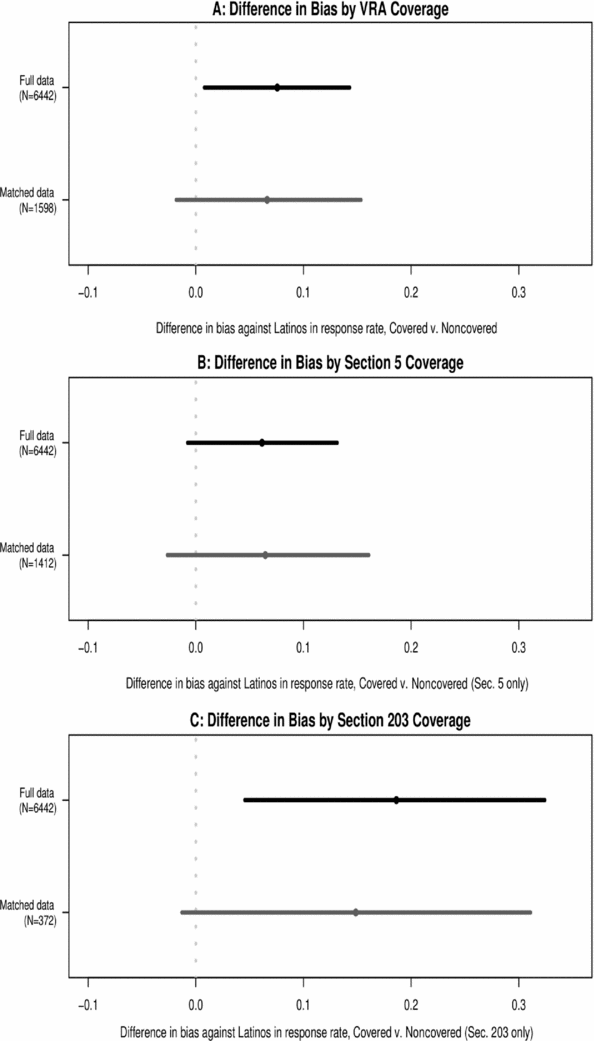
Assignment to increased scrutiny under these provisions is not random and we cannot estimate causal effects of the VRA. Nonetheless, adding indicator variables for whether an observation is covered under either Section 5 or Section 203 to the models for response rate and interacting these indicators from the Latino name treatment shows that bias against Latinos is significantly lower in these subsets. Places covered by the VRA under either Section 5 or Section 203 show no response bias (p = 0.29), while noncovered places show significant bias in response rates (p < 0.001), with an estimated 5 percentage points fewer responses to Latino emailers (95% CI: − 0.07, − 0.02).Footnote 36 Plotting this interaction, panel (A) of Figure 2 shows that bias against Latinos is 7.5 percentage points lower (95% CI: 0.01, 0.14) in covered localities than in noncovered localities. Because areas covered by the VRA likely differ from noncovered places on many other dimensions, we also use nearest-neighbor propensity score matching to prune the set of noncovered localities to those that most resemble covered localities on the covariates listed above. Re-estimating the model on this restricted dataset shows a similar pattern, with 6.7 percentage points (95% CI: − 0.02, 0.15) less discrimination in covered than noncovered jurisdictions, although this is only significant at p = 0.12 with the reduced sample size.
First Differences in Latino Treatment Effect by VRA Status

We also analyzed Section 5 and Section 203 coverage separately because the determinants and nature of coverage for each differ. Panel (B) of Figure 2 shows that re-estimating the models for Section 5 alone returns a similar result, with estimated 6.1 percentage points less discrimination in covered than noncovered jurisdictions (p = 0.08, 95% CI: − 0.01, 0.13).Footnote 37 In the unmatched data, Section 5 jurisdictions do not discriminate against Latinos in responsiveness (p = 0.48), while the uncovered jurisdictions do discriminate (p < 0.0001), with 4.4 percentage points estimated bias against Latinos (95% CI: − 0.07, − 0.02).Footnote 38 We also find significant differences across Section 203 coverage. Panel (C) of Figure 2 plots the interaction between the Latino name treatment and an indicator for Section 203 coverage, showing significantly less discrimination in covered than noncovered localities.Footnote 39 In the unmatched data, officials in the 186 observations covered by Section 203 for Spanish-speaking populations are signed as more likely to respond to the Latino than the non-Latino names, while officials in localities not covered are still 4 percentage points less likely to reply to Latinos than non-Latinos (p = 0.0001, 95% CI: − 0.06, − 0.02).
An additional factor that could produce variation in discrimination across localities is the ethnicity of the officials themselves. Studies of representative bureaucracy argue that the interests of groups will be better represented by a bureaucratic workforce that includes members of those groups (Kingsley Reference Kingsley1944; Krislov Reference Krislov2012; Meier Reference Meier1975). Local officials who are themselves Latino/a may be less biased, and local election officials are more likely to be Latino in localities with larger Latino populations, including those with Section 203 coverage. We are unable to identify the ethnicity of most officials in our dataset. But for those states where ethnicity data are available, it appears that the overwhelming majority of local election officials are non-Latino.Footnote 40 We cannot fully reject the possibility that some of the difference between Section 203 covered places and other jurisdictions is driven by these localities also being more likely to have Latino/a officials.Footnote 41 We can show, however, that the reduction in bias in localities covered by Section 5 in the VRA exists separately from any differences in Latino population because areas covered under Section 5 range widely in local Latino population. Removing all localities that are more than 10% Latino and re-estimating the models for Section 5 coverage shows that these results are the same without including localities with high Latino populations (see Supporting Information). There is thus still evidence that monitoring may change bureaucratic behavior even in places that are unlikely to have Latino bureaucrats.
Potential Mechanisms
The bias we observe in areas without VRA coverage could result from several mechanisms. Although the appearance of bureaucratic bias elsewhere might result from differences in organizational rules or resources (Mladenka Reference Mladenka1981), randomization ensures that these factors do not drive the bias we observe in our experiment. We explore two additional mechanisms. First, local bureaucrats may engage in taste-based discrimination when trying to decide which of many tasks to prioritize. Alternatively, public officials may not respond as often to Latinos because they believe that they are less likely to support these officials politically, to actually live in their districts, or to be citizens. This second set of reasons could be seen as forms of “statistical discrimination,” with bias emerging from potentially rational beliefs about differences between Latino and non-Latino constituents (Altonji and Blank Reference Altonji, Blank, Orley C. and Card1999). While our design does not allow us to causally identify these mechanisms, a series of additional tests suggest that the most plausible statistical discrimination mechanisms are insufficient.
Partisan elected officials may have political incentives to reply at different rates, or with differing accuracy, if ethnicity serves as a cue for partisanship (Butler and Broockman Reference Butler and Broockman2011). For example, if Latino voters are perceived as more likely to be Democrats, Republican officials could reply less to discourage turnout of perceived opponents. Similar incentives would not hold for nonpartisan civil servants, who have no political advantage at stake in these emails. We update data from Kimball and Kropf (Reference Kimball and Kropf2006) to identify the partisanship and appointment method of the local election officials and test several arguments about political incentives.Footnote 42
We find no evidence that political incentives affect bias. Elected and appointed officials respond and are accurate at similar rates. Appointment method does not interact with the Latino name—both types of officials are similarly biased overall.Footnote 43 Similarly, while there is some evidence that partisan officials reply less overall than nonpartisan officials, partisan and nonpartisan officials show no significant difference in bias towards Latinos. We also find no difference in bias between Democratic versus Republican election officials.Footnote 44 Finally, the partisanship of each officials jurisdiction, measured as Obama vote share in 2008, does not interact with the Latino name or with each officials’ partisanship—i.e., Republican officials are not particularly likely to be biased in Democratic jurisdictions, or vice versa.
Beyond political incentives, bias in response rates could result from officials not seeing Latinos as plausible constituents. Because election administration is organized by county or locality in the US and the Latino population is not evenly distributed across the country, most local election administrators serve in jurisdictions with low Latino populations. There are relatively few jurisdictions in the data with large Latino populations; the median observation is only 2.1% Latino. Interacting the Latino name treatment with the Latino population share in each locality returns a statistically significant interaction suggesting that bias against Latinos in responsiveness only becomes significant in areas with few Latinos.Footnote 45 But this does not account for VRA coverage. A disproportionate share of the localities with large Latino populations are covered under Sections 203 or 5 of the VRA.Footnote 46 Removing all localities where the above analysis suggests we should not find significant bias because they are covered by the VRA, there is no evidence of an interaction between the Latino name treatment and the Latino population share of each locality (p = 0.92 on this interaction term; see Supporting Information). Ultimately, because of the prevalence of VRA coverage in localities with high Latino populations, we cannot observe how much discrimination would exist in the most Latino localities in the US if the VRA were not in effect.Footnote 47
A related statistical discrimination mechanism would hold if officials could disproportionately tell that the Latino emailers were not their constituents in comparison to the non-Latino emailers. An extreme example would be if our findings were driven by officials in very small towns or counties who know most their constituents personally and can easily tell that our aliases are fake. We re-estimate the main results, dropping localities in the bottom 10th percentile of total population. This has no substantive effect and all treatment effect estimates remain as before (see Supporting Information).
Another version of this mechanism would occur if local officials were less likely to find our Latino aliases than our non-Latino aliases in official lists of registered voters or locality residents, and then did not reply (or do so accurately) as a result. To test for this, our research assistants coded indicators for the officials being suspicious about our aliases: whether officials asked if the emailer lived in that locality or was registered to vote, as well as if officials indicated that they looked for the emailer in their voter registration file. The Latino names were no more likely to receive such questions about residency or registration than the non-Latino names. Instead, 12% of the officials who replied explicitly stated that they had no evidence that the emailer (of either ethnicity) lived in their locality. Moreover, our non-Latino white surnames, Mueller and Walsh, are actually much less common in the US population than Martinez and RodriguezFootnote 48 and our specific Latino first and last name combinations are also orders of magnitude more prevalent than our non-Latino names.Footnote 49 Though the prevalence of our Latino aliases is not uniform across the US, in the clear majority of localities in our data the non-Latino aliases will not appear in the voter registration file either. Nonetheless, over 70% of officials replied to our non-Latino emailers, making it implausible that finding names in the voter registration file accounts for whether or not officials responded.
CONCLUSIONS
We bring field experimental evidence to debates about the degree to which constituents’ individual characteristics drive bureaucratic behavior and causally identify the effect of constituent ethnicity on the responsiveness of local election officials. This experiment allows us to directly study the public officials tasked with providing election information to citizens and to isolate the effect of ethnicity on their real-world performance. We find strong evidence that election officials were less responsive to questions from putatively Latino constituents. In addition, the responses that Latino emailers received to voter ID questions were less likely to be accurate and were more likely to be noninformative.
While we cannot causally identify mechanisms, our results suggests that bias from street-level bureaucrats can occur even when there are not clear strategic reasons for officials to discriminate on the basis of ethnicity. Randomization ensures that observed bias cannot be explained by differences in organizational capacity (e.g., Jones et al. Reference Jones, Greenberg, Kaufman and Drew1977) and we find no evidence that whether local officials are elected or appointed, partisan or nonpartisan, or members of specific political parties influences the extent of bias. This differs from earlier observational work on partisan patterns in the behavior of election officials in other aspects of election administration (Burden et al. Reference Burden, Canon, Lavertu, Mayer and Moynihan2013; Kimball, Kropf, and Battles Reference Kimball, Kropf and Battles2006; Kropf, Kimball, and Vercellotti Reference Kropf, Kimball and Vercellotti2013) as well as observational evidence of partisan bias by other types of street-level bureaucrats (Fording, Soss, and Schram Reference Fording, Soss and Schram2007). But consistent with the claim that enhanced monitoring reduces discrimination, we find no evidence of bias against Latinos in jurisdictions subject to federal regulation under the VRA.
These findings have important implications for debates about voter ID laws, and indeed for any changes to voting requirements or election administration. Our results indicate that changes to existing voting regulations are likely to differentially increase information costs for Latino voters because public officials are less responsive to their requests for information. That we find some evidence that officials respond at lower rates to Latinos even when asked a question requiring a single word answer (“No”) suggests that public officials can be biased even in exceptionally low-cost interactions. If minority voters are less able to acquire information about ID requirements and more likely to be asked for ID at the polls (Ansolabehere Reference Ansolabehere2009), this could manifest in lower voting rates. This may be greatest where officials are not monitored to prevent discrimination. The recent Supreme Court decision (Shelby County v. Holder (2013)) striking down portions of the VRA makes it all the more imperative that future reforms to electoral rules include serious efforts to disseminate information to all voters to offset potential bias at an individual level.
More broadly, our experiment confirms that bias by street-level bureaucrats based on citizens’ ethnicity is not always driven by partisan incentives, other plausible forms of “statistical discrimination,” or organizational characteristics. In addition to elections, street-level bureaucrats have discretionary control over the provision of many goods and services controlled by local governments in the US—from trash collection and snow plowing to the management of welfare offices. Similar ethnic or racial biases may affect the quality of services delivered in these other arenas. Future research can expand the use of experimental methods to examine the presence of bias in service delivery in many other aspects of local administration in the US.



Comments
No Comments have been published for this article.