


Introduction
In their role as some of the most significant pollinators of angiosperms, bees provide a key ecological service of which the yearly value is estimated at several billion US$ for regions like the USA or Europe (Buchmann & Nabhan, Reference Buchmann and Nabhan1996; Costanza et al., Reference Costanza, d'Arge, deGroot, Farber, Grasso, Hannon, Limburg, Naeem, O'Neill, Paruelo, Raskin, Sutton and van den Belt1997; Pimentel et al., Reference Pimentel, Wilson, McCullum, Huang, Dwen, Flack, Tran, Saltman and Cliff1997; CBD, 2001; Buchmann & Ascher, Reference Buchmann and Ascher2005; Losey & Vaughan, Reference Losey and Vaughan2006). This link between bees and flowering plants is so indispensable in their life history that the currently observed decline of pollinators (including bees) constitutes a worldwide threat for plant fertilization and fructification, as well as for structure of plant communities (Williams, Reference Williams1985; Rasmont & Mersch, Reference Rasmont and Mersch1988; Rasmont et al., Reference Rasmont, Leclercq, Jacob-Remacle, Pauly, Gaspar and Bruneau1993; Cane & Tepedino, Reference Cane and Tepedino2001; Kevan & Phillips, Reference Kevan and Phillips2001; Ashman et al., Reference Ashman, Knight, Steets, Amarasekare and Burd2004; Biesmeijer et al., Reference Biesmeijer, Roberts, Reemer, Ohlemüller, Edwards, Peeters, Schaffers, Potts, Kleukers, Thomas, Settele and Kunin2006).
To date, our knowledge of broad-scale bee biogeography remains largely sketchy and is based on a handful of studies outlining the main trends of bee distribution at the continental scale (Michener, Reference Michener1979; Roubik, Reference Roubik1989; Radchenko & Pesenko, Reference Radchenko and Pesenko1994; Williams, Reference Williams1998; Kuhlmann, Reference Kuhlmann, Huber, Sinclair and Lampe2005; Patiny & Michez, Reference Patiny and Michez2007). According to current knowledge: (i) bees are considered more diverse in warm temperate xeric ecosystems (Michener, Reference Michener1979); and (ii) within these xeric ecosystems, high levels of bee SR (species richness) are driven by water availability (Patiny & Michez, Reference Patiny and Michez2007). However, these ecological trends are still not quantified and are probably not the only ones governing bee SR distribution. Studies like those undertaken for birds, mammals or plants, that seek macro-ecological factors contributing to species richness (Ceballos & Brown, Reference Ceballos and Brown1995; Hawkins et al., Reference Hawkins, Field, Cornell, Currie, Guégan, Kaufman, Kerr, Mittelbach, Oberdorff, O'Brien, Porter and Turner2003; Bini et al., Reference Bini, Felizola Diniz-Filho and Hawkins2004), are basically lacking for bees. This weakness in knowledge of the macro-ecological trends governing bee biogeography constitutes a major issue in the development of relevant conservation strategies for these organisms.
Apiformes (i.e. bees) include >20,000 species forming a monophyletic group sister to the apoid wasps (a.k.a. spheciform wasps) (Michener, Reference Michener1944, Reference Michener2007; Alexander, Reference Alexander1992; Danforth et al., Reference Danforth, Sipes, Fang and Brady2006). They share morphological and behavioural adaptations for foraging on pollen and nectar, resources upon which they rely exclusively for feeding (Michener, Reference Michener2007). In terms of distribution, bees are occasionally able to fly long distances; but it has been shown that, on average, individual dispersal abilities do not exceed some 100 m around the nesting area (Gathmann & Tscharntke, Reference Gathmann and Tscharntke2002; Greenleaf et al., Reference Greenleaf, Williams, Winfree and Kremen2007). In the broad scale, bees can be considered as sedentary species with local dispersal abilities, with diversity linked to varied ecological parameters (e.g. the presence of forage plants).
Based on an original dataset for taxa belonging to the eight families present in the Eastern Hemisphere, we studied: (i) the distribution of species and SR in Saharan Africa (previous studies suggested the existence of distributional patterns for the studied species in northern Sahara; one subsequent hypothesis is that not only species but also SR is patterned in Saharan Africa); (ii) the potential status of hotspots of specific parts of the framework; and (iii) the relationships between subregional SR and potential ecological drivers.
Material and methods
Geographical framework
The geographical context used for the present study encompasses the northern part of Africa (north of 10°N latitude) and the remote islands, namely Cape Verde and Canary Islands (fig. 1a).
(a) Geographical framework mapping with Gall projection (S., Senegal; B.F., Burkina Faso; mountains are italicised and underlined; river valleys and inland waters are simply italicised). (b) Mapping of species richness onto 1° square grid. The map background gives the main ecosystem limits. (c) Mapping of the hotspot analysis values onto vegetation type. (d) Distribution of number of species (Nspp.), number of data (Ndata) and ratio (10×) of these values against longitudinal positions: (i) in Maghreb (Morocco, Algeria, Tunisia) (12°W–11°E); (ii) in Lybian area (11°E–34°E); (iii) in western Africa (Senegal, Mali, Burkina-Faso, Niger) (17°W–13°E); and (iv) in Sahelian part of Chad and Sudan (13°W–34°E).

This area includes the entire Sahara and its two Mediterranean (northern) and Sahelo-Sudanian (southern) belts (Adams & Faure, Reference Adams and Faure1997; NGS, 2001; Olago, Reference Olago2001). Due to this particular ecological configuration (with central desert surrounded by moister areas), it can be considered as a first approximation that the energy and water gradients, commonly considered as influencing SR, are following subparallel inward or outward axes. That rather simple configuration is only sub-regionally modified by the ranges of mountains, river valleys and inland waters, which locally alter the distribution of particular ecological gradients (White, Reference White1986; Olago, Reference Olago2001).
Origin of the data
An extensive survey of potential sources of biogeographical data for bees was undertaken prior to the present study. The dataset was constructed from those latter, compiling the main sources of georeferenced data for the target-species (table 1).
Description of the analysed dataset and references to sources of data. A datum is defined as a unique database entry for one or several specimens of a given species recorded in similar field conditions.

The final dataset included 249 species belonging to all higher lineages of bees occurring in the study region (fig. 1b, table 1). Parasitic species were excluded because their distribution is potentially constrained by other factors (i.e. host distribution) rather than those influencing non-parasitic species.
The data analysed for the present study have been made available in BDFGM (Banque de données fauniques de Gembloux et Mons). The program DFF 2.0 (Barbier et al., Reference Barbier, Rasmont, Dufrêne and Sibert2005) was used to handle these data on a MS-Access platform.
FAO agroclimatological data were databased in a MS-Access format and used as descriptors of the studied ranges (FAO, 1988). The mapping and designation of ecosystem ranges in northern Africa were taken from NGS (2001).
Spatial analysis
Species distribution datafiles, species richness (SR) values and ArcGIS shapefiles, were produced using DFF 2.0.
ArcGIS 9.0 was used for the mapping of SR onto the ecosystem ranges background. The same program was used to compute the data clustering indices (based on average nearest neighbour, Getis-Ord general G and Morans I) (table 2) and for the hotspot analysis based on local Morans I and Getis-Ord Gi*. The significance level refers to the spatial clustering of data. When relevant (computation of hotspot values), the spatial relationships were conceptualised as the inverse distance squared, while the use of Manhattan distance was generalized (when tested, weak differences were found between results using Manhattan and Euclidean distances).
Values of average nearest neighbour, General G and Morans I.
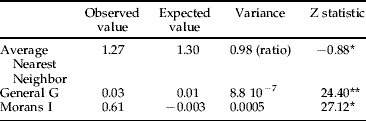
* , clustered; **, high clusters.
The range of SR was studied in two ways. We first used EstimateS 8.0 (Colwell, Reference Colwell2006) to compute Mao-Tau and Coleman statistics (Coleman et al., Reference Coleman, Mares, Willig and Hsieh1982; Gotelli & Colwell, Reference Gotelli and Colwell2001; Colwell et al., Reference Colwell, Mao and Chang2004). Computations were realized for the entire dataset and several subsets. We also followed SR as a one-factor distribution along four west-east transects defined in Maghreb, western Africa, Libya-Egypt and Chad-Sudan (fig. 1d). These four subsets are described based on charts of number of species (Nspp.), amount of data (Ndata) and ratio of these values (Ndata/Nspp.) against longitudinal coordinates (latitudinal variation was not considered).
Statistical analysis
Partial least squares (PLS) analysis, implemented in Minitab 14, was used to quantify the relationships between SR and latitude; distance to nearest shores (D_shore); average minimum temperature (T_min); average maximum temperature (T_max); total radiation (Tot_rad); annual precipitation (Precip); potential evapotranspiration (PET); number of wet days (wet_days); number of growing seasons (N_season); and length of the plant's growing season (L_season) (table 3: values according to FAO, 1988). PLS is probably the least restrictive extension of the multiple linear regression model. In addition, the method presents the advantage of reducing the information from possibly correlated variables in estimating an independent variable, while retaining most of the initial information. To test the weight of the dataset constitution on the results, the same analysis was undertaken considering successively the whole dataset, a subset including only the squares with SR strictly higher than median and another centred on Maghreb (spatially defined as that part of the continent extending north of 27°N and west of 11°E). Using the same procedures, we also tested a second dataset based on relaxed rules, associating SR and ecological variables based on rounded up values ±1°. The trends in the computed components are compared based on the loadings on the first three components (C1, C2, C3), the X variance and R2 values (table 3).
Relationships between SR and the ten ecological variables quantified using PLS analysis. Columns give the X loadings of the ten ecological variables and Y loadings of SR on the PLS three first components (C1–3). The last two lines of the table report the explained portion of the descriptors' variance (X variance) and the values of R², respectively. The last column gives the correlation coefficients between geographical-ecological variables and SR. D_shore, distance to nearest shores; T_min, average minimum temperature; T_max, average maximum temperature; Tot_rad, total radiation; Precip, annual precipitations; PET, potential evapotranspiration; wet_days, number of wet_days; N_season, number of growing seasons; L_season, length of the plants growing season.

Results
Description of the dataset
The sample-based rarefaction curves highlight the good representation of the regional SR by the compiled dataset. The statistics returned by EstimateS show that, considering the whole dataset, 91.9% (based on Mao-Tau), 81.5% (based on Coleman rarefaction index), of the samples include 95% of the studied species. The same statistics computed for the Sahelian area (obviously the less sampled part of the framework) are 86.5% and 68.5%. When considering the Maghreb subset (very densely sampled), the same estimators reach 75% and 64.2%. Independent of the considered area, more than 75% (60% considering Mao-Tau for the whole dataset) of the SR is observed when considering 50% of the samples.
The average number of data per species (as well as the related median) can be used as another estimator of the sampling intensity (fig. 2). Both sets of estimators highlight the same trends. Four groups in the dataset (Andrenidae, Apidae, Halictidae and Melittidae s.l.) display a ratio (Ndata/Nspecies) close to 30 data per species (table 1, fig. 2). The same ratio computed for the whole area (independently of the taxonomic dimension) is above 26. In the least diverse areas, western Africa (conceptualised as Mali, Senegal and Burkina-Faso) and Egypt, the ratio is still up to eight, outlining that, even in the poorest areas, species have been repeatedly sampled.
Main biogeographical trends of the species included in the dataset. Taxa are designated as Ethiopian or Palaearctic when they occur mainly in these regions. Endemic species are absolutely restricted in extent to the sole study territory ( , studied species; □, data per species).

Despite the proven sampling intensity, we need to point out caveats related to the computations (e.g. of hotspots) based on records collected in very different conditions (recorders, time-spans, sampling techniques, etc.). The risk of a better sampling in the most accessible areas is obvious and could make certain hotspots artefacts. There is actually no method to prevent such potential biases. However, considering the smoothing effect of both, the work scale and the hotspot methods, we regard our study as outlining well the main trends of the bee SR distribution in the considered area.
The species constituting the dataset share a few main geographical origins. Most of the included taxa are endemic to Saharan Africa. The non-endemic part of the regional fauna consists of: (i) subsaharan species (20%), occurring most often in local populations in the southern Sahelian belt of the Sahara (Pauly, Reference Pauly1990; Pesenko & Pauly, Reference Pesenko and Pauly2005; Patiny & Michez, Reference Patiny and Michez2007); and (ii) Palaearctic – West-Palaearctic species (29%), extending mainly to the northern Mediterranean part of the territory.
Patterns of bee SR in Saharan Africa
Our maps (fig. 1b, c) highlight a geographic clustering of the high SR values in three main areas: (i) Maghreb (northern Algeria, Morocco, Tunisia); (ii) western Africa (Mauritania and Senegal Atlantic coast, Niger and Voltas valleys, western Niger); and (iii) the Nile Valley (fig. 1b, c). In central Sahara, mountains (e.g. Hoggar (Algeria) and Aïr (Niger)) and shores of variably-sized lakes (Lake Chad and smaller ones in western Niger) also display notably higher SR. On the contrary, SR is obviously lower and data scarcer in low-altitude central Sahara (e.g. in areas of erg Chech and El Djouf), in southern Libya, northern Niger, as well as in Chad and Sudan. The general pattern of SR distribution matches with the above description of the study framework. The central desert is surrounded by high SR areas constituting hotspots. This is only modified by local gradients as formed by the Saharan mountains.
A negative gradient of SR is observed between western and eastern Maghreb. The extreme parts of that gradient are separated from each other by a strong median lowering of SR (around 2°E, topologically related to the depression between Saharan and Aures Atlases) (fig. 1d). Along a gradient defined across western Africa, species richness peaks locally at the Atlantic coasts, Niger-Voltas valleys and the Tahoua-Agadez region (fig. 1c, d).
Trends in species richness distribution
The hotspot analysis (fig. 1c) details and pictures the above trends (fig. 1b, table 2). The highest SR and hotspot values occur in those ecosystems at the desert periphery (fig. 1b, c; Appendix). In the northern part of the study area, high SR is observed in: (i) Mediterranean ecosystems; (ii) along the Atlantic coast (Souss Valley: Acacia-Argania dry woodlands); and (iii) along the Atlas mountains (fig. 1b, c). Most of these ecosystems display SR values higher than the general mean (Appendix).
In western Africa, Sudanian and Guinean savannas display SR values higher than the median (Appendix). Easterly, higher SR values were recorded along the Nile valley and the Red Sea coast (in Nile savanna and coastal desert formations) (fig. 1b–d).
Finally, despite the global scarcity of data from the central Sahara, notably higher values of SR were recorded in the Saharan mountains: Adrar of Iforas (Mali) and Hoggar (Algeria) (Hoggar montane woodlands display SR values higher than the median). Likewise, it is worth noting that isolated populations are located in Aïr (Niger) and in the direct vicinity of varied Saharan inland waters, Agadez-Tahoua area (Niger), Lake Chad, Fitri Lake (Chad), while the surrounding squares are empty of records (fig. 1b–d).
Multivariate model of the bee distribution
The correlations between SR and values of ten ecological variables highlight a positive relationship between SR and latitude (0.53). That trend in bee SR matches with the commonly observed (and pinpointed here above) higher diversity of bees in Mediterranean-like ecosystems.
Among the other ecological variables considered, positive correlations were found with the number of wet_days and length of the plant's growing season (i.e. water and water-related variables) (table 3). In contrast, negative correlations were found with D_shores, T_min, T_max, Tot_rad, and PET (i.e. energy and continental variables). SR was only weakly correlated with annual precipitation and the number of plant growing seasons (table 3). The analysis of a larger dataset, based on relaxed rules, yielded similar values.
The globally high values of X variance (>0.75) in PLS show that the first three components recovered most of the variation of the considered predictors (table 3). Very little resolution was gained when more components were considered. In contrast, the low R2 (between 0.26 and 0.40 regarding the characteristics of the analysed subset) indicated that the model only partially explained the SR variation (one-third for the entire dataset, 40% for the Maghreb data). Similar values were found when additional predictors (e.g. altitude) were considered or a relaxed dataset analysed.
The first component (C1) mainly represents a combination of the energy variables (temperatures, radiation, PET) plus D_shores with negative loadings and latitude plus water variables (wet_days, N_season, L_season) with positive loadings. This composition is similar independent of the analysed subsets and the variables considered. In analysis of the Maghreb subset (columns 8–10 in table 3), an increased importance of precipitation and water variables was observed, whereas loading for latitude was somewhat lower (amplitude of latitude was methodologically minimized in this subset).
The second component (C2) consists mainly of a combination of latitude (positive loading) and water variables (negative loadings). In the reduced subset, D_shores displayed high positive loading and T_min low negative. The positive loadings of D_shores could be considered an artefact owing to the intrinsic characteristics of the reduced subset (i.e. including the localities with highest SR only). When altitude is added to the studied predictors, it displays loading close to those for precipitation. Analysis of the Maghreb subset leads to a somewhat different composition of C2, on which all loadings are positive, except T_min and N_season (low positive). Reducing the dataset on a geographical basis diminishes the importance of factors impacting at larger scale and provides a better picture of the role locally played by secondary descriptors. It is worth noting the high Y loading on C2 in analysis of the subset reduced to Maghreb.
The composition of C3 was more variable according to the considered subset. T_min, Precip, wet_days, and L_season had high positive loadings on C3 for the two first subsets, while Tot_rad has low negative loading. In analysis of the third subset, loadings were globally negative except for T_min and N_season. Water variables (Precip, wet_days, L_season) had particularly high positive loadings, on C3 analysing the two first subsets, but low negative for the Maghreb data.
Discussion
Drivers of the distribution of bees
The SR pattern suggested in former studies (e.g. Michener, Reference Michener1979; Patiny & Michez, Reference Patiny and Michez2007) is generally supported by the above results. These unambiguously indicate that, in Saharan Africa, the highest SR records for bees are clustered and form subregional hotspots centred on particular kinds of ecosystems. The extent of these bee-rich areas is similar to those characterized for various other kinds of organisms (e.g. de Lattin, Reference De Lattin1967; Quézel, Reference Quézel1978; Médail & Quézel, Reference Médail and Quézel1997, Reference Médail and Quézel1999; Bayless, Reference Bayless2002; Amer & Kumazawa, Reference Amer and Kumazawa2005; Greenbaum et al., Reference Greenbaum, Andrew and Raxworthy2006).
The hotspots identified for bees typically extend to the interfaces between the most arid ecosystems (central in the case of the present study area) and the peripheral areas with higher water availability (e.g. the northern Mediterranean ecosystems and the southern Saharan savannas). In the driest parts studied, populations were only recorded clustered in the vicinity of geographical features known to be sources of local ecological gradients (i.e. mountains, river valleys and inland waters). The characterised SR range matches with patterns described at the species level (e.g. Patiny & Michez, Reference Patiny and Michez2007) and further underlines the role played by water in shaping bee distributions.
Furthermore, this obvious spatial adjustment of bee SR distribution suggests the existence of an ecological optimum conditioning bee distribution. That prevents a simple characterization of bee distribution because both aridity and water availability are influenced by an array of macro- and micro-ecological factors. The ranges of the defined hotspots seem consequently driven by a combination of several environmental variables.
The PLS loadings presented in table 3 shed light on the role played by ten ecological variables in the spatial structure of bee SR. Latitude has the strongest loading on the analysis components, independent of the considered data subset. The relationship between latitude and SR has been abundantly documented for many taxa since Humboldt (Reference Humboldt (von)1808) (e.g. Andrews & O'Brien, Reference Andrews and O'Brien2000; Gaston, Reference Gaston2000; Bini et al., Reference Bini, Felizola Diniz-Filho and Hawkins2004). In many cases, SR follows a N-S gradient. In the study territory, latitude and bee SR are positively correlated, providing an additional support to the definition of bees as ‘Mediterranean taxa’. A further comment is necessary on that latter point. It is obvious that the relation between SR and latitude is influenced by the definition of the study framework. Our current knowledge of global bee distribution suggests that positive N-S gradients exist for bees in certain areas (Europe, e.g. see Michener, Reference Michener1979, Reference Michener2007). However, the same sources and others also suggest that the highest SR for bees are linked to xeric (subtropical) ecosystem ranges (Michener, Reference Michener1979, Reference Michener2007; Roubik, Reference Roubik1989; Radchenko & Pesenko, Reference Radchenko and Pesenko1994). The observed positive correlation results from these combined trends.
The energy variables (temperatures, Tot_rad, PET) also have strong loadings (negative), notably on C1 and low (negative) correlation coefficients. In the studied region, high energy level is linked to extreme aridity, which is, directly or not (e.g. through an influence on availability of floral resources), likely to be unfavourable for bees. In line with the previous conclusions, within a subtropical xeric territory, such as that studied here, bees seem consequently driven by optimal (rather than maximal) values of the ecosystem's energy.
The water variables included in the PLS model display weaker C1 loadings and correlation coefficients. They consequently seem to play a secondary role in the spatial structure of SR. However, it is worth noting that the strongest correlation for those variables is found between SR and wet_days or L_season, which are here our best indices of water availability. The role played by these parameters tends to increase our confidence in former hypotheses of a link between SR and water availability (e.g. Patiny & Michez, Reference Patiny and Michez2007). Water occurs in many forms in ecosystems. Some of them (e.g. heavy rains, floodings) are likely damaging for bees (Danforth, Reference Danforth1999; Fellendorf et al., Reference Fellendorf, Mohra and Paxton2004; but see Norden et al., Reference Norden, Krombein, Deyrup and Edirisinghe2003). On the contrary, water availability is a limiting factor for plants, on which bees naturally rely for food. We can, therefore, assume that an optimum of moisture exists, conditioning bee SR. This is well illustrated by the opposed trends in composition of C1 and C2. In the same way, in analysis of Maghreb data, all variables display positive loadings, which provides additional support to the hypothesis of an optimum driving bee distributions. In Maghreb, globally closer to the bee optimum, the loadings of the studied parameters display a completely different distribution. We can hypothesize that in more extreme environments some variables (e.g. linked to aridity) are hiding that part of the analysis signal.
Searching for the biogeographical meaning of the components, C1 can be defined as representing the main trends of the bee distribution ruled by both latitude (+water) and energy. C2 and C3 loadings highlight secondary trends of bee distributions more strongly influenced by the characteristics of the data subsets, the chosen geographical framework and its intrinsic geophysical features (see material and methods chapter). Such distribution of the components significance was previously characterized in other studies (Bini et al., Reference Bini, Felizola Diniz-Filho and Hawkins2004). The compositions of C1 and C2 match well with earlier conclusions defining bees as xerophilous species driven in ecosystems by water availability (Michener, Reference Michener1979, Reference Michener2007; Patiny & Michez, Reference Patiny and Michez2007).
According to the computed X variance and R2 in PLS analysis, the model recovers only one part of the response variation, despite the relative completeness of the dataset. This limitation of the model's performance can be related to a scaling factor. Datasets for insects likely have to be more data rich than for larger animals. At the insect scale, micro-environmental changes can be assumed to have major influences (Bini et al., Reference Bini, Felizola Diniz-Filho and Hawkins2004). The availability of a more accurate association between entomological data and ecological variables would likely lead to an increased efficiency of the model. However, based on our parallel analyses of three subsets with strongly different coverages of the study area (table 3), we also can presume that the accuracy gain would probably not radically modify the results. Thus, ways of improving the model used herein include the addition of further variables, local elevation (responsible, par excellence, for local gradients) and host-plant distributions (e.g. SR of annually flowering plants). It is well known that many solitary bees (including most of the species studied herein) are oligolectic, feeding on a few host-plant species (Sipes & Tepedino, Reference Sipes and Tepedino2005; Almeida, Reference Almeida2007; Michez et al., Reference Michez, Patiny, Rasmont, Timmermann and Vereecken2008). Combining information on the distribution of pollinators and floral resources would be particularly informative.
Evolutionary significance
Considering bees as optimally distributed species is key to understanding the evolution of distributions in a recent past. Under the contemporary dry ecological conditions (Adams & Faure, Reference Adams and Faure1997; Marchant & Hooghiemstra, Reference Marchant and Hooghiemstra2004), an absence of population exchanges between disjointed populations in Saharan Africa can be hypothesised. The transects considered above, of which extreme parts are separated by severe SR drops, give a good picture of that source of isolation (fig. 1d). This hypothesis finds support from an array of features in the considered ranges, notably the match between SR depletions, species disjunctions, local ecosystems energy increase, water availability decrease and extent of several physical barriers (e.g. winds in the case of the depression between Nile valley and Lake Chad: Koren et al., Reference Koren, Kaufman, Washington, Todd, Rudich, Vanderlei and Rosenfeld2006). The observed disjunctions are usually thousands of times larger than the estimated dispersal abilities of bees (Gathmann & Tscharntke, Reference Gathmann and Tscharntke2002; Kinzig et al., Reference Kinzig, Ryan, Etienne, Allison, Elmqvist and Walker2006; Greenleaf et al., Reference Greenleaf, Williams, Winfree and Kremen2007).
One subsequent question is: how did species overcome gaps of hundreds of kilometres in strongly unconnected ecosystems, while ecosystem connectivity in more favourable environments is simultaneously problematic for bees (Holzschuh, Reference Holzschuh2006; Olschewski et al., Reference Olschewski, Tscharntke, Benítez, Schwarze and Klein2006) and while dispersal abilities are usually under one kilometre for most bees (Gathmann & Tscharntke, Reference Gathmann and Tscharntke2002; Kinzig et al., Reference Kinzig, Ryan, Etienne, Allison, Elmqvist and Walker2006)? Regarding the unfavourable character of the contemporary ecological conditions (as indicated by SR drop) and the dispersal capabilities of bees, historical changes in ecological factors most likely explain the formation of these remote populations.
In their more recent history, SR-depleted areas have undergone ecological conditions quite closer to the previously defined optimum driving bee SR (known as the Sahara greening phase). The current dry phase started ca. only 5000 years ago (Adams & Faure, Reference Adams and Faure1997; Leblanc et al., Reference Leblanc, Leduc, Stagnitti, Oevelen, Jones, Mofor, Razack and Favreau2006a,Reference Leblanc, Favreau, Maley, Nazoumou, Leduc, Stagnitti, Oevelen, Delclaux and Lemoalleb). It is likely that the formation of the remote populations of varied species observed across the Sahara occurred during the interval between the end of the last glaciation (~12,000 yrs BP) and the beginning of the current dry phase.
Acknowledgements
The authors are indebted to Dr Y. Brostaux (FuSaGx, Belgium) and G. Carré (INRA, France) for their kindness in proof reading the statistics employed. Prof. M.S. Engel (KU, USA), M.A. Knowles (Ipswich, UK), G. Broad (London, UK) and Dr Y. Mandelik (TAU, Israel) kindly proof read the MS of the present paper. S. Patiny is a FNRS postdoctoral researcher. The present work was developed thanks to support of FNRS, OECD and the Synthesis Program (EU).
Average SR distribution in ecosystems ranging across the geographical framework. White bars represent the number of squares sampled in each ecosystem. Left arrow indicates the position of the median; right arrow the mean; oblique bar underlines the Mediterranean ecosystems (▪, average SR; □, N squares).



