Implications
This cost-effectiveness (CE) analysis suggests measures that could reduce greenhouse gas (GHG) emissions intensity (Ei) from varying baselines of a selection of Senegalese cattle systems, while improving the productivity and profitability of systems. The implementation of policies could encourage adoption of these measures, which would provide both private and social benefits.
Introduction
Developing countries are experiencing an increase in total demand for livestock commodities, as populations and per capita demands increase. The increased production, required to meet this demand and maintain food security, will lead to proportionate increases in GHG emissions; unless they are offset by reductions in the Ei of livestock production (Gerber et al., Reference Gerber, Steinfeld, Henderson, Mottet, Opio, Dijkman, Falcucci and Tempio2013). Emissions intensity is a measure of the quantity of GHG emitted per unit of output, for example kg of carbon dioxide equivalent (kgCO2eq) per kg of milk. Meat and milk produced by cattle in developing countries often have a higher Ei than the same commodities produced in developed countries. A recent study suggested the regional average Ei of milk from sub-Saharan Africa (SSA) is around 9 kgCO2eq/kg milk, compared with 2 kgCO2eq/kg milk in North America and Western Europe (Opio et al., Reference Opio, Gerber, Mottet, Falcucci, Tempio, MacLeod, Vellinga, Henderson and Steinfeld2013). High Ei often reflects low levels of herd productivity, for instance low milk yields, slow growth rates and high mortalities. It is therefore suggested it should be possible to reduce Ei, and increase food availability, by improving herd productivity (Gerber et al., Reference Gerber, Steinfeld, Henderson, Mottet, Opio, Dijkman, Falcucci and Tempio2013).
Previous studies investigating the GHG Ei of SSA cattle systems are frequently based on Intergovernmental Panel on Climate Change (IPCC) GHG inventory guidelines (Dong et al., Reference Dong, Mangino, McAllister, Hatfield, Johnson, Lassey, Aparecida de Lima and Romanovskaya2006). However, such Ei estimations vary considerably; for example Opio et al. (Reference Opio, Gerber, Mottet, Falcucci, Tempio, MacLeod, Vellinga, Henderson and Steinfeld2013) estimate Ei for SSA milk at around 270 kgCO2eq/kg protein, whereas Weiler et al. (Reference Weiler, Udo, Viets, Crane and De Boer2014) and Udo et al. (Reference Udo, Weiler, Modupeore, Viets and Oosting2016) estimate for Kenyan milk 50 to 60 kgCO2eq/kg protein (Ei converted from kgCO2eq/kg milk to kgCO2eq/kg protein assuming protein content of milk is 3.3%). It is likely that differences in productivity are responsible for this variation; Opio et al. (Reference Opio, Gerber, Mottet, Falcucci, Tempio, MacLeod, Vellinga, Henderson and Steinfeld2013) assume milk yields to be <500 kg/cow per year, whereas Weiler et al. (Reference Weiler, Udo, Viets, Crane and De Boer2014) and Udo et al. (Reference Udo, Weiler, Modupeore, Viets and Oosting2016) assume more than 1500 kg/cow per year. This variation demonstrates the importance of herd level analysis to improve the accuracy of Ei estimations, from which development opportunities can then be accurately assessed.
Beyond the complexity of GHG emissions allocation to milk and meat, functional allocation of GHG emissions remains a contentious topic. Weiler et al. (Reference Weiler, Udo, Viets, Crane and De Boer2014) and Udo et al. (Reference Udo, Weiler, Modupeore, Viets and Oosting2016) demonstrated that Ei decreased by around 20% when changing from allocation of emissions to protein only to allocation to a broader range of cattle functions (e.g. protein, manure, finance, insurance, perceived wealth and dowry). Although it is important to recognise that cattle in SSA have functions beyond protein production, and some non-market products can be economically quantified using opportunity value (Udo et al., Reference Udo, Weiler, Modupeore, Viets and Oosting2016); other socio-cultural functions (e.g. symbols of wealth and identity, and use for dowry) remain a challenge to value (Weiler et al., Reference Weiler, Udo, Viets, Crane and De Boer2014). However, in the context of GHG mitigation, a priority for success is the identification of potential options to improve productivity that both reduce emissions and increase net profits for livestock keepers, who are the key actors in any successful development. This paper presents a herd level assessment of various agro-pastoral cattle systems in Senegal (from low input to semi-intensified), with the specific aims of: (a) defining ‘baseline’ GHG Ei of produce, (b) identifying a set of mitigation measures with potential for application to these systems, and (c) estimating the GHG emissions abatement potential (AP) and CE of these measures.
Livestock rearing supports more than a third of the population and contributes to around 4.8% of Senegal’s gross domestic product (Ministère du Commerce, 2013). It is also recognised as an opportunity for poverty alleviation, deserving of appropriately applied development policies (Roland-Holst and Otte, Reference Roland-Holst and Otte2007). The analysis presented here was primarily based on data collected by the International Livestock Research Institute’s (ILRI) Senegal Dairy Genetics project (https://senegaldairy.wordpress.com/), from 220 cattle keeping households around the cities of Thiès and Mbacké. Situated in the peanut agro-ecological zone, this region has a semi-arid climate with an average rainfall of 400 mm in a short wet season (July to October). Cattle are reared for milk and meat in largely agro-pastoral systems (Tebug et al., Reference Tebug, Kamga-Waladjo, Ema, Muyeneza, Kane, Seck, Ly and Lo2015; Marshall et al., Reference Marshall, Tebug, Juga, Tapio and Missohou2016).
Material and methods
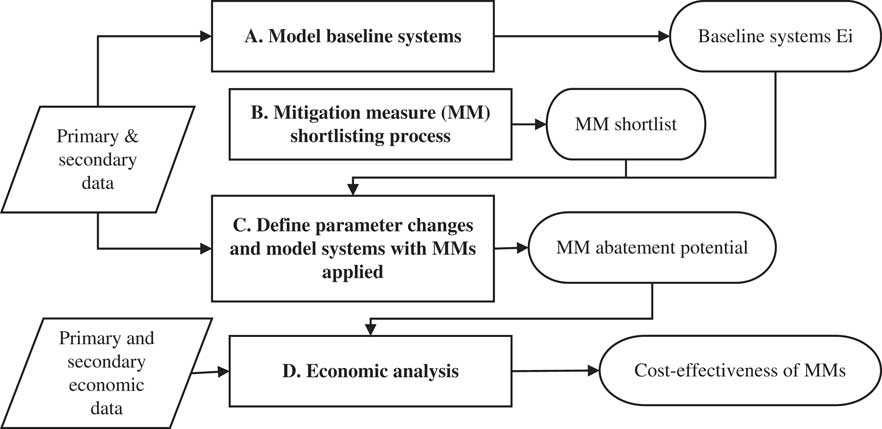
Households were categorised depending on (a) the dominant breed type kept (Table 1) and (b) the level of management input. Household feed cost was used as a proxy for management input and is indicated by + (the lowest level of management input), ++, +++ and ++++ (the highest level of management input). The methodological steps followed are illustrated in Figure 1 and described in the following sections.
Overview of the methodological stages. Ei=emissions intensity.

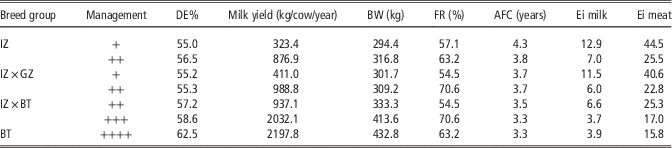
Breed groups into which cattle keeping households were categorised based on the dominant breed in their herds

IZ=indigenous zebu; IZ×GZ=indigenous×Guzerat zebu cross; IZ×BT=indigenous zebu×taurine cross; BT=taurine.
A. Model ‘baseline’ systems to calculate emissions intensity for protein production
The Global Livestock Environmental Assessment Model (GLEAM) was developed by the Food and Agriculture Organization of the United Nations. GLEAM uses a life cycle assessment framework, largely based on IPCC Tier 2 methodology, to estimate GHG emissions, livestock commodity production, and ultimately Ei for production at various spatial scales (Gerber et al., Reference Gerber, Steinfeld, Henderson, Mottet, Opio, Dijkman, Falcucci and Tempio2013; Opio et al., Reference Opio, Gerber, Mottet, Falcucci, Tempio, MacLeod, Vellinga, Henderson and Steinfeld2013). An Excel version of GLEAM, which enables herd level analysis, was used to calculate ‘baseline’ system GHG Ei for meat and milk production. The system boundary is cradle to farm-gate, and the emissions categories included are detailed on page 13 of Opio et al. (Reference Opio, Gerber, Mottet, Falcucci, Tempio, MacLeod, Vellinga, Henderson and Steinfeld2013). GLEAM first calculates the energy required to maintain livestock and levels of production (based on model input parameters including milk yields and body weights), followed by the quantity of feed needed to fulfil this requirement. Greenhouse gas emissions associated with the feed, manure and those from enteric fermentation are then allocated to protein (milk and meat) produced. For further detail concerning the Ei calculation, see Supplementary Figure S1. Other functions of cattle in these systems are not included in GHG allocation due to difficulties in accurately quantifying them. Input data used for modelling are detailed in Supplementary Table S1. A sensitivity analysis for the Ei result was carried out by altering each model input parameter, that could be changed when ‘baseline’ systems are altered to demonstrate the application of mitigation measures, by +10% and −10% (i.e. multiply each parameter by 1.1 and 0.9, respectively). The results of this analysis are summarised in Supplementary Table S2.
B. Mitigation measure shortlisting process
Mitigation measures were shortlisted through three stages (which are further detailed in Supplementary Table S3). The process began with a review of literature to consider options for cattle production systems to improve productivity and reduce Ei. Measures were included in a preliminary shortlist based on options that: (a) avoided high costs, (b) improved system productivity, (c) maintained or reduced absolute emissions and (d) had evidence of feasibility for application in SSA. Inevitably, there was a bias towards shortlisting mitigation measures that could have their application modelled. Secondly, consultation with experts with experience working in animal nutrition, genetics and health management in SSA, removed further measures and saw the addition of others; based largely on measure feasibility and effectiveness. A final stage of shortlisting involved focus group discussions with study livestock keepers (Salmon et al., Reference Salmon, Marshall, Tebug, Missohou, Sabi and MacLeod2016); this further shortlisted measures based on likelihood of uptake.
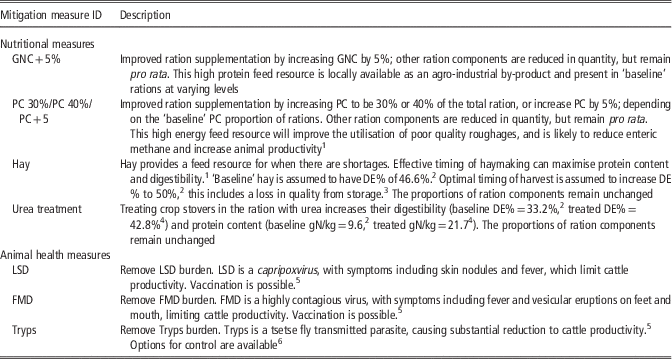
The shortlist of mitigation measures is summarised in Table 2. Feed related measures are dominant due to (a) focus group discussions identifying feed interventions as having the greatest immediate feasibility; and (b) the low nutritional value of ‘baseline’ rations, and evidence of the availability of higher nutritional value feed materials.
Details of shortlisted mitigation measures with potential for application to ‘baseline’ production systems

GNC=groundnut cake; PC=purchased compound feed; DE%=digestible energy as a percentage of gross energy; gN/kg=grams of nitrogen per kg of dry matter; LSD=lumpy skin disease; FMD=foot and mouth disease; Tryps=trypanosomiasis.
1 See Lukuyu et al. (Reference Lukuyu, Gachuiri, Lukuyu, Lusweti and Mwendia2012).
2 Based on data in Jarrige (Reference Jarrige1989).
3 See Feyissa et al. (Reference Feyissa, Prasad, Assefa, Bediye and Kitaw2014).
4 See Chenost and Kayouli (Reference Chenost and Kayouli1997).
5 See Blowey and Weaver (Reference Blowey and Weaver2003).
6 See Bouyer et al. (Reference Bouyer, Seck, Dicko, Sall, Lo, Vreysen, Chia, Bouyer and Wane2014).
C. Defining input parameter changes to model application of shortlisted mitigation measures
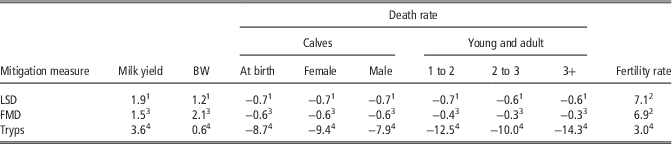
‘Baseline’ systems had model input parameters altered to represent the expected changes to the system when each mitigation measure is applied. Nutritional measures are explained in Table 2 (for nutritional measures the ration compositions are altered, but due to the difficulty in making a prediction of how animals will respond to improved nutrition, production level input parameters (e.g. milk yields) do not change from ‘baselines’). Animal health measures are detailed in Table 3; specific changes to production level model input parameters were based on available relevant literature. In the first instance measures were applied standalone, assuming no interaction and comparison made between the single measure applied and the relevant ‘baseline’ system. Following an assessment of the CE of measures applied standalone, they were then applied as packages in order of CE. To reflect interactions between nutritional measures, the values for groundnut cake (GNC), purchased compound feed (PC), hay and urea treatment were recalculated after the implementation of each measure. For health measures it was assumed that burdens for each disease would be removed from different animals in the herd (i.e. that there were no interactions between these measures). Abatement potential (tonnes of CO2eq abated/herd per year) was calculated by multiplying the difference in Ei of the system with the measure being considered and without the measure being considered, by the ‘baseline’ system protein yield.
Percentage changes made to model input parameters to represent the expected productivity changes for a herd when disease burdens are removed

LSD=remove burden of lumpy skin disease; FMD=remove burden of foot and mouth disease; Tryps=remove burden of trypanosomiasis.
1 Derived from Daher (Reference Daher1994), Abutarbush et al. (Reference Abutarbush, Ababneh, Al Zoubi, Al Sheyab, Al Zoubi, Alekish and Al Gharabat2015), Ayelet et al. (Reference Ayelet, Abate, Sisay, Nigussie, Gelaye, Jemberie and Asmare2013), Hailu et al. (Reference Hailu, Gari, Tolosa, Beyene and Teklue2015), Gari et al. (Reference Gari, Bonnet, Roger and Waret-Szkuta2011), Salib and Osman (Reference Salib and Osman2011) and assuming prevalence of LSD in the population of 7.1% (Ministère de l’élevage, 2013; Ministère de l’élevage et des productions animales, 2014).
2 Assumed if an animal had LSD or FMD it would not be fertile, therefore fertility burden equal to respective disease prevalence (Gari et al., Reference Gari, Bonnet, Roger and Waret-Szkuta2011; Knight-Jones and Rushton, Reference Knight-Jones and Rushton2013).
3 Dervied from Bayissa et al. (Reference Bayissa, Ayelet, Kyule, Jibril and Gelaye2011), Lyons et al. (Reference Lyons, Alexander, Stärk, Dulu, Sumption, James, Rushton and Fine2015), Rufael et al. (Reference Rufael, Catley, Bogale, Sahle and Shiferaw2008), Young et al. (Reference Young, Suon, Andrews, Henry and Windsor2013), Şentürk and Yalçin (Reference Şentürk and Yalçin2008), Jemberu et al. (Reference Jemberu, Mourits, Woldehanna and Hogeveen2014), Onono et al. (Reference Onono, Wieland and Rushton2013) and assuming prevalence of FMD in the population of 6.9% (Ministère de l’élevage, 2013; Ministère de l’élevage et des productions animales, 2014).
4 Taken from Shaw et al. (Reference Shaw, Hendrick, Gilbert, Mattioli, Codjia, Dao, Diall, Mahama, Sidibé and Wint2006), and assuming that 50% of Senegal study herds are in regions with the tsetse fly (Bouyer et al., Reference Bouyer, Seck, Dicko, Sall, Lo, Vreysen, Chia, Bouyer and Wane2014).
D. Economic analysis and cost-effectiveness
Economic analysis and CE results were based on a typical herd with eight breeding cows on an annual basis (GLEAM calculates and includes the total herd structure, including young stock and bulls). The CE ($/tonne of CO2eq abated) of each mitigation measure was calculated by dividing the cost of implementing the mitigation measure by the change in emissions caused by the application of the measure, using the following equation:
 $${\rm CE}\,{\equals}\,{{\displaystyle{\rm Gross}\,{\rm margin}\,{\rm with}\,{\rm measure}\,{\rm applied}\,{\minus} \atop \displaystyle{\rm gross}\,{\rm margin}\,{\rm without}\,{\rm measure}\,{\rm applied}} \over \displaystyle{\left( {{\rm Ei}\,{\rm with}\,{\rm measure}\,{\minus}\,{\rm Ei}\,{\rm without}\,{\rm measure}} \right){\times}}\atop \displaystyle{{\rm baseline\, \rm protein\, \rm yield}}}$$
Only private costs of implementation are considered. Individual households do not incur the cost of tsetse removal, to remove the burden of trypanosomiasis (Tryps). It is part of a regional Senegal Government project; however, a relative cost to individual households is included to allow effective comparison with other measures. Social costs (e.g. economic welfare, environmental impacts beyond GHGs, human health and animal welfare) would require further quantification to be included.
Revenue and cost assumptions
Revenue and cost assumptions are detailed in the Supplementary Table S4. The cost of implementing nutritional mitigation measures represents an annual recurring cost to maintain an improved ration. It was assumed that no additional fixed costs or capital investments are required to improve rations and that any additional costs are included in the price of the feed materials. The cost of implementing measures to remove the burden of foot and mouth disease (FMD) and lumpy skin disease (LSD) also represent an annual recurring cost, with control based on the implementation of effective vaccination. It was assumed that any additional costs are included in the price of the treatment. The costs of Tryps burden removal were based on a project within Senegal to remove the tsetse fly vector (Bouyer et al., Reference Bouyer, Seck, Dicko, Sall, Lo, Vreysen, Chia, Bouyer and Wane2014). Due to the isolation of the tsetse population in Senegal from the rest of the African tsetse belt, an assumption was made that once the initial project cost of eradicating the tsetse is applied, the eradication will be sustainable without additional costs. Therefore, to consider net present value, the costs and benefits of the tsetse vector eradication were discounted. A discount rate of 10%, suggested by Shaw et al. (Reference Shaw, Torr, Waiswa, Cecchi, Wint, Mattioli and Robinson2013) to be acceptable for livestock projects, was applied over 30 years.
Results
‘Baseline’ emissions intensity
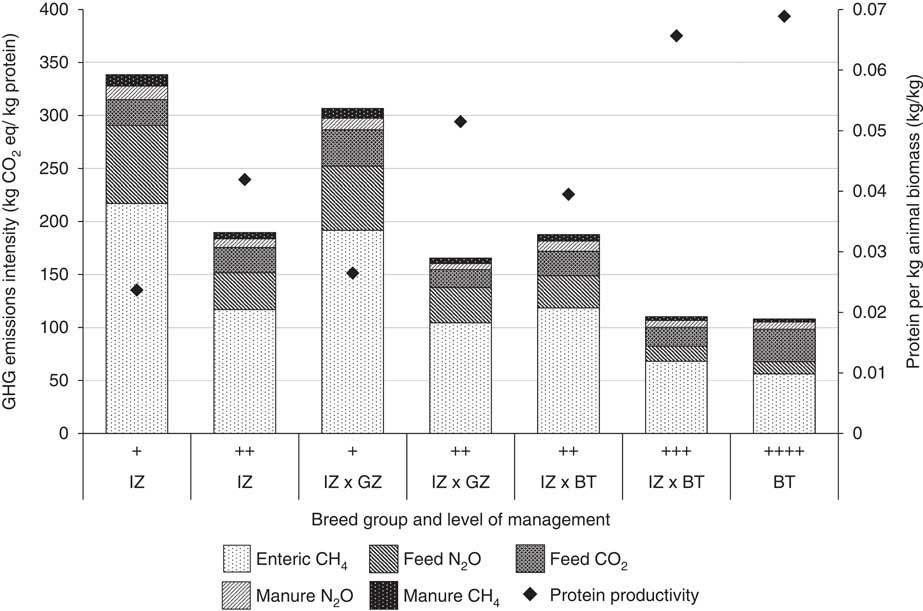
The Ei for protein (kgCO2eq/kg protein), with emissions categories defined (enteric, feed related and manure), and protein productivity (defined as kg of protein produced annually per kg of total herd biomass) for ‘baseline’ systems are illustrated in Figure 2. Key emissions categories are enteric methane (CH4), feed nitrous oxide (N2O) (largely from organic nitrogen (N) in urine and manure deposited directly whilst grazing and collected then spread) and carbon dioxide (CO2) from energy used in the production of GNC and PC. Figure 2 shows a variation in Ei between ‘baseline’ systems (both between breed groups and between levels of management within breed groups) and the negative trend between herd protein productivity and Ei. The sensitivity analysis (Supplementary Table S2) revealed that the Ei result is most affected by the ration digestibility, milk yield, fertility rate, body weights and age at first calving or maturity; therefore, the ‘baseline’ values for these parameters are presented in Table 4. Taurine (BT) and zebu taurine cross (IZ×BT) breed groups are fed rations of higher digestibility, largely produce higher milk yields and have greater body weights than indigenous zebu (IZ) and zebu cross (IZ×GZ) breed groups. The level of management is also important in determining milk yield and body weight differences both within and between breed groups. Concerning fertility rate, management appears to be influential, with not an as marked difference between breed groups. Whilst Figure 2 shows the Ei for total protein production, Table 4 shows Ei for both kg of milk and kg of meat. As expected, these follow the same negative trend between herd productivity and Ei.
Emissions intensity (kgCO2eq/kg protein) (bars, left y-axis) and herd protein productivity (annual protein produced per kg of animal biomass in the herd) (diamonds, right y-axis), by breed group and management level. Results shown are for typical herds.

Details of parameters identified by the sensitivity analysis to have most influence on the emissions intensity (Ei) (kgCO2eq/kg product) result

DE%=ration digestibility (expressed as percentage of gross energy); BW=adult cow body weight; FR=adult cow fertility rate; AFC=Age at first calving; Ei milk/meat=(kgCO2eq/kg product); IZ=indigenous zebu; IZ×GZ=indigenous×Guzerat zebu cross; IZ×BT=indigenous zebu×taurine cross; BT=taurine.
Mitigation measure abatement potential and cost-effectiveness
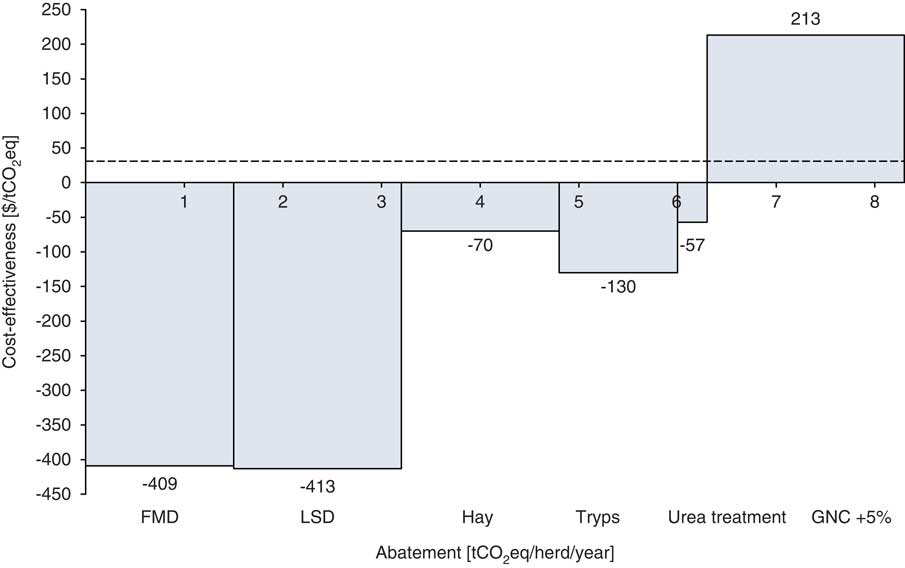
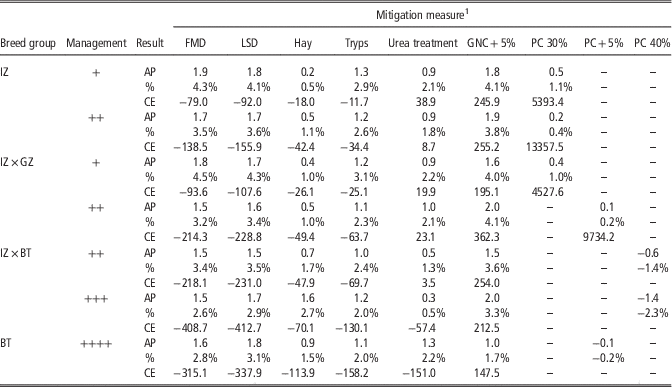
The GHG AP (tonnes of CO2eq abated/herd/year) and CE ($/tonne of CO2eq abated) of shortlisted mitigation measures applied to typical herds of the ‘baseline’ systems are detailed in Table 5. Figure 3 is an example marginal abatement cost curve (MACC) for a zebu taurine cross (IZ×BT) herd with a higher level of management. The MACC indicates: (a) the CE of emission abatement (y-axis), (b) the GHG AP for each measure (x-axis) and (c) the total cost of each measure (the area of each bar). Results suggest that across the ‘baseline’ systems there is potential to abate between 4.7 and 6.7 tCO2eq/herd per year through ‘win-win’ measures. This represents a respective reduction of between 10% and 13% to annual total herd GHG emissions. Mitigation measures were modelled as packages, applied in order of their CE when initially applied in isolation. As explained in the ‘Material and methods’ section, efforts were made to avoid double counting of AP.
Annual marginal abatement cost curve for a typical herd of zebu taurine crossbreed with a higher level of management. Measures are applied as a package in order from left to right. Measures appear to not be applied in order of cost-effectiveness (CE); however, they are applied as a package from left to right, with the order defined by their CE when modelled in isolation. The dashed reference line illustrates a social cost of carbon of $31/tCO2eq, representing the economic cost to society caused by an additional tonne of CO2eq emitted. Measures can be: (a) ‘win-win’, with potential to abate emissions and provide a private benefit (below the x-axis), (b) economically efficient, with potential to abate emissions at a cost less than the social cost of carbon (above the x-axis, but below the reference line) and (c) economically inefficient, with potential to abate emissions, but with a cost per tonne of carbon currently greater than the social cost of carbon (above both the x-axis and the reference line). FMD=foot and mouth disease; LSD=lumpy skin disease; GNC=groundnut cake.

Abatement potential (AP) (tCO2eq/herd/year), percentage reduction to ‘baseline’ emissions (%) and cost-effectiveness (CE) ($/tCO2eq) for mitigation measures applied to typical herds

FMD=foot and mouth disease; LSD=lumpy skin disease; Tryps=trypanosomiasis; GNC=groundnut cake; PC=purchased compound feed; IZ=indigenous zebu; IZ×GZ=indigenous×Guzerat zebu cross; IZ×BT=indigenous zebu×taurine cross; BT=taurine.
‘–’ Represents where measures were not applicable to the respective system or application increased absolute emissions.
Discussion
‘Baseline’ emissions intensity
The Ei results for milk production (4 to 13 kgCO2eq/kg) (Table 4) are similar to those in Opio et al. (Reference Opio, Gerber, Mottet, Falcucci, Tempio, MacLeod, Vellinga, Henderson and Steinfeld2013) (9 kgCO2eq/kg for SSA), but greater than those in Weiler et al. (Reference Weiler, Udo, Viets, Crane and De Boer2014) and Udo et al. (Reference Udo, Weiler, Modupeore, Viets and Oosting2016) (around 2 kgCO2eq/kg for Kenyan systems). Contrast with Weiler et al. (Reference Weiler, Udo, Viets, Crane and De Boer2014) and Udo et al. (Reference Udo, Weiler, Modupeore, Viets and Oosting2016) is likely due to differences in levels of productivity; particularly for the lower producing Senegal systems (300 to 500 kg milk/cow/year), in comparison with Weiler et al. (Reference Weiler, Udo, Viets, Crane and De Boer2014) and Udo et al. (Reference Udo, Weiler, Modupeore, Viets and Oosting2016) considering yields from 1500 to over 3000 kg/cow/year. Herd structure is also influential, with productive cows making up 30% to 40% of Senegal study herds, whilst productive cows were 45% to 60% of herds in the studies by Weiler et al. (Reference Weiler, Udo, Viets, Crane and De Boer2014) and Udo et al. (Reference Udo, Weiler, Modupeore, Viets and Oosting2016). The higher the proportion of the herd made up of productive animals, the less biomass requiring maintenance (plus the associated emissions) for each unit of produce. The Ei results for meat production (16 to 45 kgCO2eq/kg) (Table 4) are less than Opio et al. (Reference Opio, Gerber, Mottet, Falcucci, Tempio, MacLeod, Vellinga, Henderson and Steinfeld2013) (70 kgCO2eq/kg beef). Contrast here is likely due to the Senegal study systems having animals of greater body weight (adult cows weighed between 294 and 433 kg in comparison with 271 kg in Opio et al. (Reference Opio, Gerber, Mottet, Falcucci, Tempio, MacLeod, Vellinga, Henderson and Steinfeld2013)), and a higher cow replacement rate (17% to 21% in comparison with 11% in Opio et al. (Reference Opio, Gerber, Mottet, Falcucci, Tempio, MacLeod, Vellinga, Henderson and Steinfeld2013)). This results in a greater quantity of meat being produced per animal in the herd. These results demonstrate that for the effective assessment of any development or productivity improvement plans the ‘baseline’ should be considered in detail.
The variation in Ei results for the ‘baseline’ systems (Figure 2) demonstrates the potential to reduce GHG emissions through improvements to productivity. This could be through the choice of breed, with those breeds with a higher level of productivity having lower Ei for protein production. However, the variation in Ei within breed groups with different levels of management input suggests that there is potential to abate emissions by improving the systems with the animals they currently rear. Results also demonstrate that breeds with a likely higher level of genetic potential for productivity do not always result in lower Ei. In particular, zebu cross herds with a comparable level of management input to zebu taurine cross herds (with a likely higher genetic potential for productivity (Table 1)), have a higher level of productivity and therefore a lower Ei. Due to challenging conditions, management input is important if production potentials are to be met. Crossbred animals that introduce increased productivity potential but retain some of the resilience of indigenous breeds are often more appropriate (Marshall et al., Reference Marshall, Tebug, Juga, Tapio and Missohou2016).
Key emission categories
The digestibility of feed rations will influence both enteric CH4 and manure-related emissions (low digestibility increases enteric CH4, and manure N and volatile solid excretion). Due to the high reliance on low quality roughages by these systems these emission categories are expected to be substantial; this is consistent with Opio et al. (Reference Opio, Gerber, Mottet, Falcucci, Tempio, MacLeod, Vellinga, Henderson and Steinfeld2013). Cattle in these systems spend considerable time grazing pasture, depositing organic N in manure and urine, and any collected manure is stored solid, promoting the release of N2O. Carbon dioxide from feed production contributes a higher proportion of total emissions than suggested by other studies for SSA (Opio et al., Reference Opio, Gerber, Mottet, Falcucci, Tempio, MacLeod, Vellinga, Henderson and Steinfeld2013); this is due to the presence of processed feed components (GNC and PC) in the rations.
Abatement potential and cost-effectiveness
The effective control through vaccination of FMD and LSD, and the removal of Tryps burden through tsetse vector control, are consistent ‘win-win’ interventions (Table 5 and Figure 3). The cost of additional vaccination for effective protection is assumed to be outweighed by the expected increases in productivity and associated increases in household revenue (from increased milk yields and carcass weights). The removal of Tryps burden through the project explained by Bouyer et al. (Reference Bouyer, Seck, Dicko, Sall, Lo, Vreysen, Chia, Bouyer and Wane2014), has an initial project cost, but then is followed by reoccurring annual productivity benefits (Table 3). Discounting the household revenue benefits over a period of 30 years provides a net present value that outweighs the project costs. A further refinement could be to allocate some of the cost to other benefits of removing the tsetse vector, such as expected health and production benefits for other livestock species and a reduction in grazing pressure (Bouyer et al., Reference Bouyer, Seck, Dicko, Sall, Lo, Vreysen, Chia, Bouyer and Wane2014); this may increase the CE of tsetse removal further. The herd level productivity burdens (Table 3) of these shortlisted diseases are based on disease prevalence records, and are likely to be underestimated as disease occurrence is commonly under-reported by livestock keepers (Tebug et al., Reference Tebug, Kamga-Waladjo, Ema, Muyeneza, Kane, Seck, Ly and Lo2015).
The improved timing of hay harvesting for optimal nutritional value is also suggested as a ‘win-win’ option (Table 5 and Figure 3). The improved nutritional value of hay improves the overall quality of the ration, and means less ration is required to meet the energy requirements of the cattle, representing reduced emissions and a cost reduction. It is assumed that improved hay will not increase in cost and will not require any additional labour. The CE, although always below $0/tCO2eq, varies between systems depending on the proportion of hay in the ration. The zebu taurine cross and taurine herds spend more time housed, so hay is a larger proportion of their ration (30% and 18%, respectively); therefore, this measure is most CE when applied to these systems. Both zebu taurine cross with a higher level of management and taurine herds also have a higher proportion of millet stover in their ration, making the urea treatment of stover a ‘win-win’ measure for these systems only.
In the current method, as ration digestibility is improved through nutritional mitigation measure application two variables change in the model. First, the ratio of net energy available in the ration for both maintenance and growth to digestible energy consumed increases. As no productivity increases are included in the model for nutritional improvements, the animal gross energy requirement decreases and there is a decrease in both feed intake and associated emissions. Second, with increasing ration digestibility the enteric CH4 from each unit of feed consumed decreases. Therefore, the emissions AP and CE of the nutritional mitigation measures are derived from both reduced feed intake requirements and reduced enteric CH4 emissions. Neither of these responses are linear, instead they follow a curve of diminishing returns; and nutritional measures that follow the application of previous nutritional measures will have less AP than if they were applied in isolation. For instance, although with substantial purchase costs, both GNC and PC greatly improve the digestibility of the ration. Groundnut cake is consistently more CE than PC when applied in isolation, therefore is applied first when part of a package. Purchased compound feed applied following the application of GNC has reduced AP and for both zebu taurine cross and taurine herds (which have a higher baseline ration digestibility than other groups), the AP of PC is outweighed by the increased emissions associated with its processing and transport (Table 5). This reveals a key limitation to the assessment of nutritional mitigation measures both within this study and when using the Tier 2 methodology. In reality when a ration is improved feed intake and animal productivity would likely increase, particularly for systems likely to be nutritionally limited (Bryan et al., Reference Bryan, Ringler, Okoba, Koo, Herrero and Silvestri2013). The emissions AP and CE of nutritional mitigation measures would then be a balance between productivity improvements, increasing both household revenue and units of produce over which to allocate emissions (reducing Ei); and an increase in feed intake, increasing emissions associated with feed and increasing the household feed costs.
It is encouraging that the results identify that ‘win-win’ measures are available, these are important for engagement and increased uptake of measures by livestock keepers. However, their presence raises a question as to why ‘win-win’ measures, such as the removal of FMD and LSD, are not currently adopted. Focus group discussions with over 200 of the study livestock keepers suggest barriers include: a lack of initial financial means to invest, a lack of regular access to resources, and system characteristics and traditions (Salmon et al., Reference Salmon, Marshall, Tebug, Missohou, Sabi and MacLeod2016).
Conclusion
The results of this study suggest that the Ei of meat and milk from the study systems can be significantly reduced through measures that also maintain or increase protein production. A portion of this emission abatement could be achieved with apparent ‘win-win’ measures, improving the likelihood of essential engagement with livestock keepers. The study also reveals challenges, which deserve further investigation; in particular when using the Tier 2 methodology to assess the potential for nutritional measures. These include predicting the intake and productivity response of animals fed improved rations. Changes to feed intake could be estimated and the additional energy available to animals then used to predict productivity responses, however predicting the energy partitioning by cattle to different functions remains a challenge. Despite these challenges, the use of modelling to identify and quantify cost-effective measures of productivity improvement and GHG emission abatement, as demonstrated by this study, should be an important primary step in effective sustainable development efforts.
Acknowledgements
The authors would like to thank experts from ILRI (Alan Duncan, Augustine Ayantunde and Ben Lukuyu), field staff in Senegal, and CIRAD staff in Dakar (Philippe Lecomte and Christian Corniaux) for their advice and assistance during the mitigation measure shortlisting process. This study is part of a wider PhD project funded by the ILRI under CCAFS, the CGIAR Climate Change, Agriculture and Food Security Research Program. The Senegal Dairy Genetics project was funded by the Finnish Ministry of Foreign Affairs under the FoodAfrica program, and the CGIAR Livestock and Fish Research Program.
Supplementary material
To view supplementary material for this article, please visit https://doi.org/10.1017/S1751731117002294