Introduction
Ruminants fitted with cannulas in the rumen and duodenum are generally used to estimate the flow and disappearance of nutrients from different segments of the digestive tract (Titgemeyer, Reference Titgemeyer1997), and to determine the supply and availability of amino acids (AA) to the animal (Windschitl and Stern, Reference Windschitl and Stern1988; Ludden and Cecava, Reference Ludden and Cecava1995; Mabjeesh et al., Reference Mabjeesh, Arieli, Buckental, Zamwell and Tagari1996). Although helpful, cannulation methods are expensive and labour–intensive and are subject to errors associated with sampling of digesta when indigestible markers are used to measure digesta flow (Stern et al., Reference Stern, Bach and Calsamiglia1997). Furthermore, when research protocols require much surgical and other manipulation of animals (invasive procedures), questions arise regarding animal welfare and the applicability of such results to intact animals (Swanson, 1994).
Alternative procedures, such as the nylon bag in situ technique, also require the use of cannulated animals and do not account for the physiological aspects of digestion, such as mastication and digesta passage. To avoid the use of surgically prepared animals, researchers may utilise in vitro digestion procedures to determine the intestinal availability of AA. However, results of AA availability based on in vitro procedures are not always consistent with those obtained in situ (Van der Poel et al., Reference Van der Poel, Doorenbos, Huisman and Boer1991; Stern et al., Reference Stern, Bach and Calsamiglia1997; Borucki Castro et al., Reference Borucki Castro, Phillip, Lapierre, Jardon and Berthiaume2007).
Rulquin and Kowalczyk (Reference Rulquin and Kowalczyk2003) proposed an approach of determining the availability of essential AA (EAA) in dairy cows. This method involves feeding the test ingredient, then relating the plasma concentration of the AA of interest to a plasma-AA response curve obtained by duodenally infusing graded levels of the AA of interest. These authors concluded that the technique yielded reliable estimates for availability of methionine (Met) but that further tests should be performed before the method could be used for assessing the availability of lysine (Lys).
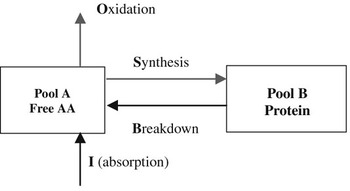
Isotope dilution techniques have been used to estimate whole-body (WB) irreversible loss rate or total utilisation of EAA in ruminants (Cronjé et al., Reference Cronjé, Nolan and Leng1992; Bequette et al., Reference Bequette, Metcalf, Wray-Cahen, Backwell, Sutton, Lomax, MacRae and Lobley1996; Lobley et al., Reference Lobley, Connell, Revell, Bequette, Brown and Calder1996), and changes in the WB net flux of Lys and leucine have also been shown to reflect the dietary supply and needs of these EAA in lambs (Cronjé et al., Reference Cronjé, Nolan and Leng1992). For these reasons, this metabolic approach has the potential to provide knowledge of variations in the availability of EAA in protein supplements. The flux (Q) of an EAA represents the sum of the rate at which the EAA enters the pool due to absorption (I) and protein breakdown (B). Under steady-state conditions, this flux equals the sum of the rate at which the EAA leaves the measured compartment (plasma or intracellular pool) for protein synthesis (S) plus the rate of oxidation (O) of the EAA (Waterlow et al., Reference Waterlow, Garlick and Millward1978; Lobley, Reference Lobley1993). The mathematical relationship is as follows: Q = I+B = S + O. Once the EAA under study is not limiting in the basal diet, an increment in absorption of this EAA in adult animals should not alter either protein synthesis (S) or protein retention (Harris et al., Reference Harris, Lee, Sinclair and Treolar1994); protein breakdown (B), therefore, should also remain unchanged. Based on Q = I+B, if B remains constant, a change in the flux (Q) of the tested EAA due to a treatment should reflect a change in absorption (I) and hence a change in the bioavailability of the EAA in question. Thus, measurement of flux (Q), referred in our study as WB Lys net flux, could be a useful non-invasive method, and a good metabolic procedure, for determining changes in the Lys availability of rumen-protected protein supplements. The need to improve models for AA nutrition of dairy cattle (National Research Council (NRC), 2001; Rulquin et al., Reference Rulquin, Vérité, Guinard-Flament and Pisulewski2001) argues for improvements in the methods for assessing the availability of EAA, and the use of non-invasive procedures would render such methods even more appealing.
The objectives of this study were as follows: (1) to determine whether different soya-bean meal (SBM) products, processed to reduce rumen degradability, would show differences in the intestinal availability of Lys in dairy cows; (2) to assess differences between diets with different SBM in Lys availability using three different methods: the WB Lys net flux, the plasma response method of Rulquin and Kowalczyk (Reference Rulquin and Kowalczyk2003) and the more conventional estimation of Lys digestibility, which combines measurements of duodenal flow and intestinal digestion; and (3) to assess the usefulness of the WB Lys net flux method as an approach to determining Lys availability.
Material and methods
Animals and treatments
Four multiparous Holstein cows, averaging 649 ± 46.3 kg BW and 173 ± 28.7 days in milk at the beginning of the study, were used for the experiment. The study was designed as a 4 × 4 Latin square, balanced for residual effects (Cochran and Cox, Reference Cochran and Cox1957), with 14-day experimental periods. All cows were equipped with ruminal (Bar Diamond, Parma, ID, USA) and closed T-shaped duodenal cannulas (Berzins Vet Laboratory Ltd, Edmonton, Alta., Canada). Animal-care procedures followed the guidelines of the Canadian Council on Animal Care (1993), and the protocol was approved by the Institutional Animal Care Committee of the Dairy and Swine Research and Development Centre, at Sherbrooke, Que., Canada (Agriculture and Agri-Food Canada).
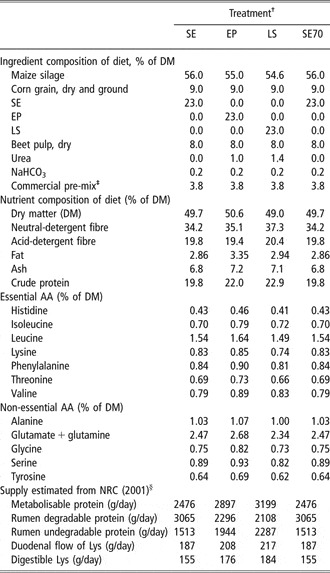
The cows were housed in tie stalls and fed a total mixed ration at 95% of ad libitum intake, as measured prior to the initiation of the experiment. Water was freely available to all cows and they were milked twice each day at 0900 and 2000 h. To achieve steady-state conditions, the diets were offered in 12 equal meals (at 2-h intervals) using automated feeders (Ankom, Fairport, NY, USA). The diets were formulated according to NRC (2001) for energy and metabolisable protein, and to meet the requirement for methionine and lysine. Table 1 shows the ingredient composition of the experimental diets, which varied only in the type of SBM product: (1) solvent-extracted SBM (SE; ADM Agri-Industries, Windsor, Ont., Canada); (2) expeller-processed SBM (EP; SoyPLUS® West Central, Ralston, IA, USA); and (3) lignosulphonate-treated SBM (LS; Surepro® Land O’Lakes Purina Feed LLC, St Paul, MN, USA). The fourth treatment (SE70) was an infusion of Lys (70 g/day) into the omasum of cows fed the SE diet. This infusion rate was selected to ensure that the amount of duodenally available Lys was about 20% (equivalent to 40 g/day) greater than that predicted for LS (NRC, 2001; Table 1). The SE70 treatment served as a ‘quality control’ to assess the accuracy of the different methods in estimating an increment in the duodenal supply of Lys. The Lys (Lys monohydrochloride, 98.5% pure, Ajinomoto Heartland Inc., Eddyville, IA, USA) was diluted in purified water and the solution was adjusted to pH 3.0 with HCl (final concentration 0.01 mol/l) before being infused (150 ml/h). The infusion was performed with a peristaltic pump (Masterflex®; Cole Parmer Instrument Co., Vernon Hills, IL, USA), and the infusion tube was positioned through the rumen cannula to deliver the solution directly into the omasum (Huhtanen et al., Reference Huhtanen, Brotz and Satter1997). The cows receiving treatments SE, EP and LS were infused with saline (0.9% NaCl) via the omasum at an equivalent rate (150 ml/h).
Ingredients and nutrient composition of the experimental diets

†DM = dry matter; SE = solvent-extracted soya-bean meal (SBM); EP = expeller-processed SBM; LS = lignosulphonate-treated SBM; SE70 = SE+70 g/day omasal infusion of Lys.
‡Base Laitière (Shur Gain; Brossard, Que., Canada): 8% CP; 2.1% fat; 10.5% ADF; 0.84% Na; 2.44% Ca; 0.60% P; 0.36% Mg; 0.33% K; 0.20% S; 71.2 mg/kg Cu; 257 mg/kg Mn; 344 mg/kg Z; 1.3% Cl; 1.3 mg/kg Se; 269 mg/kg Fe; 29 027 IU/kg vitamin A; 6450 IU/kg vitamin D3 ; 97 IU/kg vitamin E.
§g of Lys infused were not included on calculations for diet SE70.
Each SBM supplement represented 23% (dry-matter (DM) basis) of the diet and accounted for approximately 55% of the total dietary protein. These SBM supplements were chosen based on our previous study, which showed significant differences in rumen undegradable protein (RUP) in these SBM products (Borucki Castro et al., Reference Borucki Castro, Phillip, Lapierre, Jardon and Berthiaume2007). SE is produced by the extraction of oil with hexane, and is the most common process of oil extraction. However, SBM has been treated in various ways to enhance the quantity of RUP. The heat-generating expeller process (EP) is a conventional method to extract oil from soya beans; this process results in an increased proportion of RUP. Treatment of SBM with LS is an alternative method to increase RUP. The process involves a chemical reaction with sulphite liquors, which are by-products of wood pulp processing. Based on estimations from the NRC model (NRC, 2001), the rumen-protected SBM products (EP and LS) provided greater amounts of duodenal Lys compared with SE (SE < EP < LS). To avoid the possibility of restricting rumen microbial protein synthesis, urea was added at the level of 1% (DM basis) to the EP diet and at 1.4% to the LS diet. This ensured a minimum rumen-degradable protein balance of +100 g/day (NRC, 2001). To determine nutrient flow through the gastrointestinal tract, chromium(III) oxide (5 kg/t of ration, fresh basis) was used as a digesta marker; it was mixed with ground maize, and the mixture was pelleted and incorporated in the total mixed ration.
Infusion and sampling
Within each 14-day experimental period, the cows were allowed to adapt to their respective diets for 10 days. Samples of the individual diets and orts were then collected on each of the 4 subsequent days. Milk production was recorded from days 5 to 14. Milk samples were collected daily from days 10 to 14 during the morning and afternoon milking, and pooled daily in relation to milk production.
On day 12 of each experimental period, a total of six blood samples were collected at 45-min intervals, beginning at 0900 h and ending at 1245 h (covering two feeding cycles). These samples were used to determine plasma Lys concentration. Immediately after the last blood sample was collected, a pulse dose of labelled L-[2–15N] Lys (0.5 g in 5 ml saline) was injected into the jugular vein of each cow. Blood samples were collected from the ipsolateral jugular vein at 1, 2, 3, 4, 5, 6, 7, 8, 9, 10, 13, 16, 19, 25 and 31 min after the bolus injection. To facilitate blood collection, indwelling catheters were inserted in the jugular vein of each cow, one day before blood sampling. All blood samples were maintained on ice and then centrifuged at 1500 × g for 12 min. To determine plasma Lys concentration, 0.2 g of an internal standard consisting of a mixture of labelled AA (Raggio et al., Reference Raggio, Pacheco, Berthiaume, Lobley, Pellerin, Allard, Dubreuil and Lapierre2004) was added to 1 g plasma. All plasma samples were then frozen at −80°C for subsequent analysis of Lys concentration and isotopic enrichment (IE).
Samples of ruminal digesta (2 l), duodenal digesta (1 l) and faeces (grab samples, 200 g) were collected at 0900, 1100, 1300 and 1500 h on day 13, and at 0800, 1000, 1200 and 1400 h on day 14. Ruminal digesta samples were taken from different locations within the rumen and the pH was immediately taken on the composite sample with a pH meter (Piccolo pH meter; Hanna Instruments Inc., Woonsocket, RI, USA). The samples of ruminal digesta were strained through four layers of cheesecloth. Samples of duodenal digesta were collected via the duodenal cannula using a collection gate, which deflected the digesta into the collection bottle. Formol was added as a preservative to part of the ruminal fluid and duodenal samples (75 ml formol physiological saline solution in 300 ml digesta). All samples were then stored at −20°C for subsequent analyses.
At the end of the fourth period of the experiment, the same four cows were used to perform the plasma-response study, according to the method of Rulquin and Kowalczyk (Reference Rulquin and Kowalczyk2003). However, some modifications were made to the sampling protocol and feeding frequency. This study was designed as two consecutive 4 × 4 Latin squares, each consisting of 4-day experimental periods. In the first Latin square, the cows were infused via the omasum, with graded amounts of Lys at the rates of 0, 28, 56 and 84 g/day; in the second Latin square, Lys was infused at the rates of 0, 14, 42 and 70 g/day. The preparation and infusion of Lys were performed as described earlier. The cows were offered the SE diet and received the same amount of diet DM as provided in the main study. The diet was fed using automated feeders and was provided in 12 equal meals. On day 4 of each experimental period, six blood samples were collected from the jugular vein at 45-min intervals, beginning at 0900 h and ending at 1245 h (covering two feeding cycles), as in the main study. Plasma samples were prepared for Lys analysis, as previously described.
Samples of diets were taken once each week, and milk samples were collected on days 3 and 4 of each experimental period. The relationship between amounts of Lys infused and the concentration of plasma Lys yielded a ‘plasma-response curve’. This curve was then used to estimate variations in Lys availability relative to SE, using the measured plasma Lys concentrations when cows were fed the respective SBM sources (EP, LS and SE70).
Analytical methods
Samples of individual feed ingredients, total mixed ration and digesta were freeze-dried and ground to pass a 1-mm screen. Ash and analytical DM were determined with a thermogravimetric analyser (Model TGA-601: LECO Corporation, St Joseph, MI, USA). Nitrogen in feed, digesta and microbial pellets was determined by thermal conductivity (LECO model TruSpec v1.10 Nitrogen Determinator; LECO, St Joseph, MI, USA). Fat was determined by gravimetric analysis, using ISCO SFX™ 3560 supercritical fluid extraction (ISCO Inc., Lincoln, NE, USA) and without co-solvent modifiers for extraction of phospholipids. Analyses of neutral- and acid-detergent fibre were performed according to the methods of Van Soest et al. (Reference Van Soest, Robertson and Lewis1991) using the Ankom System (ANKOM 200, Fiber Analyzer, Fairport, NY, USA), with heat stable alpha-amylase and without sodium sulphite. Chromium(III) oxide in samples of feed and digesta were determined using atomic absorption (Perkin Elmer AAnalyst 300; Woodbridge, Ont., Canada) based on the methodology of Siddons et al. (Reference Siddons, Paradine, Beever and Cornell1985). Milk fat was determined by the Roese–Gottlieb method (Association of Official Analytical Chemists, AOAC, 2000) and total nitrogen (N) was determined by thermal conductivity (LECO model TruSpec v1.10 Nitrogen Determinator; LECO). Milk urea N was measured with a Technicon Analyzer (Technicon Instruments Corporation, Tarrytown, NY, USA). Volatile fatty acids in ruminal fluid were analysed according to Erwin et al. (Reference Erwin, Marco and Emery1961) by gas chromatography (Supelco Inc., Bellefonte, PA, USA). Ammonia N in rumen and digesta samples was determined by the indophenol-blue method (Novozamsky et al., Reference Novozamsky, van Eck, van Schouwenburg and Walinga1974).
A bacterial pellet was harvested from ruminal and duodenal formol-preserved samples and used as a reference for determining the ratio of purine to total N in bacteria. To obtain the bacterial pellet, samples were thawed and centrifuged at 200 × g (5 min); the supernatant was then centrifuged twice at 200 × g for 5 min. The bacterial fraction was then precipitated by centrifugation at 20 000 × g for 15 min, washed with physiological saline, pooled by day of collection then by period and centrifuged again at 20 000 × g for 15 min. The bacterial pellet was washed with ultra-pure water, re-centrifuged at 20 000 × g for 15 min, harvested and stored at −20°C. To facilitate chemical analysis, the pellets were lyophilised and ground with a mortar and pestle. Purine bases in bacteria and digesta were determined according to Zinn and Owens (Reference Zinn and Owens1986), using 2 mol/l HClO4 (Makkar and Becker, Reference Makkar and Becker1999) and the modified washing solution proposed by Aharoni and Tagari (Reference Aharoni and Tagari1991). An equimolar mixture of guanine and adenine was used as a standard for the analysis of purine bases (Obispo and Dehority, Reference Obispo and Dehority1999). Nitrogen content of bacteria was determined by thermal conductivity (LECO model TruSpec v1.10 Nitrogen Determinator, LECO). On the assumption that duodenal purine bases are derived from digested microbes, the flow (g/day) of microbial N was calculated by dividing the purine flow (g/day) by the purine-to-N ratio obtained from analysis of the reference bacterial pellet. Feed N duodenal flow (g/day) was calculated by the difference between non-ammonia N flow (g/day) and microbial N flow.
The concentrations of plasma Lys and of AA in feed and digesta were determined by the isotope dilution method of Calder et al. (Reference Calder, Garden, Anderson and Lobley1999). Plasma samples were deproteinised with sulphosalicylic acid (38%) and centrifuged at 27 768 × g for 10 min. To analyse AA concentration in proteins, samples of feed ingredients, total mixed ration and digesta were ground to pass a 0.5-mm screen. Samples were acid-hydrolysed with 6 mol/l phenol-HCl for 24 h at 110°C (AOAC, 2000). Then 2 g of the hydrolysate was diluted with 3 g of ultra-pure water; 1 g of this solution was then combined with a mixture (200 μg) of labelled AA (13C and 15N AA isotope standards, CDN Isotopes, Pointe–Claire, Que., Canada; Cambridge Isotope Laboratories Inc., Andover, MA, USA), which served as an internal standard (Raggio et al., Reference Raggio, Pacheco, Berthiaume, Lobley, Pellerin, Allard, Dubreuil and Lapierre2004). Samples of the deproteinised plasma and of the hydrolysates were eluted through a poly-prep chromatography column (Resin 100–200 mesh H, BIO RAD, Hercules, CA, USA) and derivatised with N-(tert-butyldimethylsilyl)-N-methyltrifluoroacetamide (MTBSTFA) and dimethylformamide (DMF) (394882, 27.0547 Sigma–Aldrich, Ontario, Canada) in a 1 : 1 ratio, according to the method of Calder and Smith (Reference Calder and Smith1988). Measurements of IE of [2–15N] Lys and of the AA in processed samples were performed using gas chromatography–mass spectrometry (GC–MS, Model CG6890-MS5973, Hewlett Packard Co., Wilmington, DE, USA).
Calculations of 15N flux
The measurement of lysine flux is based on the assumption that, for adult animals fed to requirements under steady-state conditions, additional supply of one non-limiting AA does not alter protein synthesis or retention (Harris et al., Reference Harris, Lee, Sinclair and Treolar1994) and therefore protein breakdown also remains unchanged. Then, based on equation (1) (Waterlow et al., Reference Waterlow, Garlick and Millward1978), variations in WB Lys net flux (Q) would reflect differences in absorbed Lys, hence differences in Lys availability among diets:

Calculations of WB net flux of Lys were based on the compartmental model of Shipley and Clark (Reference Shipley and Clark1972) and the plasma 15N Lys enrichment data. The compartments are used to model various components of the metabolic system and this requires certain physiological assumptions. The structure of the model is developed from the observed data and the number of exponential terms determines the number of compartments in the model. In the present study, the plasma 15N Lys enrichment data were subjected to non-linear regression analysis (Statistical Analysis Systems (SAS, 2001)) and both single and double exponential models were tested. The data best fitted (reduction of error sums of squares) the double exponential model (equation (2), below) of Shipley and Clark (Reference Shipley and Clark1972), and revealed the existence of two pools (Figure A1). It is assumed that one of these pools is plasma (A); the second one may be called unknown pool (B), to which plasma Lys flows and which could be hypothesised to be the intracellular or protein pool (Lobley, Reference Lobley1993). The mathematical analysis of the decay curve and Lys kinetics (flux) between compartments best describes differences in Lys availability between diets. A higher efflux from the plasma compartment means a higher pool size and therefore more bioavailable Lys.
IE was calculated as the ratio of tracer (labelled [2-15N] Lys) to tracee (unlabelled Lys). It was assumed that as a result of the steady state, the size of the pools remained constant and that the sum of inflows equalled the sum of outflows from the pool. It was also assumed that tracer and tracee molecules were handled similarly:

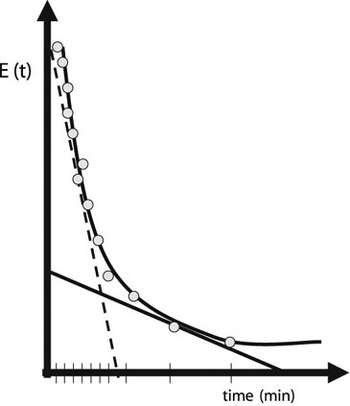
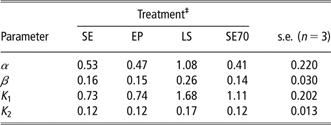
When the expression in equation (2) was plotted on a semi-log scale, it yielded two straight lines, where α and β correspond to IE at time = 0, and k 1 and k 2 correspond to the slopes for each line (Shipley and Clark, Reference Shipley and Clark1972; Figure A2). The WB Lys net flux was calculated using equation (3) (see below) based on parameters (α, β ,k 1 and k 2) of the enrichment curve (Shipley and Clark, Reference Shipley and Clark1972; Holtrop et al., Reference Holtrop, Lapierre and Lobley2004) in mmol/h and transformed to g/day:

Statistical analyses
To establish the ‘plasma Lys-response curve,’ the data were first analysed using the Proc Mixed procedure of SAS (2001), with cow (random), square, period and dose as main effects. Both the linear and quadratic effects of infusion dose were tested and the linear model was accepted. Based on this relationship, plasma concentrations of Lys measured in the main study were used (coordinate y) to predict values of post-ruminal available Lys (coordinate x). The inverse regression method described by Hansen et al. (Reference Hansen, Evans and Schultz1999) was used. The dose–response curve was previously corrected for period and cow effects.
All data from the experiment were analysed using the Proc Mixed procedure of SAS (2001), with cow (random), period and treatment as main effects. Least-squares means were estimated, and treatment differences were assessed using the following pre-planned contrasts: (1) SE v. EP and LS, (2) EP v. LS and (3) SE v. SE70. The criterion for declaring an effect to be statistically significant was pre-determined at P ⩽ 0.05. Probability values between 0.05 and 0.10 were considered as indicating a tendency.
Results and discussion
Diet composition and lactation performance
The ingredient and nutrient composition of the experimental diets are presented in Table 1, which shows that the diets were similar in fibre and protein content. As a result of the higher fat content of EP compared with SE and LS (Borucki Castro et al., Reference Borucki Castro, Phillip, Lapierre, Jardon and Berthiaume2007), inclusion of EP in the diet increased the fat content. The SBM products were allowed to make the dominant contribution to the dietary supply of protein and Lys (53% to 60% of dietary crude protein; 70% to 80% of dietary Lys) in order to increase the chances of discerning differences in Lys availability due to SBM treatment. Compared with the other diets, the LS diet contained less dietary AA, particularly Lys. The lower Lys content of the LS diet could be a consequence of irreversible crosslinkage reactions, which reduce the Lys concentration in feeds (Mauron, Reference Mauron1981; Gerrard, Reference Gerrard2002). Based on the AA model of NRC (2001), replacing SE with EP or LS would have increased the amount of digestible Lys by 21 and 29 g/day, respectively. These predicted increases in digestible lysine are consistent with results from our previous experiment, where the rumen protection of SBM increased Lys availability to the small intestine (Borucki Castro et al., Reference Borucki Castro, Phillip, Lapierre, Jardon and Berthiaume2007).
Feed intake and milk production were recorded in order to assess the health and welfare of the cows. Unacceptably large fluctuations in daily feed consumption by one cow resulted in the exclusion of this animal from the experiment. Statistical analyses performed on the remaining three cows revealed no effects (P > 0.10) of dietary treatment on feed intake, milk production or milk composition. The DM intake and milk production averaged 19.9 ± 0.25 and 26.6 ± 3.29 kg/day, respectively; estimates of milk protein and milk fat concentrations were 38 ± 2.4 and 34 ± 4.0 g/kg, respectively. The lack of treatment difference in milk and protein yields was expected because diets were fed to requirements according to NRC (2001) and formulated not to be limiting in Met or Lys.
Ruminal fermentation
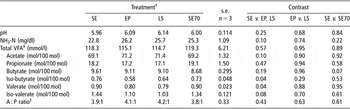
There were no differences (P > 0.10) in ruminal pH amongst treatments (Table 2); the average value for all treatments was 6.05. The inclusion of urea, designed to avoid restrictions on rumen microbial protein synthesis, tended to cause greater concentrations of ruminal NH3–N (P = 0.10) and significantly increased milk urea N (P < 0.01) in cows fed EP and LS compared to those fed SE. Estimates of milk urea N (mg/dl) were 18.3, 21.3 and 23.3 ± 0.97 for diets SE, EP and LS, respectively. The molar proportion of acetate tended to be greater in cows fed rumen-protected SBM products than in those fed the SE diet (P = 0.10), but ruminal propionate was not affected by treatment (P > 0.10). Ipharraguerre et al. (Reference Ipharraguerre, Clark and Freeman2005) also observed higher proportions of acetate, but they found lower proportions of propionate in the ruminal fluid of dairy cows fed EP or LS compared with SE.
Ruminal fermentation parameters in lactating dairy cows fed diets containing different soya-bean meal products

†SE = solvent-extracted soya-bean meal (SBM); EP = expeller-processed SBM; LS = lignosulphonate-treated SBM; SE70 = SE + omasal infusion of 70 g/day Lys.
‡Volatile fatty acids.
§A : P = acetate : propionate.
The concentrations of iso-acids (isobutyrate and isovalerate) and valerate tended to be greater (P < 0.10) with SE than with the rumen-protected SBM products (EP and LS). Similar observations were made in previous studies with dairy cows (Mansfield and Stern, Reference Mansfield and Stern1994; Ipharraguerre et al., Reference Ipharraguerre, Clark and Freeman2005). Iso-acids are the end products of oxidative deamination and decarboxylation of branched-chain AA (BCAA) (Allison, Reference Allison1978). This directly indicates a higher rate of ruminal degradation of BCAA with diet SE than with diets EP and LS, which suggests also a general increase in the ruminal degradation of protein.
Duodenal flow and digestibility of lysine and other EAA
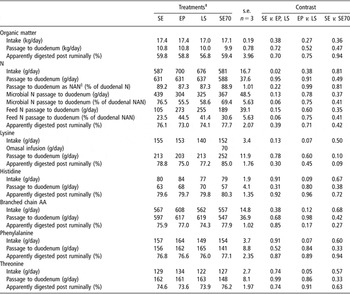
Table 3 summarises results of duodenal flow and post-ruminal digestion of organic matter (OM), N, Lys and selected EAA. As expected, there were no differences (P > 0.10) in OM intake amongst the diets. Digestion of OM was also similar (P > 0.10). Even under conditions of ad libitum feeding, OM digestion by lactating dairy cows was shown to be similar between SE and EP or LS (Mansfield and Stern, Reference Mansfield and Stern1994; Reynal and Broderick, Reference Reynal and Broderick2003; Ipharraguerre et al., Reference Ipharraguerre, Clark and Freeman2005). N intake was greater (P < 0.05) in cows fed treated SBM (EP, LS) than those fed SE; this was due to the fact that urea was included in the EP and LS diets.
Intake, flow and post-ruminal digestibility of organic matter, nitrogen (N), lysine and essential amino acids (AA)Footnote † in lactating dairy cows fed diets containing different soya-bean meal products

† Pre-oxidation of samples was not performed so methionine values are not presented.
‡ SE = solvent-extracted soya-bean meal (SBM); EP = expeller-processed SBM; LS = lignosulphonate-treated SBM; SE70 = SE + abomasal infusion of 70 g/day Lys.
§ Non–ammonia N.
Duodenal flows of total N and non-ammonia N were unaffected (P > 0.10) by dietary treatment. Based on studies with lactating dairy cows fed ad libitum, Ipharraguerre et al. (Reference Ipharraguerre, Clark and Freeman2005) reported that the duodenal flow of non-ammonia N was greater with LS than with SE; the differences were explained mainly by a higher intake of DM by cows fed the diet containing the LS. Table 3 also shows that duodenal flow of microbial N, as % of total non-ammonia N tended to be lower with EP and LS than with SE. Therefore, the proportion of feed N passing at duodenum tended to be higher (P < 0.10) for diets supplemented with treated SBM (EP and LS). However, given the numerically lower microbial supply for these diets (EP and LS), this higher passage of feed N (+20%) did not result in a higher duodenal supply of Lys, His, BCAA, Phe or Thr. Even though differences in duodenal flows of microbial N were not significant (P > 0.10), it can be suggested that the supplementation with urea N in diets EP and LS was not as efficient as a source of degradable N as were the AA-protein sources in SE to sustain microbial protein synthesis. According to Russell et al. (Reference Russell, O’Connor, Fox, Van Soest and Sniffen1992), pre-formed AA and peptides from true protein-degradable sources, such as SE, cannot be replaced solely by supplementation with non-protein N such as urea. Consequently, ruminal microbial protein synthesis could have been limited by a lack of ruminal AA and/or peptides. Reviews by Clark et al. (Reference Clark, Klusmeyer and Cameron1992) and by Santos et al. (Reference Santos, Santos, Theurer and Huber1998) suggest that a reduction in microbial protein flow could be anticipated with rumen-protected protein supplements. However, Reynal et al. (Reference Reynal, Broderick, Ahvenjarvi and Huhtanen2003) found no differences in the omasal flow of microbial AA-N between EP and SE. In a comparison of diets containing EP, LS or SE, Ipharraguerre et al. (Reference Ipharraguerre, Clark and Freeman2005) also found no differences in the duodenal flow of microbial N.
Estimates of post-ruminal digestion of protein were not different (P > 0.10) amongst the dietary treatments; the average value across diets was 75%. Studies conducted in situ, using the mobile bag technique, revealed no differences in post-ruminal digestion of the SE, EP or LS products (Borucki Castro et al., Reference Borucki Castro, Phillip, Lapierre, Jardon and Berthiaume2007). In vivo studies with dairy cows comparing respectively SE with heated SBM (Mabjeesh et al., Reference Mabjeesh, Arieli, Buckental, Zamwell and Tagari1996), EP (Ludden and Cecava, Reference Ludden and Cecava1995) or lignosulphonate SBM (Cleale et al., Reference Cleale, Britton, Klopfenstein, Bauer, Harmon and Satterlee1987; Mansfield and Stern, Reference Mansfield and Stern1994) have also shown no differences in the post-ruminal digestion of protein.
Omasal infusion of Lys (SE70) tended to increase the passage of Lys to the duodenum (P = 0.10). The amount of Lys infused was 70 g but the difference in duodenal Lys flow between SE and SE70 was +39 g (Table 3). Hence, only 56% of the omasally infused Lys was recovered at the duodenum. Studies by Matthews and Webb (Reference Matthews and Webb1995) and Rémond et al. (Reference Rémond, Bernard and Poncet2000) have suggested that free AA could be absorbed from the omasum, hence this could explain the low duodenal recovery of the Lys infused.
The intake of Lys and other EAA tended (P < 0.10) to be less with LS than with EP (Table 3) and this could be explained by the lower AA concentrations in the LS product (Borucki Castro et al., Reference Borucki Castro, Phillip, Lapierre, Jardon and Berthiaume2007). However, this did not affect (P > 0.15) the duodenal flow of Lys or other EAA. Based on the NRC model (2001), estimates of duodenal Lys flow should have been 21 and 29 g/day greater, respectively, for EP and LS when compared with SE. However, in the present study the actual differences in duodenal Lys flow were −10 and 0 g/day, respectively, for EP and LS diets when compared with SE. Since the duodenal flow of microbial N was numerically greater with the SE diet than with EP and LS (Table 3), microbial Lys flow to duodenum from this diet may have compensated for any reduction in duodenal Lys arising from the enhanced ruminal degradation of SE (Borucki Castro et al. Reference Borucki Castro, Phillip, Lapierre, Jardon and Berthiaume2007). Previous studies with lactating dairy cows have failed to show differences in the duodenal flow of Lys between SE and EP (Reynal et al. (Reference Reynal, Broderick, Ahvenjarvi and Huhtanen2003) or between SE and LS (Windschitl and Stern, Reference Windschitl and Stern1988). However, Ipharraguerre et al. (Reference Ipharraguerre, Clark and Freeman2005) reported an increase in the duodenal flow of non-microbial Lys when lactating dairy cows were fed with a diet in which EP or LS partially replaced SE. Based on a meta-analysis of published studies with lactating dairy cows, Ipharraguerre and Clark (Reference Ipharraguerre and Clark2005) observed a mean increase of 3.9% in the intestinal supply of Lys when diets were supplemented with rumen-protected SBM products. It would appear that supplementing the diets of lactating cows dairy with rumen-protected SBM products have minimal or no impact on the duodenal supply of Lys.
There were no differences in post-ruminal digestibility of Lys (Table 3) or in the daily supply of digestible Lys (P > 0.10; Table 4) between SE and the rumen-protected SBM products (EP, LS). The average value for post-ruminal digestibility of Lys was 77%. Other authors have reported values of 83% and 84% for the intestinal digestibility of Lys in diets containing SE (Windschitl and Stern, Reference Windschitl and Stern1988; Mabjeesh et al., Reference Mabjeesh, Arieli, Buckental, Zamwell and Tagari1996), and a value of 81% for diets containing LS (Windschitl and Stern, Reference Windschitl and Stern1988). The lack of differences in digestible Lys (Table 4) between untreated (SE) and treated (EP, LS) SBM products indicates that, under the conditions of this study, the treatment of SBM did not increase Lys availability.
Estimates of available lysine obtained by different methods in lactating dairy cows fed diets containing different soya-bean meal products

†SE = solvent-extracted soya-bean meal (SBM); EP = expeller-processed SBM; LS = lignosulphonate-treated SBM; SE70 = SE + omasal infusion of 70 g/day Lys.
‡[duodenal Lys flow × post-ruminal Lys digestibility].
§‘x’ value obtained based on the inverse regression of plasma response curve (Hansen et al., Reference Hansen, Evans and Schultz1999).
∥95% confidence interval.
¶WB Lys flux: whole-body Lys metabolic indicator based on decay curve after bolus dose 15N Lys.
Plasma lysine response
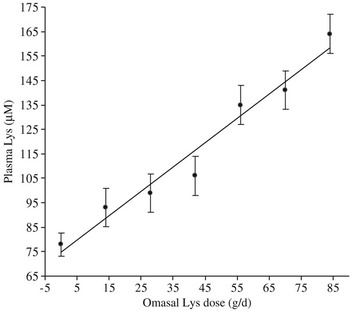
There was a linear relationship (P < 0.001; R 2 = 0.77) between omasal infusion of Lys (0 to 84 g/day) and its concentration in plasma (Figure 1). Lysine values on the x-axis (representing omasal infusion) can be equated with amounts of Lys available post-ruminally. The inverse regression method of Hansen et al. (Reference Hansen, Evans and Schultz1999) was then used to predict post-ruminal available Lys from the values for plasma Lys concentration (y-axis). The increments in post-ruminal Lys for diets EP, LS and SE70, relative to the SE diet, were estimated from the plasma Lys response curve. Results in Table 4 reveal no differences in post-ruminal increments of Lys with diets EP and LS. Plasma concentration of Lys was also similar (P > 0.10) for diets SE, EP and LS.
Plasma lysine response to omasal infusion of lysine in lactating dairy cows fed solvent extracted soya-bean meal.

A post-ruminal increment of 0 g of Lys was expected with diet SE because this was the diet used for the construction of the response curve. The diet SE resulted in an increment of +13 g of post-ruminal flows of Lys. This could be considered a limitation of the technique. This plasma-response approach was developed by Rulquin and Kowalczyk (Reference Rulquin and Kowalczyk2003) and has been found to provide reliable estimates of availability for Met but not for Lys. The reliability of the AA availability method of Rulquin and Kowalczyk (Reference Rulquin and Kowalczyk2003) depends largely on the responsiveness of plasma-AA to changes in AA intake and absorption. In a study with early-lactating dairy cows, King et al. (Reference King, Bergen, Sniffen, Grant, Grieve, King and Ames1991) reported a linear increase in plasma Lys (abdominal subcutaneous vein) in response to abomasal infusions of Lys (0 to 180 g/day). Working with mid-lactation dairy cows, Guinard and Rulquin (Reference Guinard and Rulquin1994) observed increases in arterial concentrations of Lys following duodenal infusions of Lys (0 to 63 g/day) but there was a plateau in plasma Lys at an infusion level of 50 g/day. In a recent meta-analysis of 10 studies, Raggio (2006) found that peripheral concentrations of Lys increased linearly with increased supply of digestible Lys. Compared with other EAA, there is very little hepatic extraction of Lys, and therefore, peripheral concentrations of plasma Lys may better reflect changes in its absorption (Lapierre et al., Reference Lapierre, Berthiaume, Raggio, Thivierge, Doepel, Pacheco, Dubreuil and Lobley2005). Consequently, the fact that the plasma-response approach did not detect changes in plasma or in duodenal increments of Lys may be a real indication of the lack of differences in Lys availability amongst SE, EP and LS. Treatment SE70, which served as a ‘quality control’, did result in a major increase in plasma Lys (P < 0.05; Table 4) and a significant increment in post-ruminal Lys of 68 g/day, almost equal to the infused dose.
Whole-body lysine flux
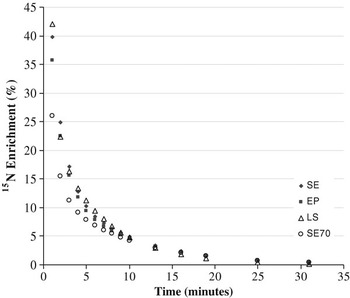
The WB Lys net flux was estimated from the decay curve of plasma 15N Lys enrichment (Figure 2 and Table A1). Results presented in Table 4 indicate that there were no significant differences (P > 0.10) in WB Lys flux amongst diets SE, EP and LS; the supplementation with different SBM products resulted in the similar availability of Lys. The lack of treatment effects on Lys availability obtained with the WB Lys flux method is consistent with the results obtained with the other two methods (Table 4). Consequently, irrespective of the experimental approach used, processing SBM to increase RUP supply did not alter the availability of Lys in lactating cows fed a maize silage-based diet.
Plasma 15N Lys enrichment for dairy cows fed different soya-bean meal (SBM) products (SE = solvent-extracted SBM; EP = expeller-processed SBM; LS = lignosulphonate-treated SBM; SE70 = SE + omasal infusion of 70 g/day Lys).

The present study was designed to optimise conditions to achieve a response in plasma Lys to changes in Lys absorption. Hence, the animals were fed continuously to ensure steady-state conditions, and plasma samples were collected to cover two feeding cycles. The WB Lys flux approach to estimate Lys availability relies on the assumption that WB protein degradation remained unchanged, and that the WB Lys flux is responsive to changes in intestinal supply and absorption of Lys. Cronjé et al. (Reference Cronjé, Nolan and Leng1992) reported an increase in Lys flux when sheep were fed a high-protein rather than a low-protein diet. In dairy cows, increased supply of metabolisable protein increased the WB net flux of leucine (Lapierre et al., Reference Lapierre, Blouin, Bernier, Reynolds, Dubreuil and Lobley2002), suggesting that the WB net flux of AA is responsive to changes in the intestinal AA supply. Indeed, in the present study, the omasal infusion of Lys (SE70) increased (P < 0.05) the Lys flux by approximately 70 g/day compared with the control diet (SE). Hence, as previously discussed, the Lys flux method could recover 100% of the expected difference between SE70 and SE, indicating no loss of the dose infused. Thus, the low duodenal recovery of Lys with diet SE70 would be related to absorption in the omasum (Matthews and Webb, Reference Matthews and Webb1995; Rémond et al., Reference Rémond, Bernard and Poncet2000).
This research represents the first report of the use of the WB Lys net flux method to determine Lys availability in dairy cows. The method proved to be sensitive and accurate based on a quality control treatment (SE70) and yielded results similar to the other methods utilised to determine Lys availability. The WB flux represents a relatively non-invasive approach of determining AA availability because it does not require the use of cannulated animals. Furthermore, the Lys flux approach links the intestinal supply of EAA to their metabolic usage. This is a useful direction for future research aimed at improving models of AA nutrition in dairy cattle.
Conclusion
The replacement of SE with different rumen-protected SBM products (EP and LS) in a maize silage-based diet resulted in no differences in the duodenal flow or post-ruminal digestion of OM, N and Lys in lactating cows. A reduction in microbial supply of Lys with treated SBM counterbalanced the higher duodenal supply of Lys derived from RUP. Three experimental approaches were used to quantify the availability of Lys in diets supplemented with different SBM products. Whether assessed based on digestible Lys, a plasma-response curve or with WB net flux of Lys, the study revealed no differences in Lys availability among diets. This is the first report of the use of 15N Lys flux to determine Lys availability in dairy cattle. The Lys flux approach not only links the intestinal supply of EAA to their metabolic usage but also it avoids the use of cannulated animals, thereby being more acceptable in the context of animal welfare.
Acknowledgements
The authors wish to thank Sylvie Provencher, Lisa Croteau and Mario Leonard for technical support, Jocelyne Renaud for AA analyses and Steve Methot for statistical advice and management of data. Financial support from West Central (Ralston, IA, USA) and Agriculture and Agri-Food Canada is gratefully acknowledged. Dairy and Swine Research and Development Centre contribution number 952.
Appendix
A schematic representation of the two-pool model used to represent whole-body lysine kinetics (Waterlow et al. Reference Waterlow, Garlick and Millward1978; Lobley Reference Lobley1993).

A schematic representation of the isotopic enrichment-E (%) clearance as a function of time (min) after the bolus injection. The decay curve is explained by: (1) a steep slope (dashed line) that means a rapid flux from plasma (mixing of tracer with blood in the extracellular pool); and (2) a less steep slope explained by a slower efflux from pool A to pool B (unknown, could be the intracellular pool or protein pool) (Shipley and Clark, Reference Shipley and Clark1972).

Mean values of parameter estimates obtained by fitting a model† of plasma enrichment in dairy cows fed diets containing different soya-bean meal products
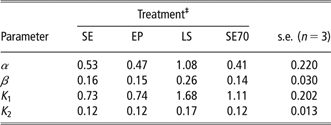
†Equation (2): Enrichment =  .
‡SE = solvent-extracted soya-bean meal (SBM); EP = expeller-processed SBM; LS = lignosulphonate-treated SBM; SE70 = SE + omasal infusion of 70 g/day Lys.