I. INTRODUCTION
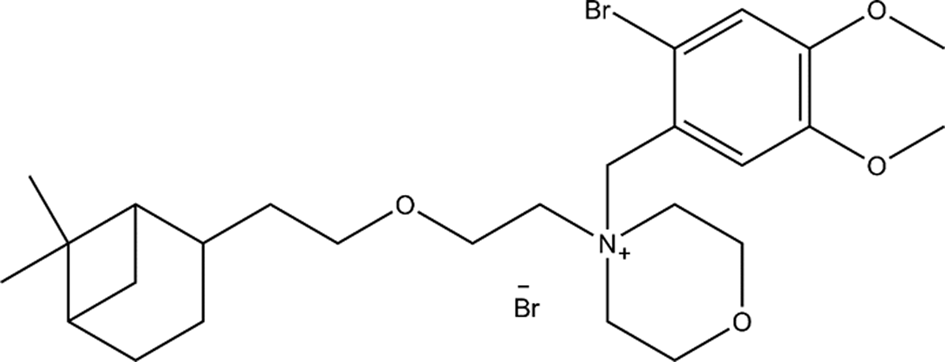
Pinaverium bromide (Figure 1), 4-[(2-Bromo-4,5-dimethoxyphenyl)methyl]-4-[2-[2-(6,6-dimethylbicyclo[3.1.1]-hept-2- yl)ethoxy]ethyl]morpholinium Bromide, (CAS 53251-94-8), is a non-anticholinergic musculotropic spasmolytic agent which has been used orally since 1977 in gastroenterological therapeutics. The compound acts by the inhibition of transmembrane calcium movements by blocking potential-dependent movements of calcium into the cell, an effect identical with that of verapamil (Guerot et al., Reference Guerot, Khemache, Sebbah and Noel1988). The drug causes infrequent, mild side effects and its effectiveness is partially attributed to low absorption and long residence time in the gastrointestinal (GI) tract (Christen, Reference Christen1990; Froguel et al., Reference Froguel, Chaussade, Roche, Fallet, Couturier and Guerre1990). Pinaverium bromide is globally marketed by dozens of manufacturers and over 20 brand and tradenames are known, including Blocafer, Delibs, Dicetel, Disten, Eldicet, Nulite, Pinaven, Spascolon, among others.
Molecular diagram of pinaverium bromide.

The major advantage of orally administered pinaverium bromide is that it does not cause adverse cardiovascular side-effects in doses that effectively relieve GI spasm/pain and abnormal motility (Christen and Tassignon, Reference Christen and Tassignon1989).
Currently, pinaverium bromide is used as treatment to the aforementioned ailments, but stability and dosage studies are still being carried out with different spectroscopic methods and liquid chromatography method in tablet formulation (Da Silva et al., Reference Da Silva, Mouzer, Coimbra, Rocha and Todeschini2017; Deodhe et al., Reference Deodhe, Dhabarde, Kamble and Mahapatra2017). For many years, X-ray powder analysis has been extensively used as an important tool in the characterization of new polymorphs, manufacturing effects on the structure of a material and to determine the crystal structure of the new phases. The goal of this work has been to characterize common active pharmaceutical ingredients (API) and evaluate the possible formation of polymorphs (Quintana et al., Reference Quintana, Toro, Blanco and Henao2016). The results of a study by FT-IR and Raman spectroscopy, thermal analysis (TGA-DSC), X-ray fluorescence and X-ray powder diffraction of this important API are presented in this study.
II. EXPERIMENTAL
A. Crystallization and density determination
To separate a commercial formulation containing pinaverium bromide (Dicetel 100 mg) from additive and amorphous phase, it was dissolved in distilled water. After filtering, an extraction was carried out with a 2:1:1 mixture of acetone:ethanol:water. The extract was crystallized by the solvothermal method using the 2:1:1 solvent mixture in an autoclave at 30 °C for 24 h. The density of several crystals was determined by the flotation method using mixtures of a saturated and diluted potassium iodide solution.
B. IR and Raman spectroscopy
The crystallized pinaverium bromide was mixed with KBr and formed into FT-IR pellets. The FT-IR spectra were recorded using a Thermo Scientific Nicolet iS 50 FT-IR spectrometer. Data were collected in the range 4000–400 cm−1, with 32 scans per sample and an optical speed of 0.4747 cm s−1. The Raman spectra were collected in a LabRam HR Evolution spectrophotometer using a 532 nm laser with 100% attenuation to 10 s and a 100× objective applying fluorescence correction in a range of 4000–200 cm−1.
C. Thermal analysis
Thermogravimetric analysis (TGA) and differential scanning calorimetry measurements (DSC) were performed in a Thermal Analyzer DTA/DSC Instrument Series Discovery. The sample was heated from room temperature to 500 °C, at a rate of 10 °C min−1, under a nitrogen atmosphere.
D. X-ray fluorescence
Quantitative analysis by X-ray fluorescence was performed using the program QUANT-EXPRESS, which uses a fundamental parameters method in the sodium (Na) to uranium (U) range, in a sequential wavelength dispersive X-rays fluorescence spectrometer BRUKER S8 TIGER. The spectrometer was equipped with a scintillation detector (heavy elements) and flow detector (light elements), a Rhodium (Rh) X-ray source tube, and a high precision goniometer for θ and 2θ angles.
E. X-ray powder diffraction data collection
Powder diffraction patterns were recorded at room temperature on a BRUKER D8 ADVANCE diffractometer working in the Bragg–Brentano geometry using CuKα radiation, operating at 40 kV and 40 mA. The patterns were recorded in steps of 0.02035° (2θ), from 4° to 60° at 1 s step−1. The diffractometer was equipped with primary and secondary Soller slits of 2.5°, a divergence slit of 0.6 mm, a Nickel filter of 0.02 mm, and a LynxEye detector.
PowderX program (Dong, Reference Dong1999) was used to remove the background (Sonneveld and Visser, Reference Sonneveld and Visser1975), smooth the data (Saviztky and Golay, Reference Saviztky and Golay1964), to eliminate the Kα 2 component (Rachinger, Reference Rachinger1948), and the second derivative method was used to determine the peak observed positions and intensities.
III. RESULTS AND DISCUSSION
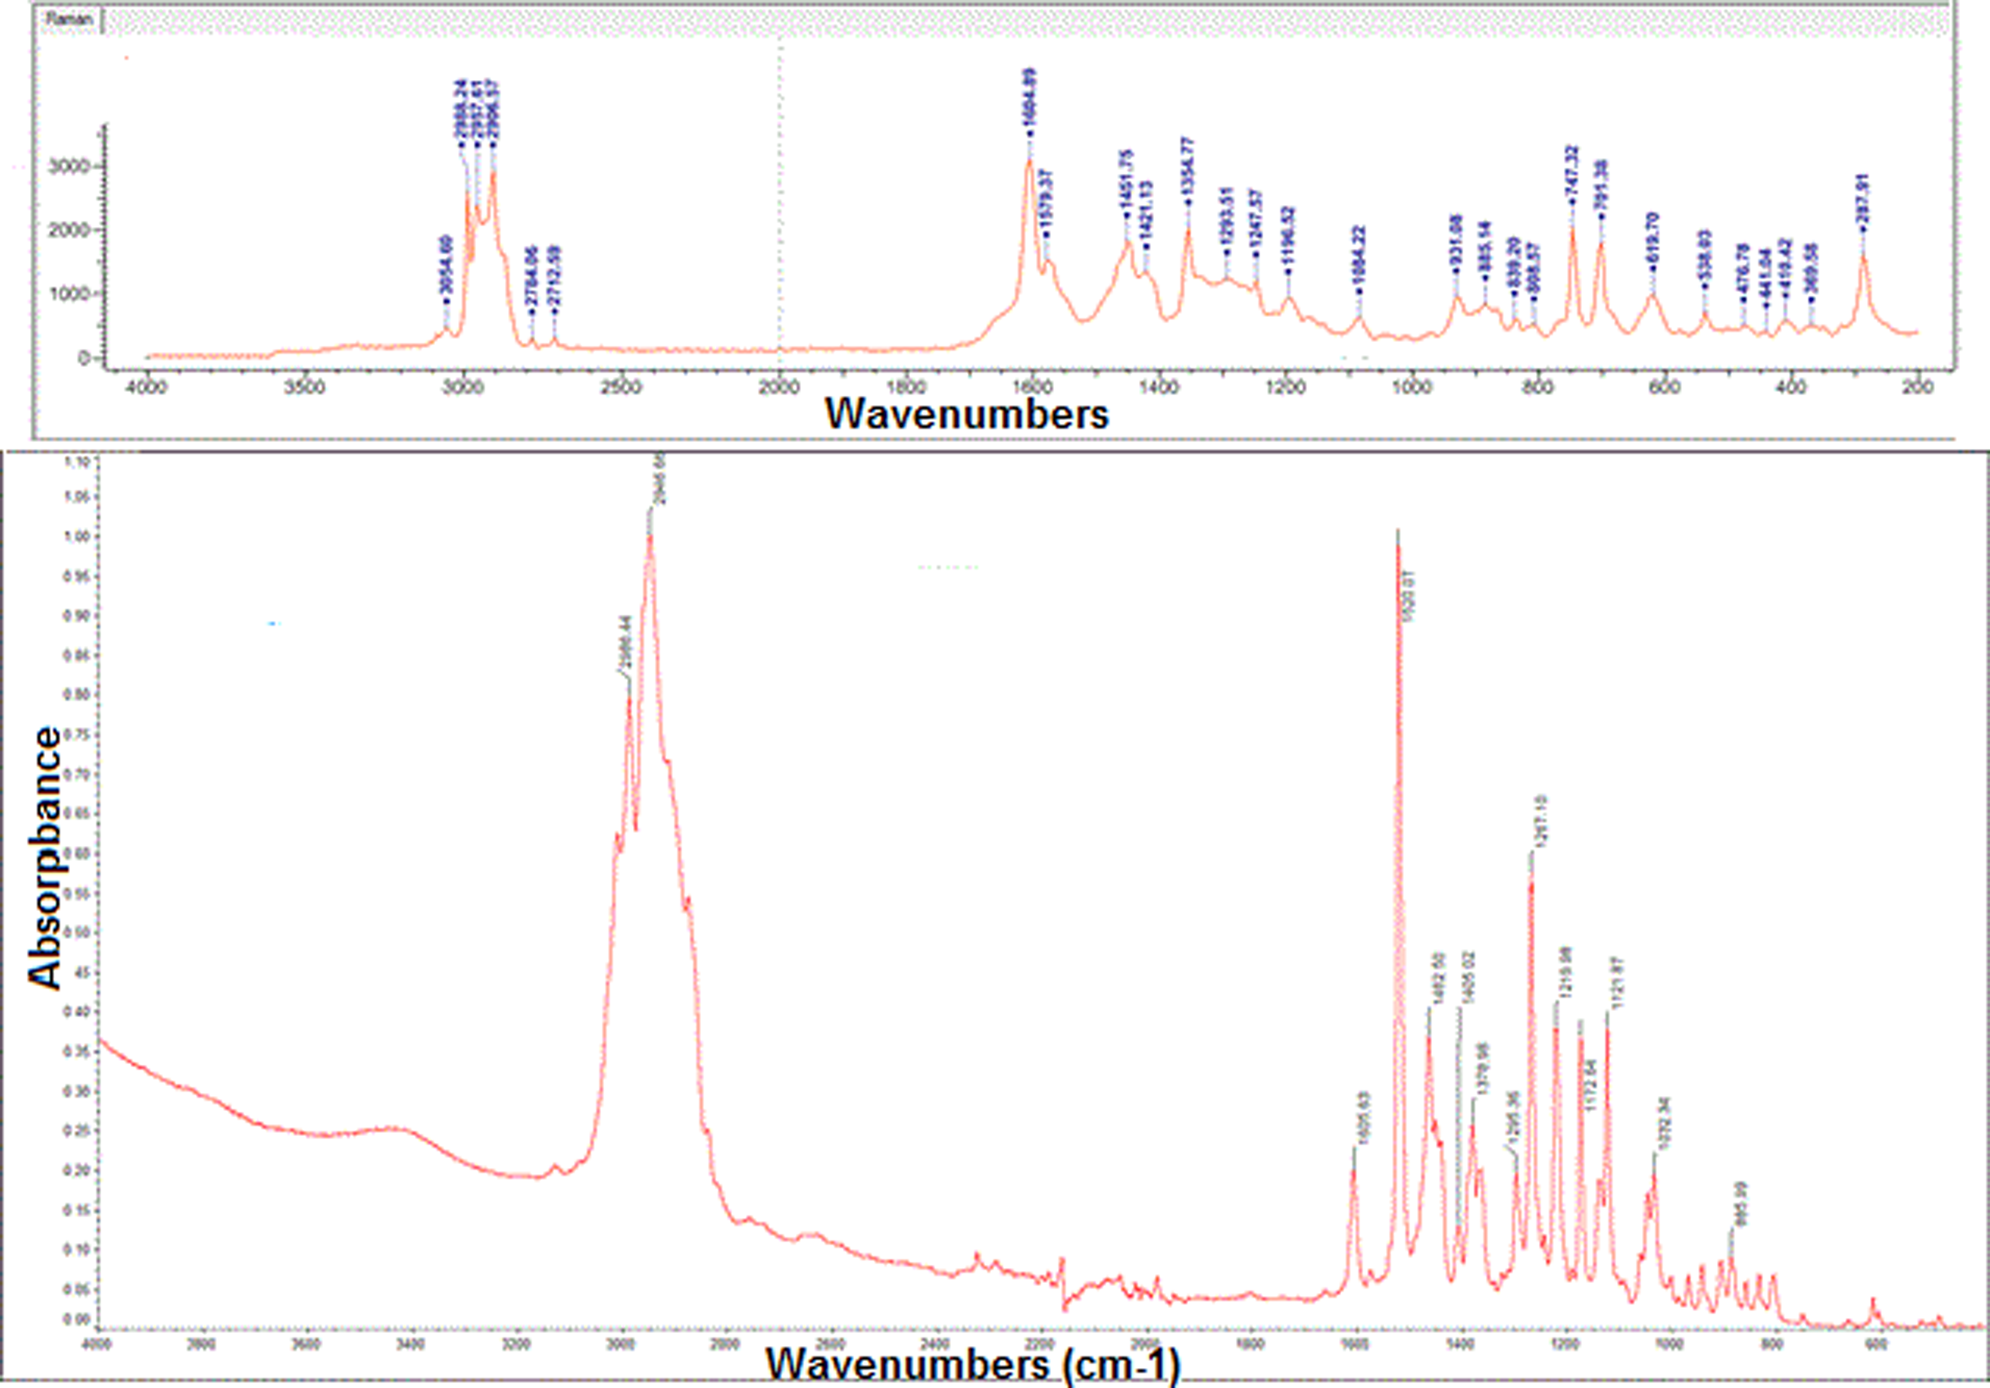
Colorless prisms were crystallized by the solvothermal method. The FT-IR spectrum (Figure 2) clearly shows the chemical nature of the compound. The bands corresponding to the C–H stretching appear at 2996–2946 cm−1 and the C=C (aromatic) stretching at 1605 cm−1. The absorption band C–O–C is observed at 1219 cm−1. The C–N+ stretching appears at 1219 cm−1 and the vibration bands C–Br are observed 701 and 885 cm−1. In the Raman spectrum of Figure 2, the bands corresponding to the vibration =C–H and C–H appear at 3054 and 2906–2988 cm−1, respectively. The vibration band of aromatic carbon is observed at 1604 cm−1. Asymmetric tension bonds, C–O–C, appear at 1084 cm−1 while their symmetrical counterpart are observed in the range of 808–885 cm−1.
IR spectrum (below) and Raman spectrum (top) of pinaverium bromide.

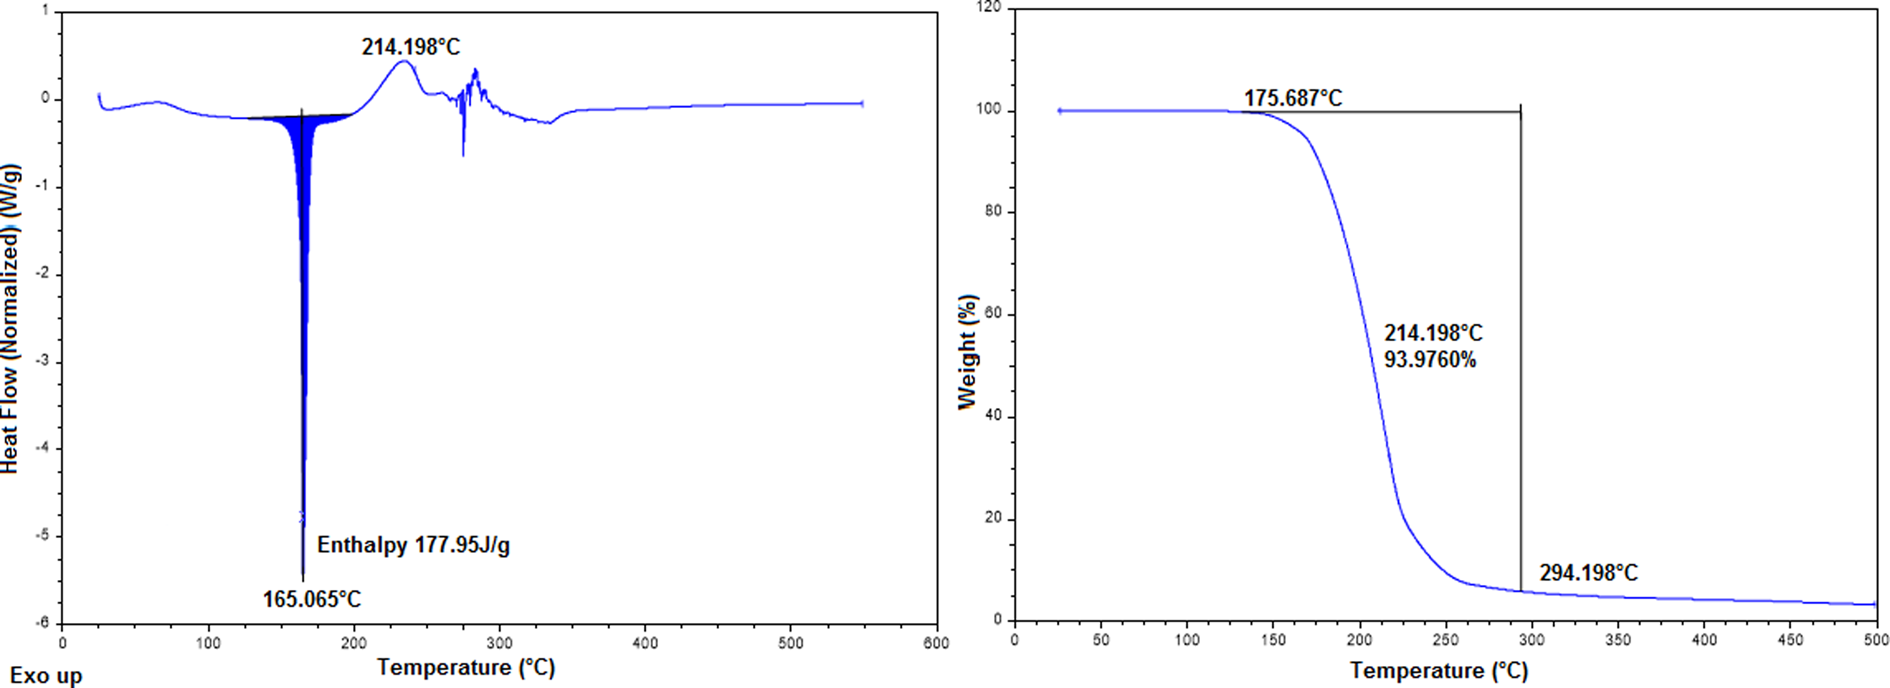
The DSC shows an endotherm at about 165.065 °C with 177.95 J g−1 associated with melting because the TGA curve does not show a mass loss in this range. According to the TGA curve, the compound decomposes in the temperature range of 175.687–214.198 °C. This decomposition was correlated with an exotherm, which showed a peak temperature of 214 °C in the DSC (Figure 3).
DSC curve (left) and TGA curve (right) of pinaverium bromide.

The fluorescence analysis was conducted to identify the bromine atom in the pinaverium bromide. Computer software could not define the concentration of bromine from the Kα or Kβ line, due to the high concentration of organic material in relation to the concentration of bromine observed in the spectrum. Therefore, data were calculated from a theoretical concentration of 72.96% organic material and the analysis was performed from the Lα line, which is accurate and the analysis converged to better results. The obtained value of 27.04% matches the expected concentration of Br, indicative of the chemical nature of the extracted material.
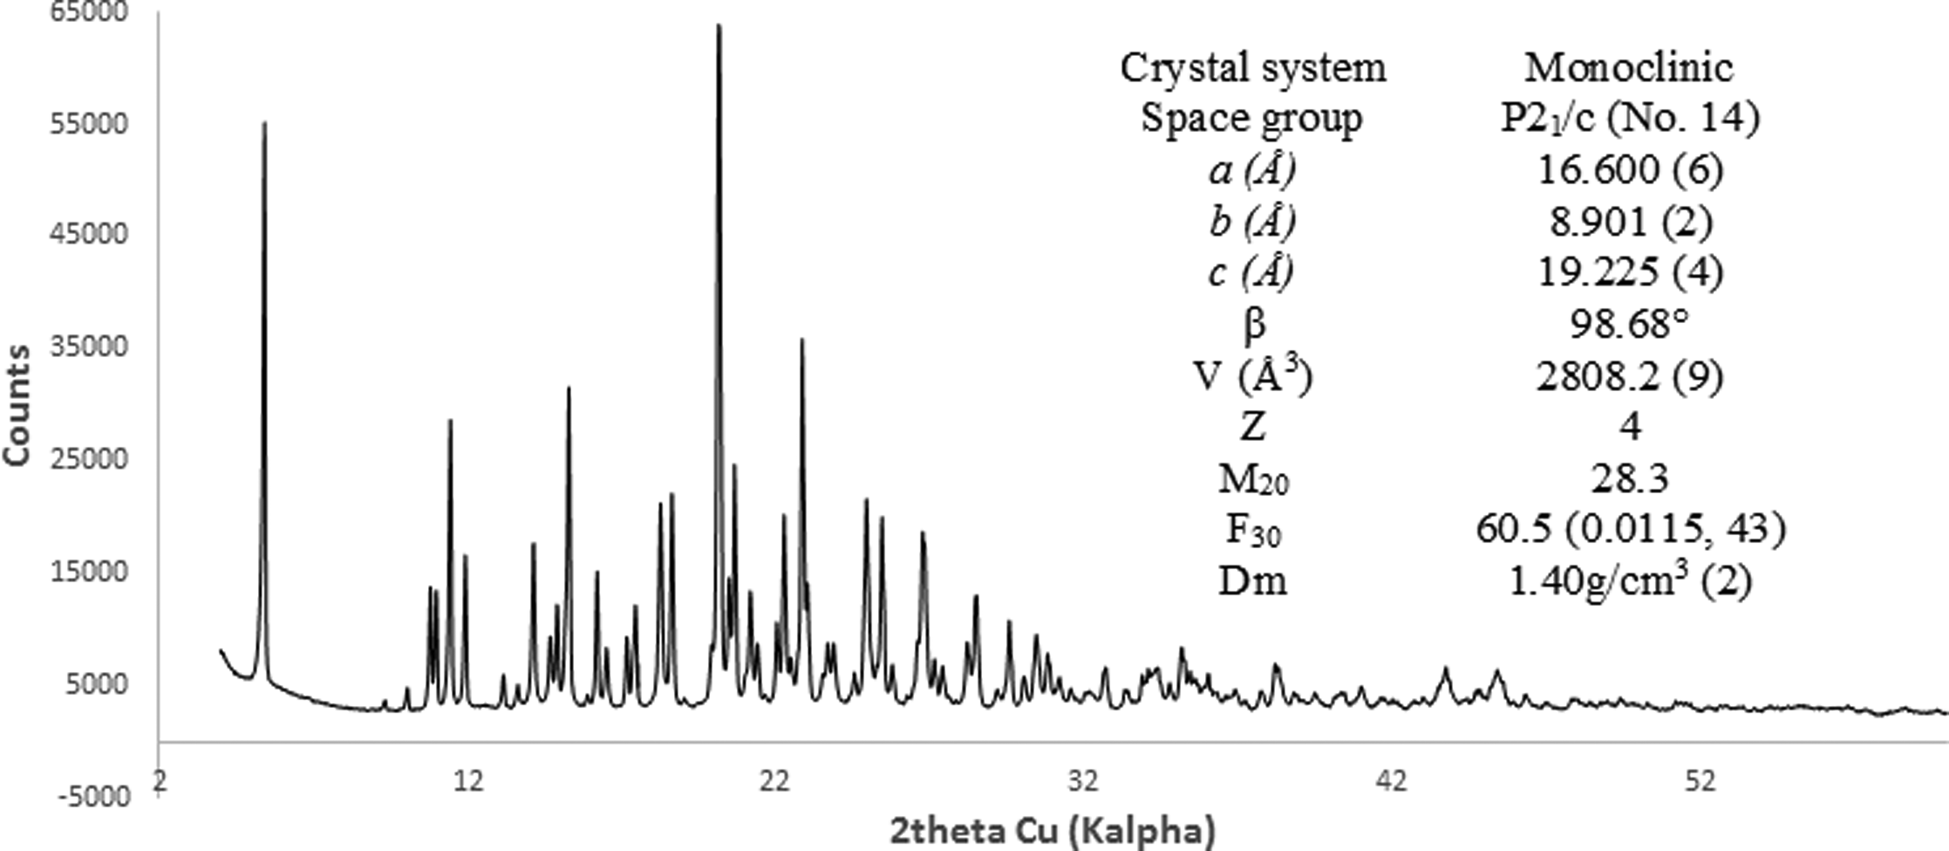
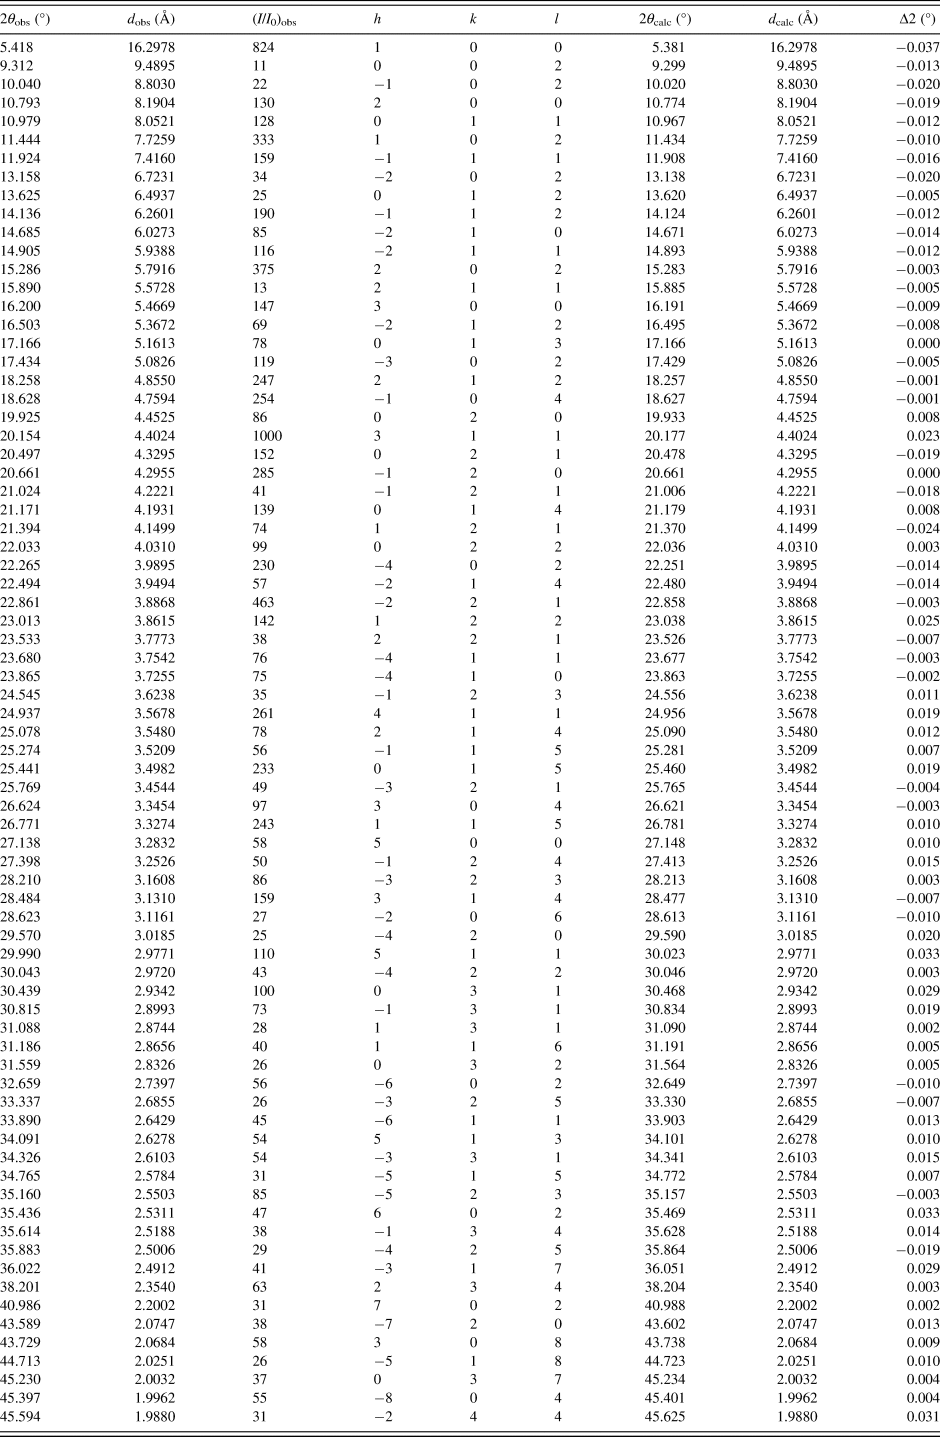
Indexing of the powder diffraction pattern (Figure 4) carried out with DICVOL14 (Boultif and Loüer, Reference Boultif and Loüer2014) and the analysis of 128 diffraction maxima recorded, performed with NSB*AIDS83 (Mighell et al., Reference Mighell, Hubbard and Stalick1981), led to a monoclinic unit cell P21/c (No. 14) with a = 16.600(4) Å, b = 8.901(2) Å, c = 19.225 (4) Å, β = 98.68 (3)°, and V = 2808.2 (9) Å3. The space group compatible with the systematic absences was estimated by the CHECKCELL program (Laugier and Bochu, Reference Laugier and Bochu2002). The de Wolf (Reference de Wolff1968) and Smith–Snyder (Smith and Snyder, Reference Smith and Snyder1979) figures of merit obtained were M 20 = 28.3 and F 30 = 60.5 (0.0115, 43), respectively. Table I contains the corresponding powder diffraction data, (I/I 0)obs values (peak heights) were normalized to 1000. The fitting of the whole pattern with the Le Bail algorithm implemented in FULLPROF (Rodriguez-Carvajal, Reference Rodriguez-Carvajal1990), accounts for all the diffraction maxima recorded.
X-ray powder diffraction pattern of pinaverium bromide.

X-ray powder diffraction data of pinaverium bromide (the CuKa 1 = 1,54056° wavelength used to convert 2θ obs to d obs).

The value of Z = 4 was estimated from the density obtained by the flotation method (ρ = 1.40(1) g cm−3), and the calculated density was 1.39 g cm−3.
IV. DATA DEPOSITION
CIF and/or RAW data files were deposited with ICDD. You may request this data from ICDD at info@icdd.com.
ACKNOWLEDGEMENTS
We thank Vicerrectoría de Investigación y Extensión, Universidad Industrial de Santander (UIS), and Parque Tecnológico Guatiguará, UIS, Piedecuesta, Santander, Colombia, Laboratorio de Investigación en Polímeros for the TGA-DSC data and the Laboratorio de Espectroscopia for FT-IR and Raman spectra measurements and Laboratorio de Difracción de Rayos-X, for recording X-ray fluorescence and X-ray diffraction data.