Introduction
The achievement of p-type epitaxial GaN by Mg doping is of interest for device applications. In addition, the nature of most of the basic luminescence recombination mechanisms in Nitride-based material systems and they dependence on material properties are still subject of discussion. Yellow luminescence in undoped or n-type GaN is supposed to be due to a transition between a shallow donor and a deep acceptor level located at about 1 eV above the VB [Reference Ogino and Aoki1,Reference Hofmann, Kovalev, Steude, Meyer, Hoffmann, Eckey, Heitz, Detchprom, Amano and Akasaki2] due to a complex defect involving VGa [Reference Neugebauer and Van de Walle3]. P-type GaN doped with Mg is supposed not to show YL due to the increase of the formation energy of Ga vacancies in semi-insulating or p-type GaN [Reference Neugebauer and Van de Walle3,Reference Van de Walle, Stampfl and Neugebauer4] and due to the compensation of VGa by Mg atoms [Reference Kim, Salvador, Botchkarev, Aktas, Mohammad and Morkoç5-Reference Nakamura, Mukai, Senoh and Iwasa7]. Nevertheless, YL in Mg doped GaN has been observed, but only in n-type layers [Reference Sanchez, Calle, Basak, Tijero, Sanchez-Garcia, Monroy, Calleja, Muñoz, Beaumont, Gibart, Serrano and Blanco8]. In this work a broad YL band is found in p-type Mg doped GaN layers grown by molecular beam epitaxy (MBE). The optical transitions and the structural properties of the layers are discussed on the basis of low temperature Spectral Cathodoluminescence (SCL) results in the Scanning Electron Microscope (SEM) and Transmission Electron Microscopy (TEM) respectively. Taking advantage of the special growth technique used, the results are discussed suggesting a different mechanism could be responsible for the YL in p-type GaN with respect to that acting in n-type GaN.
Experimental Details
P-type GaN layers doped with Mg concentrations ranging from 1019 to 1021 cm−3 have been grown by MBE under N rich conditions by using On-Surface Cracking ammonia [Reference Kamp, Mayer, Pelzmann and Ebeling9]. Mg-doping was performed using either evaporation of Mg atoms from a conventional effusion cell or the metal organic precursor MCp2Mg (methyl-cyclo-pentadienyl-magnesium) which is for the first time ever used in GaN MBE. Probe and rectification methods, I-V characteristics and Hall effect measurements have verified p-type carrier concentrations below 5×1017 cm−3. The concentration and depth distribution of Mg atoms have been investigated by secondary ion mass spectroscopy (SIMS) analyses.
The optical emission of the samples has been studied by SCL performed in a commercial Oxford MONOCL system, equipped with a multialkaly photomultiplier, fitted to a 360 Cambridge SEM. The temperature range was between 5 and 300 K. The cathodoluminescence was also performed spatially as well as spectrally resolved. The structure of the epilayers has been studied by conventional TEM in a Philips CM 300UT operating a 300 keV. Cross sectional and plan view TEM samples have been prepared by standard techniques including mechanical grinding and polishing with diamond coated polymer foils followed by ion milling.
Results and Discussion
Figure 1a shows a TEM plan view image of the sample with the highest Mg content. A typical TEM cross section of one of the samples studied is reported in Figure 1b. In all the samples dislocations and Stacking Faults were found, in addition to the cubic phase. Figure 2 shows a comparison between CL spectra from undoped and Mg doped GaN samples (1019 cm−3<Mg concentration< 1021 cm−3). In addition to the Near Band Edge (NBE) emission at about 3.44 eV, to the peak at about 3.27 eV, related to the Mg shallow acceptor at about 170-190 meV above the VB (see for instance [Reference Leroux, Grandjean, Beaumont, Nataf, Semond, Massies and Gibart10] and references therein enclosed), a strong emission ascribed to a cubic phase, as found by TEM analyses, is shown at about 3.2 eV.
a) Bright field (0001) multi beam conditions TEM plan view image of the sample with the highest Mg concentration; b) Weak beam g=0001 TEM micrograph in cross section of one of the samples studied. The usual dislocation distribution is shown.

-Comparison between CL spectra from undoped and Mg doped GaN samples

The most interesting feature in Figure 2 concernes the broad emission centered at about 2.2 eV. This peak is not present in the less doped material and is preeminent together with another band at about 2.8 eV in the heavily doped sample. Note the presence of the YL in the undoped layer as was expected.
In the following we will discuss the onset of the YL in the most doped sample. The yellow band is present in undoped GaN due to the presence of VGa as suggested by other authors (see for instance ref [Reference Neugebauer and Van de Walle3]). In Mg doped samples, Mg atoms compensate the VGa [Reference Van de Walle, Stampfl and Neugebauer4] and therefore the 2.2 eV emission decreases even if it does not disappear completely probably because of the incomplete compensation of Ga vacancies at low Mg doping. By increasing the Mg concentration, two different peaks are found. The emission at 2.8 eV can be understood as being due to a transition involving a MgGa-VN complexes as reported by other authors [Reference Lim, Schineller, Schon, Heime and Heuken11-Reference Oh, Park and Park14].
The nature of the broad band centered at about 2.2 eV has been investigated by studying its behaviour as a function of the injection conditions and temperature. Deconvolution procedures revealed the presence of at least three superimposed gaussians peaks at about 2.05, 2.2 and 2.35 eV.
The 2.35 eV peak could be due to the presence of C as a contaminant in the MBE growth. By studying the temperature evolution of the 2.2 and 2.35 eV peaks from 20 to 300 K energy red-shifts of about 50 meV and 35 meV have been found respectively. By plotting the CL intensity of the 2.2 eV peak as a function of the beam energy (Eb) at constant injection conditions, the total intensity is observed to increase up to Eb=25 keV, corresponding to a depth through the sample of about 900 nm and then the CL signal saturates. The CL intensity of the 2.35 eV peak does not saturate until Eb=40 keV, corresponding to a depth of about 1.8 μm.
The comparison with Figure 3, where the SIMS profile of the Mg distribution in the same sample is reported, suggests that the emission at 2.2 eV is correlated with the Mg doping.
-SIMS profile of the Mg distribution in comparison with the component elements of the GaN layer (Gallium and Nitrogen).

By increasing the excitation power, an energy blue-shift of about 15 meV has been observed; this is consistent with the hypothesis that shallow levels are involved in this transition which is supposed to be of donor acceptor pair (DAP) type [Reference Pavesi and Guzzi15,Reference Dean16].
In the following a possible origin of the YL in p-type GaN is discussed on the basis of a different mechanism with respect to that acting in undoped or n-type GaN. A superior incorporation of Mg at the Ga-substitutional site (MgGa), which is the preferred site in the bulk, is expected under N-rich growth conditions as in our case [Reference Bungaro, Rapcewiz and Bernholc17].
It is known from the literature that this dopant induces a shallow acceptor level at about 200 meV above the VB [Reference Leroux, Grandjean, Beaumont, Nataf, Semond, Massies and Gibart10]. According to Tansley et al [Reference Tansley and Egan18], a deep donor level at about 0.8-1.1 eV below the CB has been ascribed to the NGa defect. Furthermore, Suski et al. [Reference Suski, Perlin, Teisseyre, Leszczynski, Grzegory, Jun and Bockowski19] have considered deep double donor gap state caused by NGa as responsible for the well known YL in n-type GaN. The formation energy for the NGa defect under thermodynamic equilibrium conditions is considerably high [Reference Neugebauer and Van de Walle20] almost independently on the Fermi energy. However, since in our case the samples have been grown far from the thermodynamic equilibrium and possibly with a consistent influence of growth kinetics and because of the high Mg concentration, it is not straighforward to correlate the formation of native defects in the frame of the thermodynamical equilibrium theory. Therefore, a transition between the native defect NGa and a shallow acceptor due to MgGa could be considered at the origin of the 2.2 eV peak in our samples. The Arrhenius plot of Figure 4 reports the inverse of the CL integrated intensity of the 2.2 eV emission as a function of temperature: an activation energy of about 140±30 meV is found. Within the experimental error this value is much closer to the activation energy of 170-190 meV for the shallow acceptor due to the MgGa rather then that of 30 meV typical for shallow donors as found in undoped or n-type GaN.
a) Sketch of the possible transition in the heavily Mg doped sample. b) The Arrhenius plot of the inverse of the CL integrated intensity of the 2.2 eV emission as a function of temperature.

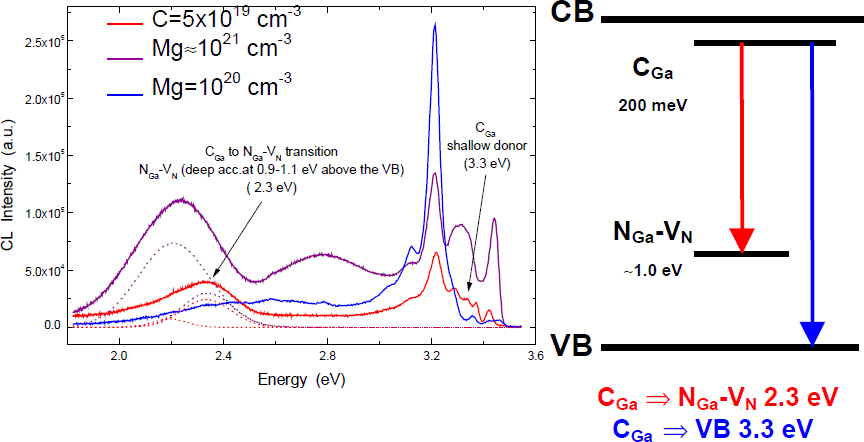
To support our hypothesis, in the following we will discuss the influence of C on the optical transitions of our samples. PL investigations on GaN layers intentionally doped with C [Reference Reuter, Zhang, Kuech and Bishop21] revealed the presence of an optical emission at about 2.35 eV.
Figure 5 reports a comparison between the sample doped with the highest Mg concentration and another sample with a C concentration of 5×1019 cm−3 as found by SIMS analyses. On the low energy side of the spectrum, a predominant transition at 2.35 eV is shown
a) Comparison between the samples doped with the highest and the lowest Mg concentration and the sample with high C concentration; b) Sketch of the possibles transitions in the heavily C contaminated sample.

It is known from the literature [Reference Boguslawski, Briggs and Bernholc22] that the CGa defect is favoured in p-type GaN samples. It is therefore reasonable to expect that C competes against Mg as a substitutional impurity. In this respect the emission at 2.35 eV can be ascribed to a transition between a shallow donor at about 200 meV below the CB, due to the CGa substitutional defect, and a deep acceptor level at about 1 eV above the VB due to the complex NGa-VN, which is known to be favoured in p-type GaN [Reference Chadi23]. The most striking feature of the spectra in Figure 8 is the disappearance of the 2.8 eV band and the consequent strong reduction of the CL integrated intensity of the 2.2 eV band. The 2.8 eV band disappears because of the increased formation energy of the MgGa-VN complex [Reference Chang13] induced by the Fermi level energy shift due to the reduced concentration of Mg atoms in samples with high C concentration grown under N-rich conditions and the complex VN-NGa is favoured [Reference Chadi23]. As a consequence, the NGa antisite defect cannot contribute to the 2.2 eV emission as in Mg doped samples with low C concentration. It is clear that further investigations must be carried out in order to clarify the correlation between the formation energy of the NGa defect and the Fermi level energy position in p-type GaN.
Conclusions
Yellow luminescence has been studied in GaN:Mg doped with Mg concentrations ranging from 1019 to 1021 cm−3 by spectral CL (T=5K) and TEM and explained by suggesting that a different mechanism could be responsible for the YL in p-type GaN with respect to that acting in n-type GaN.
Transitions at 2.2, 2.8, 3.21, 3.27, and 3.46 eV were found. The 2.8 eV transition was correlated with a deep level at 600 meV below the CB due to MgGa-VN complexes; the 3.27 eV emission was ascribed to a shallow acceptor at about 170-190 meV above the VB due to MgGa.
The 2.2 eV yellow band, not present in low Mg doped samples, increased by increasing the Mg concentration. It was ascribed to a transition between a deep donor level at 0.8-1.1 eV below the CB edge due to NGa and the shallow acceptor due to MgGa. This assumption was checked by studying the role of C in the Mg compensation. CL spectra from a sample with high C concentration showed transitions between a C-related 200 meV shallow donor and a deep acceptor level at about 0.9-1.1 eV below the CB due to a NGa-VN complex.