Introduction
Soil properties differ greatly in their small-scale distribution. This heterogeneity requires an adjusted site-specific management on field-scale to avoid wasting resources, environmental pollution and decreasing soil fertility. For example, unadjusted nitrogen fertilization in terms of application time and site-specific capacity of the soils, mainly contributes to the global input of reactive nitrogen to terrestrial ecosystems, drainage waters and the atmosphere (Galloway et al., Reference Galloway, Aber, Erisman, Seitzinger, Howarth, Cowling and Cosby2003; Liu et al., Reference Liu, You, Amini, Obersteiner, Herrero, Zehnder and Yang2010; Fowler et al., Reference Fowler, Coyle, Skiba, Sutton, Cape and Reis2013). Whereas the spatial variability of soils and crop yields basically contributed to the development of site-specific farming activities, a precise detection of soil parameters and their spatial distribution on field level is still limited (Adamchuk et al., Reference Adamchuk, Hummel, Morgan and Upadhyaya2004; Schmidhalter et al., Reference Schmidhalter, Maidel, Heuwinkel, Demmel, Auernhammer, Noack and Rothmund2008; Geesing et al., Reference Geesing, Diacono and Schmidhalter2014). Process-oriented crop models like HERMES are able to derive spatially highly resolved state variables but the quality of site-specific model output strongly depends on the quality of required input values (Kersebaum, Reference Kersebaum2007). As conventional soil investigation is expensive and time-consuming, different sensor systems are calibrated and tested in the project network Intelligence for Soil (I4S), funded within the national programme BonaRes. The current focus of the project is on basic research and development of potentiometric sensors for pH, nitrate and potassium, and spectrometric sensors for quasi stable soil parameters as texture and organic carbon, respectively (Gebbers et al., Reference Gebbers, Dworak, Mahns, Weltzien, Büchele and Gornushkin2016). The overall prospective is to provide highly resolved soil information from sensor observations driving the models and state variables to actualize simulated states. One established sensor measurement is the electrical conductivity (ECa), which is related to a few soil parameters like clay, organic carbon, phosphorus and water content, respectively (Johnson et al., Reference Johnson, Eskridge and Corwin2005; Kravchenko et al., Reference Kravchenko, Harrigan and Bailey2005; Tarr et al., Reference Tarr, Moore, Bullock, Dixon and Burras2005; Brevik, Reference Brevik2012; Lawes and Bramley, Reference Lawes and Bramley2012; Rudolph et al., Reference Rudolph, van der Kruk, von Hebel, Ali, Herbst, Montzka, Pätzold, Robinson, Vereecken and Weihermüller2015). But results are strongly restricted to the regional soil inventory as relationships differ with soil type. Main objectives of the present study are to examine the relation of ECa values and initial soil parameters in order to simulate states with a high spatial resolution, and to investigate if we achieve an improvement of spatial patterns by this upscaling procedure.
Materials and methods
Site description and spatial data
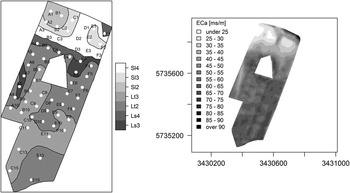
The study site was a 20-ha field located in the Northwest of Germany in Beckum, North Rhine-Westphalia (51.750096°N, 7.993412°E) and was extensively described in Kersebaum et al. (Reference Kersebaum, Lorenz, Reuter, Schwarz, Wegehenkel and Wendroth2005). The most important characteristic for the present research is the high spatial variability of soil texture, reaching from slightly loamy sand in the north to silty and clayey loam in the southern part (figure 1). Soil sampling was conducted for three soil layers - 0 to 30, 30 to 60 and 60 to 90 cm, respectively - at 60 points in a regular grid of 50 to 50 m, but with a maximum distance of 100 m in the south due to underlying calcareous marl reaching the root zone. In addition, two further sampling areas in a nested design, each containing of ten grid points, were defined in the northern part of the study site. In total, assignment of sensor values became possible for 80 soil sampling points. During investigation period from 1999 to 2002 recurrent sampling of each soil layer at every sampling point was realized to determine nitrogen supply and soil water content. Annual yields were measured on the go during harvest.
Spatial pattern of texture classes averaged for soil layer 0 to 90 cm (after German classification: AG Boden, 1994) derived from 60 soil sampling points (A1 to F10) at the study site (left) and pattern of interpolated ECa values (right), respectively.

Modelling and model validation
The selected simulation model HERMES was originally developed for practical purposes and, hence, implies relative simple assumptions described in detail in Kersebaum and Richter (Reference Kersebaum and Richter1991), Kersebaum (Reference Kersebaum1995) and Kersebaum (Reference Kersebaum2007). Soil organic matter is separated into an easily and slowly decomposable pool considering subsequent nitrogen delivery. Nitrogen inputs are deposition and fertilization, while the sinks are plant uptake, denitrification and leaching. Soil water dynamics are simulated capacity based and capacity parameters depend on soil texture information. The model assumes that the simulated agroecosystem can be represented in a one dimensional model. For model validation we calculated the root mean square error (RMSE) for each year over all 60 simulations and visually estimated the fit of observed and simulated yields, water and mineral nitrogen contents in soil for each grid point.
Sensor-model connection
Mapping of apparent electrical conductivity (ECa) was executed after harvest in 1999 with the sensor EM38 in the vertical mode and an electrode spacing of 4 m, which was determined after measuring ECa along a reference line with varying settings. Sample size amounted to 5,760 mapping points. Value range and spatial interpolation of ECa mapping is shown in figure 1. After assignment of ECa values to the total of 80 grid points at the described field, we tried to derive input variables driving the models and/or state variables from this particular sensor observations. In order to improve the resolution of spatial patterns relevant for site specific management strategies (e.g. nitrogen efficiency, water availability at certain dates) the models were initialized with the derived information and simulation was conducted for each point of ECa mapping. Improvement of spatial patterns by upscaling soil texture information was examined visually.
Spatial analysis and statistics
For spatial analysis and statistical evaluation of the present data as well as for visualization of the achieved results we used the software R (Core Team R, 2014). Interpolation of punctual information was conducted by the ordinary kriging method implemented in the R package gstat (Pebesma, Reference Pebesma2004). Depending on the spatial distribution and density of sampling points and ECa measurements, respectively, we determined the range parameter to be 150 m in any case. The variogram model type was examined for each interpolation separately. Merging spatial information from different scales we realized by using the corresponding functions of package sp (Pebesma and Bivand, Reference Pebesma and Bivand2005; Bivand et al., Reference Bivand, Pebesma and Gomez-Rubio2013). Mapping of different spatial patterns was conducted by the use of package maptools (Bivand and Lewin-Koh, Reference Bivand and Lewin-Koh2016). The applied regression analysis and diagnostic investigation of the regression we conducted with the packages stats (Core Team R, 2014) and MASS (Venables and Ripley, Reference Venables and Ripley2002). Thereby we intended a normal distribution of the residuals of the particular regression model due to the fact, that the range of observed values is restricted to the specific inventory of the study site.
Results
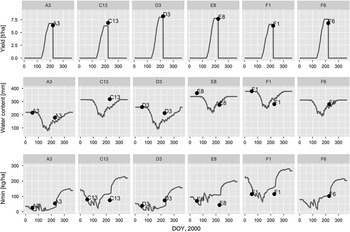
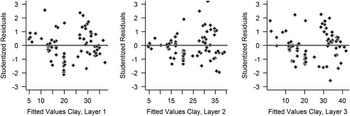
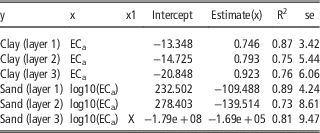
Considering model validation we focussed on the comparison of simulated and observed water content and mineral nitrogen content in the soil profile, and yield. Figure 2 visualises yield, soil water and mineral nitrogen content simulated with HERMES for a range of soil texture classes represented by selected sampling points and illustrates a high sensitivity of the model to differing soil information. Calculated RMSE regarding simulated annual yield ranges between 0.51 t ha-1 in the year 2000 and 0.98 t ha-1 in 2001. Lowest RMSE for soil water content is observed for the year 2000 (25.41 mm), highest for 2002 (41.84 mm), respectively. The mineral nitrogen in soil at the beginning of the growing season shows a RMSE between 35.06 kg ha-1 and 70.96 kg ha-1. In total, model output can be stated as satisfactory (Martre et al., Reference Martre, Wallach, Asseng, Ewert, Jones and Rötter2015). Before assignment of ECa values to the soil sampling points we excluded all values exceeding triple standard deviation. Including the sampling points of the nested design we achieved a sample size of altogether 80 value pairs. Table 1 shows the resulting regression models and their assessment, which is comparable with results from literature (Mertens et al., Reference Mertens, Pätzold and Welp2008; Pätzold et al., Reference Pätzold, Mertens, Bornemann, Koleczek, Franke, Feilhauer and Welp2008). For derivation of sand content logarithmic transformation of ECa values was required to avoid negative output. Additionally, the longitude as a covariate improved the regression model describing the sand content in layer 3. Minimum standard error (se) of 3.42 was determined for the clay content of the first layer while maximum se of 9.41 for the sand content of the third layer, respectively. Validity of the regression models is presented in figure 3.
Comparison of HERMES output (line) and observed values (points) regarding yield, water and mineral nitrogen content of soil layer 0 to 90 cm for selected grid points A3, C13, D3, E8, F1, and F6.

Residual plots for the selected regression models clay, layer 1, layer 2 and layer 3.

Different regression models for the calculation of clay and sand from ECa measurements at the study field Beckum (N=80); layer 1=0-30 cm, layer 2=30-60 cm, layer 3=60-90 cm

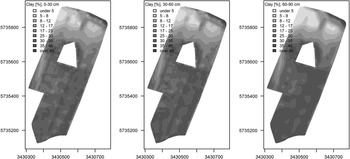
By applying the regression models to a total of 5,760 points of ECa mapping it was possible to derive an improved and more precise spatial pattern of clay, sand and silt contents for each soil layer. Exemplarily, figure 4 shows the calculated clay content of all soil layers with limit values illustrating a change in texture class according to the German classification system. Subsequently, we applied HERMES based on the upscaled texture information. Preliminary results suggest that the availability of additional soil parameters in a comparable resolution is essential for the improvement of spatial patterns to recommend reliable management strategies. This includes, for example, bulk density, organic carbon content, rooting depth and stone content, that has been derived up to now by interpolation from the described soil sampling grid (N=60).
Interpolated pattern of clay content per soil layer based on the regression models described in table 1.

Discussion
For the majority of the sampling points, simulation results from HEMES represent the corresponding observations for annual yield, soil water and soil mineral nitrogen content. Specific site characteristics, e.g. the stone content, complicate the calibration of soil physical properties. As water and air dynamics in soils are essential for crop growth and the efficiency of nitrogen uptake by plants, error propagation in the simulation process occurs at particular points. This may affect the accuracy of interpolated state patterns resulting from the sensor-model connection. High coefficients of determination regarding the regression models predicting soil texture for three subsequent soil layers potentially result from the wide range of observed clay and sand contents. For this particular study site, the derived equations are appropriate to improve the spatial resolution of the soil inventory as one essential input parameter for process-models. A reliable improvement of simulated spatial patterns based on the upscaled texture information strongly depends on the number and quality of additional input parameters influencing the simulation process.
Conclusion
The presented procedure of sensor-model connection is valid and transferrable to other sensor systems independent of site location, although the derived calculations from ECa measurements are not valid in general. Calibration of the process-models has been conducted at least for a wide range of soil texture. Particular soil inventories potentially require further adaptation and, hence, further soil sampling. The improvement of spatial resolution according to selected initial variables for process modelling can be confirmed by the present approach. A loss of spatial information during process simulation may occur in dependence of the specific model approaches, as HERMES calculates soil water dynamics based on soil texture classes instead of specific particle contents. Furthermore, process-oriented models usually require additional soil parameters that should be available in a comparable resolution. Subsequently, corresponding investigations are conducted on several study sites all over Germany regarding various sensor systems, inverse modelling and the development of data based pedotransfer functions.
Acknowledgements
This work is conducted within the project I4S (http://www.bonares.de/en/portfolio/i4s/) which is part of the BonaRes programme funded by the German Federal Ministry of Education and Research (BMBF), grant number 031A564J.