Introduction
A child's home language environment plays an important role in the development of language as children spend a large amount of time at home. Both the quantity (e.g., the amount of language input) as well as the quality (e.g., diversity and sophistication) of language input given by a caregiver influence language development in young children (Huttenlocher, Haight, Bryk, Seltzer & Lyons, Reference Huttenlocher, Haight, Bryk, Seltzer and Lyons1991; Rowe, Reference Rowe2012; Warlaumont, Richards, Gilkerson & Oller, Reference Warlaumont, Richards, Gilkerson and Oller2014; Weisleder & Fernald, Reference Weisleder and Fernald2013; Zimmerman, Gilkerson, Richards, Christakis, Xu, Gray & Yapanel, Reference Zimmerman, Gilkerson, Richards, Christakis, Xu, Gray and Yapanel2009). In addition, Warlaumont et al. (Reference Warlaumont, Richards, Gilkerson and Oller2014) suggested that there is a social feedback loop between a child and a caregiver that facilitates language development. When a child produces a sound, parents are likely to respond to this, which will encourage the child to produce similar utterances (Warlaumont et al., Reference Warlaumont, Richards, Gilkerson and Oller2014). More specifically, speech that is used in interaction with a child (e.g., conversational turns between caregiver and child) seems to predict a child's language development even more than the amount of language input (Ratner, Reference Ratner2013; Wang, Hartman, Aziz, Arora, Shi & Tunison, Reference Wang, Hartman, Aziz, Arora, Shi and Tunison2017; Zimmerman et al., Reference Zimmerman, Gilkerson, Richards, Christakis, Xu, Gray and Yapanel2009).
Despite the clear value of mapping characteristics of the home language environment (e.g., the amount of conversational turns), different methodological issues make it difficult to estimate this. Reliable audio recordings are required but gathering and processing representative recordings of the natural home language environment is generally very time-consuming. In this light, the Language ENvironment Analysis system (LENA) has been developed with the purpose of estimating the amount of speech present in the home language environment of young children (Schwarz, Botros, Lord, Marcusson, Tidelius & Marklund, Reference Schwarz, Botros, Lord, Marcusson, Tidelius and Marklund2017). The LENA uses an automated approach to yield a set of descriptive measures of daylong audio recordings (number of adult words, child vocalisations, conversational turns and other components of the audio environment) that meaningfully characterize language environments (Gilkerson, Zhang, Xu, Richards, Xu, Jiang, Harnsberger & Topping, Reference Gilkerson, Zhang, Xu, Richards, Xu, Jiang, Harnsberger and Topping2015). The process by which the LENA system derives language measures from audio recordings can be divided into two main steps (Xu, Yapanel, Gray & Baer, Reference Xu, Yapanel, Gray and Baer2008). First, the audio stream is divided into segments which are categorized based on the speaker or type of sound each segment represents (Xu et al., Reference Xu, Yapanel, Gray and Baer2008). These segments consist of key child (i.e., the child of interest being recorded), other child, male adult, female adult, overlapping sound, TV and other electric sound, noise (e.g., crying/whining) and silence. After identification of the different segments, the software can estimate: 1) Adult Word Count (AWC; the number of words spoken by a clear male or female adult in the proximity of the child), 2) Child Vocalisation Count (CVC; the number of vocalisations produced by the key child with the exception of vegetative sounds (e.g., sneezing or burping) and fixed sounds (e.g., crying or laughing)) and 3) Conversational Turns (CT; the number of turns the key child engages in with an adult – more specifically, all the child vocalisations that occur within five seconds of an adult utterance without an interruption from another child) (Ganek & Eriks-Brophy, Reference Ganek and Eriks-Brophy2018a; Schwarz et al., Reference Schwarz, Botros, Lord, Marcusson, Tidelius and Marklund2017; Xu et al., Reference Xu, Yapanel, Gray and Baer2008). A more comprehensive explanation of this process can be found in Oller, Niyogi, Gray, Richards, Gilkerson, Xu, Yapanel and Warren (Reference Oller, Niyogi, Gray, Richards, Gilkerson, Xu, Yapanel and Warren2010) and Gilkerson and Richards (Reference Gilkerson and Richards2008).
Thus far, the LENA system has been used to investigate individual differences in children's home language environments (e.g., Greenwood, Thiemann-Bourque, Walker, Buzhardt & Gilkerson, Reference Greenwood, Thiemann-Bourque, Walker, Buzhardt and Gilkerson2011; Weisleder & Fernald, Reference Weisleder and Fernald2013), to characterize the language environments of children with and without developmental problems such as autism spectrum disorder (ASD) (e.g., Dykstra, Sabatos-devito, Irvin, Boyd, Hume & Odom, Reference Dykstra, Sabatos-devito, Irvin, Boyd, Hume and Odom2012; Warlaumont et al., Reference Warlaumont, Richards, Gilkerson and Oller2014; Warren, Gilkerson, Richards, Oller, Xu, Yapanel & Gray, Reference Warren, Gilkerson, Richards, Oller, Xu, Yapanel and Gray2010) or with and without a hearing impairment (e.g., Aragon & Yoshinaga-itano, Reference Aragon and Yoshinaga-itano2012; Caskey & Vohr, Reference Caskey and Vohr2013), to study differences between home and school contexts (e.g., Burgess, Audet & Harjusola-Webb, Reference Burgess, Audet and Harjusola-Webb2013; Jackson & Callender, Reference Jackson and Callender2014), to investigate the language environment in other languages and cultures (e.g., Pae, Yoon, Seol, Gilkerson, Richards, Ma & Topping, Reference Pae, Yoon, Seol, Gilkerson, Richards, Ma and Topping2016) and to map outcome in language intervention research (e.g., Gilkerson et al., Reference Gilkerson, Zhang, Xu, Richards, Xu, Jiang, Harnsberger and Topping2015; Sacks, Shay, Repplinger, Leffel, Sapolich, Suskind, Tannenbaum & Suskind, Reference Sacks, Shay, Repplinger, Leffel, Sapolich, Suskind, Tannenbaum and Suskind2014). Furthermore, studies have also been focusing on updating psychometrics of the automated measurement in American English and in other languages (Greenwood, Schnitz, Irvin, Tsai & Carta, Reference Greenwood, Schnitz, Irvin, Tsai and Carta2018).
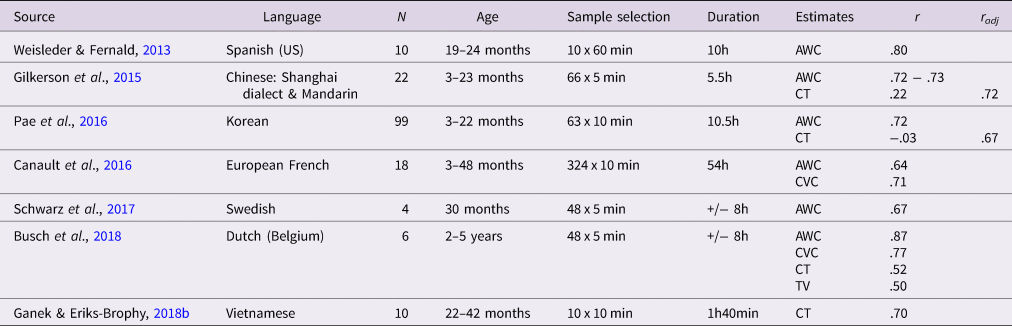
The LENA System software has been developed and so far mainly used for American English applications. There is a growing interest in the reliability and validity of the LENA System in other languages due to the benefits (e.g., less time consuming, more naturalistic, etc.) related to using an automated approach in mapping descriptive measures of the home language environment of young children. The validation of the LENA System has been performed for Spanish (as spoken in the United States; Weisleder & Fernald, Reference Weisleder and Fernald2013), European French (Canault, Le Normand, Foudil, Loundon & Thai-Van, Reference Canault, Le Normand, Foudil, Loundon and Thai-Van2016), Swedish (Schwarz et al., Reference Schwarz, Botros, Lord, Marcusson, Tidelius and Marklund2017), Chinese (Gilkerson et al., Reference Gilkerson, Zhang, Xu, Richards, Xu, Jiang, Harnsberger and Topping2015), Korean (Pae et al., Reference Pae, Yoon, Seol, Gilkerson, Richards, Ma and Topping2016), Vietnamese (Ganek & Eriks-Brophy, Reference Ganek and Eriks-Brophy2018b) and Dutch (Busch, Sangen, Vanpoucke & van Wieringen, Reference Busch, Sangen, Vanpoucke and van Wieringen2018). Validation for Chinese (with a focus on the Shanghai dialect and Mandarin) has shown that the LENA system can also be used in a tone language with a prosody that differs from American English, indicating that acoustic differences do not seem to invalidate system performance (Gilkerson et al., Reference Gilkerson, Zhang, Xu, Richards, Xu, Jiang, Harnsberger and Topping2015). As mentioned earlier, the LENA system software derives language measures from audio recordings using two main steps (Xu et al., Reference Xu, Yapanel, Gray and Baer2008). When validating the LENA system, comparisons with manual transcription can thus be provided for both steps: the algorithm's intermediate step (the segments) or its final output (the counts) (Busch et al., Reference Busch, Sangen, Vanpoucke and van Wieringen2018; Gilkerson et al., Reference Gilkerson, Zhang, Xu, Richards, Xu, Jiang, Harnsberger and Topping2015). Regarding the intermediate step, LENA and human transcribers seem to agree relatively well when labelling speaker and sound categories (segments) in American English and Chinese (Gilkerson et al., Reference Gilkerson, Zhang, Xu, Richards, Xu, Jiang, Harnsberger and Topping2015; Xu, Yapanel & Gray, Reference Xu, Yapanel and Gray2009). The majority of validation studies in languages other than American English has, however, investigated the validity of the LENA system directly at the level of its final output (counts) and did not take the intermediate step into account (for an overview see Table 1). This because specific counts seem to be influenced to a higher extent by the language that is being spoken (e.g., due to differences in speed of delivery, pitch, accent, dialectal variations, etc.) than speaker and sound categories (Busch et al., Reference Busch, Sangen, Vanpoucke and van Wieringen2018; Canault et al., Reference Canault, Le Normand, Foudil, Loundon and Thai-Van2016). Defining speaker and sound categories relies mainly on acoustic features that are extracted from the recording, but can be influenced by environmental factors such as a noisy environment (Xu et al., Reference Xu, Yapanel, Gray and Baer2008). Taking this into account, the current study will therefore focus on validating the final output (counts) of the LENA system.
Overview of validation studies in languages other than American English.

Note. N = number of participants, age = chronological age, radj = adjusted correlation when eliminating abundant overlap and noise.
In what follows, an overview will be given of studies that were specifically designed to evaluate the final output (counts) of the LENA system in languages other than American English. These studies will also be related to the results of the LENA foundation's validation study – more specifically the Natural Language Study (Gilkerson & Richards, Reference Gilkerson and Richards2008; Gilkerson, Richards, Warren, Montgomery, Greenwood, Oller, Hansen & Paul, Reference Gilkerson, Richards, Warren, Montgomery, Greenwood, Oller, Hansen and Paul2017; Xu et al., Reference Xu, Yapanel and Gray2009). A more comprehensive overview of all studies reporting on LENA validation in American English and in other languages can be found in the review of Cristia, Bulgarelli and Bergelson (Reference Cristia, Bulgarelli and Bergelson2020a).
Adult word count (AWC)
In American English, the LENA System Software's AWC Report estimated quite precisely how many adult words parents produced near the key child between 2 and 48 months of age (Gilkerson et al., Reference Gilkerson, Richards, Warren, Montgomery, Greenwood, Oller, Hansen and Paul2017). The Natural Language Study of the LENA Foundation reported a .92 correlation between human and LENA-based AWC estimates. The mean word count was 2% lower in the LENA estimates when compared to human estimates (Gilkerson & Richards, Reference Gilkerson and Richards2008; Gilkerson et al., Reference Gilkerson, Richards, Warren, Montgomery, Greenwood, Oller, Hansen and Paul2017; Xu et al., Reference Xu, Yapanel and Gray2009). In languages other than American English (see Table 1), accurate estimates of the amount of adult words spoken near the child have been reported with overall correlations ranging from .64 in families speaking European French (Canault et al., Reference Canault, Le Normand, Foudil, Loundon and Thai-Van2016) to .87 in Dutch-speaking families (Busch et al., Reference Busch, Sangen, Vanpoucke and van Wieringen2018). The validation study in European French was the only study that also investigated correlations between human and LENA estimates for different age groups. Despite the fact that the Natural Language Study indicated no influence of a child's age on AWC (Gilkerson & Richards, Reference Gilkerson and Richards2008), correlations for AWC in European French seemed to differ according to the age of the child and ranged from .61 (when the child was 13–18 months of age) to .87 (when the child was 0–6 months of age) (Canault et al., Reference Canault, Le Normand, Foudil, Loundon and Thai-Van2016). When including all validation studies (independent of the spoken language), the review of Cristia, Bulgarelli and Bergelson (Reference Cristia, Bulgarelli and Bergelson2020) reported a high overall correlation for AWC (mean r = .79) with rather low relative error rates indicating that the LENA System shows a small tendency to over-estimate AWC.
Child vocalisation count (CVC)
The LENA System Software's CVC Report estimates the total amount of vocalisations the key child produces (Gilkerson et al., Reference Gilkerson, Richards, Warren, Montgomery, Greenwood, Oller, Hansen and Paul2017). LENA and human based child vocalisation classifications were largely in agreement in the Natural Language Study, although there was a slightly stronger tendency to misclassify child non-speech sounds as speech sounds by the LENA System (Gilkerson & Richards, Reference Gilkerson and Richards2008; Gilkerson et al., Reference Gilkerson, Richards, Warren, Montgomery, Greenwood, Oller, Hansen and Paul2017; Xu et al., Reference Xu, Yapanel and Gray2009). The only other languages, besides American English, for which validation of CVC has been conducted is European French and Dutch (see Table 1). Canault and colleagues (2016) showed that human count estimates of child vocalisations correlated significantly with LENA System software counts in children from 3 to 48 months of age (r = .71) in European French. Similar to the correlations for AWC, correlations for CVC differed according to the child's age. The correlations ranged from .39 (for children aged 25–36 months) to .83 (for children aged 37–48 months). In Dutch-speaking children aged 2 to 5 years, a strong correlation of .77 was reported (Busch et al., Reference Busch, Sangen, Vanpoucke and van Wieringen2018). When combining validation studies in American English with those in other languages, a high overall correlation for CVC (mean r = .77) is reported with negative relative error rates indicating that the LENA system shows a tendency to under-estimate CVC (Cristia et al., Reference Cristia, Bulgarelli and Bergelson2020a). In addition, Busch et al. (Reference Busch, Sangen, Vanpoucke and van Wieringen2018) indicated that large proportional biases were present for CVC counts whereby LENA's CVC counts were lower than human counts for most of the samples selected for validation but higher than human counts for the samples containing many vocalizations.
Conversational turns (CT)
The LENA System Software's CT Report estimates the total amount of conversational turns the child engages in with an adult (Gilkerson et al., Reference Gilkerson, Richards, Warren, Montgomery, Greenwood, Oller, Hansen and Paul2017). The review of Cristia et al. (Reference Cristia, Bulgarelli and Bergelson2020a) reported a quite low overall correlation for CT (mean r = .36) in validation studies thus far. In addition, negative relative error rates indicate that the LENA system shows a rather strong tendency to under-estimate CT (Cristia et al., Reference Cristia, Bulgarelli and Bergelson2020a). The CT validation in languages other than American English has, thus far, only been investigated in Dutch, Chinese, Korean and Vietnamese (Busch et al., Reference Busch, Sangen, Vanpoucke and van Wieringen2018; Ganek & Eriks-Brophy, Reference Ganek and Eriks-Brophy2018b; Gilkerson et al., Reference Gilkerson, Zhang, Xu, Richards, Xu, Jiang, Harnsberger and Topping2015; Pae et al., Reference Pae, Yoon, Seol, Gilkerson, Richards, Ma and Topping2016) (see Table 1). In Dutch, the correlation between human CT counts and LENA CT counts was moderate (r = .52) for children between 2 and 5 years of age (Busch et al., Reference Busch, Sangen, Vanpoucke and van Wieringen2018). In addition, proportional biases were reported for CT counts in Dutch indicating that LENA's CT counts were higher than human counts for samples with few turns and lower for samples with many turns (Busch et al., Reference Busch, Sangen, Vanpoucke and van Wieringen2018). In Vietnamese, a strong correlation between human CT counts and LENA CT counts was reported (rs = .70) for children aged 22 to 42 months (Ganek & Eriks-Brophy, Reference Ganek and Eriks-Brophy2018b). The initial correlations between human CT counts and the automated CT estimates by the LENA software were low and non-significant for Chinese (r = .22) as well as for Korean (r = −.03) for children aged 3 to 23 months (Gilkerson et al., Reference Gilkerson, Zhang, Xu, Richards, Xu, Jiang, Harnsberger and Topping2015; Pae et al., Reference Pae, Yoon, Seol, Gilkerson, Richards, Ma and Topping2016). Both studies reported a correlation between human and LENA CT counts that was significant and higher both for Chinese (r = .72) and for Korean (r = .67) when excluding data that contained high amounts of abundant overlaps or whining noises. The algorithmic models of the LENA system do not detect conversational turns during overlapping speech or segments indicated as noise, as opposed to human coders. As human coders are able to disentangle the vocalisations of several children and adults, significantly greater absolute mean differences between human CT counts and LENA CT counts will be present when including audio segments with overlap or noise. The adjusted correlations in the Chinese and Korean study thus demonstrate that the LENA system only provides correct CT counts when there are clear segments containing exclusively vocalisations by the key child and by an adult.
The current study
The present study further evaluates the validity of automated estimates by the LENA System software measuring AWC, CVC and CT for Dutch. Although every language has its own phonetic and acoustic features (Canault et al., Reference Canault, Le Normand, Foudil, Loundon and Thai-Van2016), we expected the correlations for Dutch to resemble those reported for American English as both languages are part of the Germanic branch of the Indo-European language family and consist of similar sound systems.
The first objective of this study is to expand the results reported by Busch and colleagues (2018) by performing the LENA System validation in children under the age of two, which resembles the age range for which the LENA system was intended. The study of Jones, Skwerer, Pawar, Hamo, Carberry, Ajodan, Caulley, Silverman, McAdoo, Meyer, Yoder, Clements, Lord and Tager-flusberg (Reference Jones, Skwerer, Pawar, Hamo, Carberry, Ajodan, Caulley, Silverman, McAdoo, Meyer, Yoder, Clements, Lord and Tager-flusberg2019), for example, indicates that expanding the use of the LENA System beyond the age ranges for which it was developed might suggest misleading results. Gilkerson et al. (Reference Gilkerson, Richards, Warren, Montgomery, Greenwood, Oller, Hansen and Paul2017) additionally indicate that there may be age related differences when measuring the home language environment using the LENA system, especially for CVC and CT. These age differences may be due to differences in sleep patterns or modelling techniques used at different ages or to differences in the reliability of automated voice labelling across age (Gilkerson et al., Reference Gilkerson, Richards, Warren, Montgomery, Greenwood, Oller, Hansen and Paul2017). Expectations can be formulated based on previous validation studies in this age group. With regard to AWC, we expected a strong correlation between human count estimates and LENA System estimates within the range of previous validation studies evaluating the LENA system for AWC and irrespective of the age of the key child as chronological age did not significantly influence AWC in the Natural Language Study starting from the age of 5 months onwards (Busch et al., Reference Busch, Sangen, Vanpoucke and van Wieringen2018; Canault et al., Reference Canault, Le Normand, Foudil, Loundon and Thai-Van2016; Gilkerson & Richards, Reference Gilkerson and Richards2008; Gilkerson et al., Reference Gilkerson, Zhang, Xu, Richards, Xu, Jiang, Harnsberger and Topping2015, Reference Gilkerson, Richards, Warren, Montgomery, Greenwood, Oller, Hansen and Paul2017; Pae et al., Reference Pae, Yoon, Seol, Gilkerson, Richards, Ma and Topping2016; Schwarz et al., Reference Schwarz, Botros, Lord, Marcusson, Tidelius and Marklund2017; Weisleder & Fernald, Reference Weisleder and Fernald2013). With regard to CVC and CT, we do, however, expect age differences in the accuracy of the counts in the current study as both measures show a significant increase up to approximately 26 months (Gilkerson et al., Reference Gilkerson, Richards, Warren, Montgomery, Greenwood, Oller, Hansen and Paul2017). We mainly based our expectations on the results for European French and to some extent also for Dutch (despite the age difference) as these were the only two studies investigating the validity of the LENA system for CVC in a language other than American English. In line with those studies we expected to find medium to high correlations for CVC (Busch et al., Reference Busch, Sangen, Vanpoucke and van Wieringen2018; Canault et al., Reference Canault, Le Normand, Foudil, Loundon and Thai-Van2016). For CT, however, we expected correlations between human count estimates and LENA estimates to be rather low at first (Busch et al., Reference Busch, Sangen, Vanpoucke and van Wieringen2018; Gilkerson et al., Reference Gilkerson, Zhang, Xu, Richards, Xu, Jiang, Harnsberger and Topping2015; Pae et al., Reference Pae, Yoon, Seol, Gilkerson, Richards, Ma and Topping2016). Yet, it can be expected to see the same increase in Dutch as for Chinese and Korean when abundant overlaps or whining noises are eliminated (Gilkerson et al., Reference Gilkerson, Zhang, Xu, Richards, Xu, Jiang, Harnsberger and Topping2015; Pae et al., Reference Pae, Yoon, Seol, Gilkerson, Richards, Ma and Topping2016).
The second objective of this study is to explore if the validity of the LENA system would be similar in younger siblings of children with ASD (high-risk siblings; HR-sibs) and younger siblings of typically developing children (low-risk siblings; LR-sibs) and thus irrespective of the risk status of the child. These two groups were included in the validation study as we want to use the LENA system to compare the home language environment of both groups in the future. HR-sibs, especially, are of interest as 10 to 20% of these children are likely to develop ASD (Szatmari, Chawarska, Dawson, Georgiades, Landa, Lord, Messinger, Thurm & Halladay Reference Szatmari, Chawarska, Dawson, Georgiades, Landa, Lord, Messinger, Thurm and Halladay2016) and 28% may show a mild expression of the disorder and/or other developmental problems such as early deficits in language development (Brian, Roncadin, Duku, Bryson, Smith, Roberts, Szatmari, Drmic & Zwaigenbaum, Reference Brian, Roncadin, Duku, Bryson, Smith, Roberts, Szatmari, Drmic and Zwaigenbaum2014; Losh, Childress, Lam & Piven, Reference Losh, Childress, Lam and Piven2008; Marrus, Hall, Paterson, Elison, Wolff, Swanson, Parish-Morris, Eggebrecht, Pruett, Hazlett, Zwaigenbaum, Dager, Estes, Schultz, Botteron, Piven, Constantino & for the IBIS Network Reference Marrus, Hall, Paterson, Elison, Wolff, Swanson, Parish-Morris, Eggebrecht, Pruett, Hazlett, Zwaigenbaum, Dager, Estes, Schultz, Botteron, Piven and Constantino2018; Ozonoff, Young, Belding, Hill, Hill, Hutman, Johnson, Miller, Rogers, Schwichtenberg, Steinfeld & Iosif, Reference Ozonoff, Young, Belding, Hill, Hill, Hutman, Johnson, Miller, Rogers, Schwichtenberg, Steinfeld and Iosif2014), because of the high heritability of ASD. The comparison between HR-sibs and LR-sibs, in light of the validity of the LENA system, will be made as the study of Jones et al. (Reference Jones, Skwerer, Pawar, Hamo, Carberry, Ajodan, Caulley, Silverman, McAdoo, Meyer, Yoder, Clements, Lord and Tager-flusberg2019) reported that the LENA system did not reliably capture the speech/language of their sample. They suggest that the speech/language of older children and adolescents with ASD may be characterized by changes in voice quality which can negatively influence the automated coding procedure of the LENA system (Jones et al., Reference Jones, Skwerer, Pawar, Hamo, Carberry, Ajodan, Caulley, Silverman, McAdoo, Meyer, Yoder, Clements, Lord and Tager-flusberg2019). Consequently, the current study will evaluate if this difference would also be apparent in young children at elevated risk for ASD.
Method
Participants
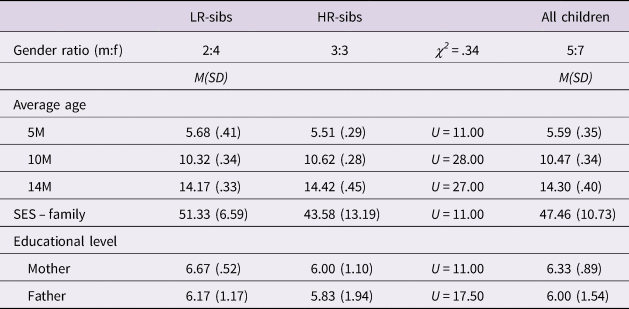
Participants included six younger siblings of typically developing children (low-risk siblings; LR-sibs) and six younger siblings of children with ASD (high-risk siblings; HR-sibs). The current study was part of a longitudinal prospective study of LR-sibs and HR-sibs during the first three years of life. It was decided to select six children from both groups embedded in the longitudinal prospective study in view of sufficient hours of coding for defining validity and in light of feasibility within a limited time span. All children were native Dutch-speaking children with both parents also being native speakers of Dutch. Inclusion criteria for LR-sibs were full-term birth and no ASD within first-degree relatives. HR-sibs and their older sibling with ASD had no known genetic disorder linked to ASD. HR-sibs were recruited in centres for developmental disorders, rehabilitation centres, home guidance centres and through parent support groups. LR-sibs were recruited in well-baby clinics and day-care centres. In addition, both HR-sibs and LR-sibs were recruited via Facebook and the website of the aforementioned longitudinal study. Participant characteristics are presented in Table 2. The families’ socioeconomic status (SES - family) was calculated using Hollingshead's four factor index and was based on both parents’ education level and occupation (Hollingshead, Reference Hollingshead1975). The families’ social status in the current study reflects an average to high social status and corresponds with the highest three strata (stratum 1: major business and professional; stratum 2: medium business, minor professional, technical; stratum 3: skilled craftsmen, clerical, sales workers) of the five social strata defined by Hollingshead. The families’ SES is important to consider as this has been correlated with specific characteristics of a child's language environment in previous research (Gilkerson et al., Reference Gilkerson, Richards, Warren, Montgomery, Greenwood, Oller, Hansen and Paul2017). For all variables reflecting participant characteristics, the assumption of normality was violated. Therefore, Mann-Whitney U tests were performed in order to explore group comparisons. When comparing the gender ratio of both groups a Chi-square test was used. Both groups of children were very similar with regard to the participant characteristics.
Participant Characteristics.

Note. LR-sibs = low-risk siblings, HR-sibs = high-risk siblings, m:f = male:female, M(SD) = mean (standard deviation), 5M = 5 months, 10M = 10 months, 14M = 14 months, SES = socio-economic status (Hollingshead, Reference Hollingshead1975), educational level was also defined by Hollingshead (Reference Hollingshead1975).
Measures
Home language environment measures were obtained employing the LENA system. The participating children wore a small digital recorder in the front chest pocket of clothing designed to optimize microphone placement and to reduce noise from clothing friction as much as possible. Recorders contained 16 hours of high-quality audio, optimally recorded within 6- to 10-foot radius at 16 kHz.
Procedure
At 5, 10 and 14 months of age, we asked parents to let their child wear the recording device during two typical week and/or weekend days at home, when the majority of the family was present and no trips to crowded places were planned. This led to a total of six recordings per child. Both of the recordings took place within a time span of 10 days for every age. 59 (~82%) of the total amount of 72 recordings took place during a weekend or on a weekday during school holidays. Parents also filled out a log. In this log the parents noted the sequence of the day with regard to the eating and sleeping behaviour of the child, which family members were present during the day, if the child slept well before the recording and if anything was out of the ordinary (child feeling sick, unforeseen circumstances, etc.). All parents were instructed to begin recording as soon as their child woke up in the morning and to continue recording until their child went to bed at night. Thereafter, the LENA recorder switched itself off when it had gathered 16 hours of recording. Completed recordings were processed by the LENA software to acquire the AWC, CVC and CT estimates for the current study.
For the validation of the LENA-based AWC, CVC and CT estimates, audio samples were randomly drawn from every family recording. The selection was based on the methodology described in Gilkerson et al. (Reference Gilkerson, Zhang, Xu, Richards, Xu, Jiang, Harnsberger and Topping2015). Every recording day was divided into three 4-hour zones: morning (9 a.m. – 1 p.m.), afternoon (1 p.m. – 5 p.m.), and evening (5 p.m. – 9 p.m.). From each zone, we pseudo-randomly selected one 5-min sample including AWC, CVC and CT counts. Chunks consisting of only adult or child vocalisations were not considered eligible in the interest of validation. For each participant, we thus selected three chunks of 5-min recordings per recording day, which resulted in eighteen chunks for the six recording days spread over the three ages. Consequently, a total of 216 samples were selected for the 12 participants (1080 min, or 18 hours, in total).
Two native Dutch-speaking coders, blind to group status of the children, listened to the home recordings and counted the AWC, CVC and CT of the 216 selected samples (human count estimate). As the LENA system does not provide any semantic information but only estimated counts, validation did not require the samples to be transcribed (Gilkerson et al., Reference Gilkerson, Zhang, Xu, Richards, Xu, Jiang, Harnsberger and Topping2015). Consequently, no software was used to count AWC, CVC and CT of the different 5-min chunks. Coders listened at least three times to each 5-min chunk in order to separately count the LENA system estimates (AWC, CVC and CT). Using pen and paper, coders tallied AWC and CVC respectively during the first and second time they listened to the 5-min chunk. During the third listen, coders wrote down the sequence of the CT (e.g., key child – parent – key child) indicating also start and end time. Pausing the 5-minute sample was allowed. Data transcription and coding, as described in more detail below, was mainly based on the description hereof in the Natural Language Study (Gilkerson & Richards, Reference Gilkerson and Richards2008; Gilkerson et al., Reference Gilkerson, Richards, Warren, Montgomery, Greenwood, Oller, Hansen and Paul2017) and the paper of Canault and colleagues (2016).
Firstly, AWC estimates the number of adult words spoken loudly enough to register clearly in the LENA recorder (Gilkerson et al., Reference Gilkerson, Richards, Warren, Montgomery, Greenwood, Oller, Hansen and Paul2017). The LENA system does not differentiate between child-directed and overheard speech: therefore, AWC consists of words adults directed to the child (child-directed speech) and/or to other people present (speech overheard by the key child) (Gilkerson et al., Reference Gilkerson, Richards, Warren, Montgomery, Greenwood, Oller, Hansen and Paul2017). All words adults used were counted as separate words when they were understandable to the coder. When the adult contracted two words into one (e.g., “tis” (it's) for “het is” (it is)) this was counted as one word. Vocalisations of adults were counted as words when they consisted of at least one syllable. Stop words or filled pauses (e.g., “eh”, “uh”) were, however, eliminated as the consonant is often silent (see also Busch et al., Reference Busch, Sangen, Vanpoucke and van Wieringen2018; Canault et al., Reference Canault, Le Normand, Foudil, Loundon and Thai-Van2016). As mentioned earlier, the LENA system is not able to differentiate between child-directed speech and speech directed to other persons in the proximity of the child. Comprehensive studies on parental language input, however, indicated that mainly language used in interaction with a child, rather than the exposure to language in the environment (e.g., overheard language during a conversation between parents), is important for the language development of a child (Ratner, Reference Ratner2013; Weisleder & Fernald, Reference Weisleder and Fernald2013). Consequently, a distinction was made between words directed to the key child (child-directed speech) or to other people (other speech) in the current study when coding adult words.
Secondly, CVC estimates were made for the key child. The LENA system defines vocalisations by a “breath-group” criterion, whereby a 300 ms pause ends a vocalisation. This suggests that vocalisations occur on expiration, and each time an inspiration (or long enough break) occurs, a break between vocalisations is perceived (Oller et al., Reference Oller, Niyogi, Gray, Richards, Gilkerson, Xu, Yapanel and Warren2010). This is, however, difficult to implement in a manual transcription protocol where no software is being used. In addition, this is not a common way to count child vocalisations when transcribing manually. In the current study, the distinction between different vocalisations was therefore based partly on the presence of a small pause (hearable for the coder) and mainly on the semantic content. Successive vocalisations by the child were seen as separate ones when a small pause (e.g., inspiration) was present (Oller et al., Reference Oller, Niyogi, Gray, Richards, Gilkerson, Xu, Yapanel and Warren2010). For example, if the child said “babababa” or “ba” these utterances were counted as one vocalisation, whereas “bababa # baba” was counted as two vocalisations. In the case of protowords/words and sentences, the semantic content was prioritized to the presence of a small pause. Protowords and/or words were counted as one vocalisation even if they contained a small pause in the middle. When a child combined protowords and/or words into a sentence the different words were counted as vocalisations (e.g., “nog koekje” (more cookie) was counted as 2 vocalisations). All speech-like babbling or vocalisations were taken into account. Fixed signals (e.g., cries, screams, laughs,…) and vegetative sounds (e.g., sneezing, drinking sounds, …) were not considered valid as vocalisations.
Thirdly, we made a CT estimate for the key child. Vocal alternations occurring between adult and child within 5 seconds were counted as a CT (Gilkerson & Richards, Reference Gilkerson and Richards2008). Consequently, a conversation was bounded by a pause of at least 5s. Coders registered the start and end time of a CT and monitored the timing of the vocal alternations while writing down the sequence of the CT (e.g., key child – parent – key child). As with the LENA algorithm, the first utterance of each conversation was not counted as a turn (e.g., “key child – parent – key child” was counted as one CT while “key child – parent – key child - parent” was counted as two CT's). In contrast to the LENA system, CT's were also counted when they occurred during overlapping speech (see also Busch et al., Reference Busch, Sangen, Vanpoucke and van Wieringen2018; Gilkerson et al., Reference Gilkerson, Zhang, Xu, Richards, Xu, Jiang, Harnsberger and Topping2015; Pae et al., Reference Pae, Yoon, Seol, Gilkerson, Richards, Ma and Topping2016) or when interrupted by a third speaker if the coder indicated that this may have been understood by the child. These conversational turns were included in the coding scheme as the current study intended to evaluate the performance of the LENA system compared to how turns would be coded manually. This may, however, have led to a higher CT count in the manual coding compared to the automated LENA estimates, which can make it difficult to compare these results.
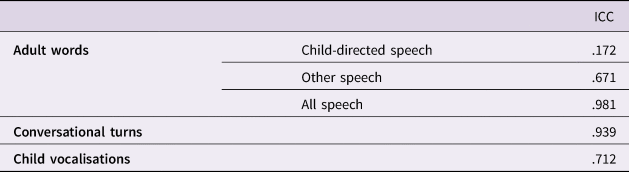
A subsample (20%) of 5-min chunks was coded by both coders in order to determine interrater reliability using the absolute agreement intra-class correlation coefficient (ICC) (see Table 3). Regarding AWC, interrater reliability was very low for child-directed speech since coders could not always determine whether or not speech was directed to the child based on audio recordings. Consequently, no distinction was made between child-directed and other speech hereafter. The ICC indicated good to excellent agreement between both coders for AWC (when all words were taken into account), CT and CVC.
Intra-class correlation coefficient indicating interrater reliability for human count estimate.

Note. ICC = absolute agreement intra-class correlation coefficient.
Statistical analysis
To assess the concurrent validity of the LENA system for Dutch, comparisons between AWC, CT and CVC estimates generated by the LENA system software (Version: V3.5.0) and human coders were performed for all selected 5-min chunks. Paired sample t-tests and Pearson product-moment zero-order correlations were carried out for all children together, for both groups separately, and for the different age groups. Results were generated using SPSS (Version 25.0) to obtain descriptive statistics, t-values and correlations. Correlations lower than .30 reflect poor agreement between the LENA and human counts and correlations between .30 and .50 reflect low agreement. Correlations between .50 and .70, on the other hand, reflect moderate agreement between the LENA and human counts and correlations higher than .70 reflect high agreement. Although the exact meaning of correlations cannot merely be interpreted based on the correlation coefficient (Bosco, Aguinis, Singh, Field & Pierce, Reference Bosco, Aguinis, Singh, Field and Pierce2015; Taylor, Reference Taylor1990), correlations of .70 or higher are consistently interpreted as high. Nevertheless, it should be taken into account that correlations reflect the linear association between both methods and do not take into account systematic biases (Busch et al., Reference Busch, Sangen, Vanpoucke and van Wieringen2018). When Pearson correlations were compared, a Fisher r-to-z transformation was used.
Results
Adult word count
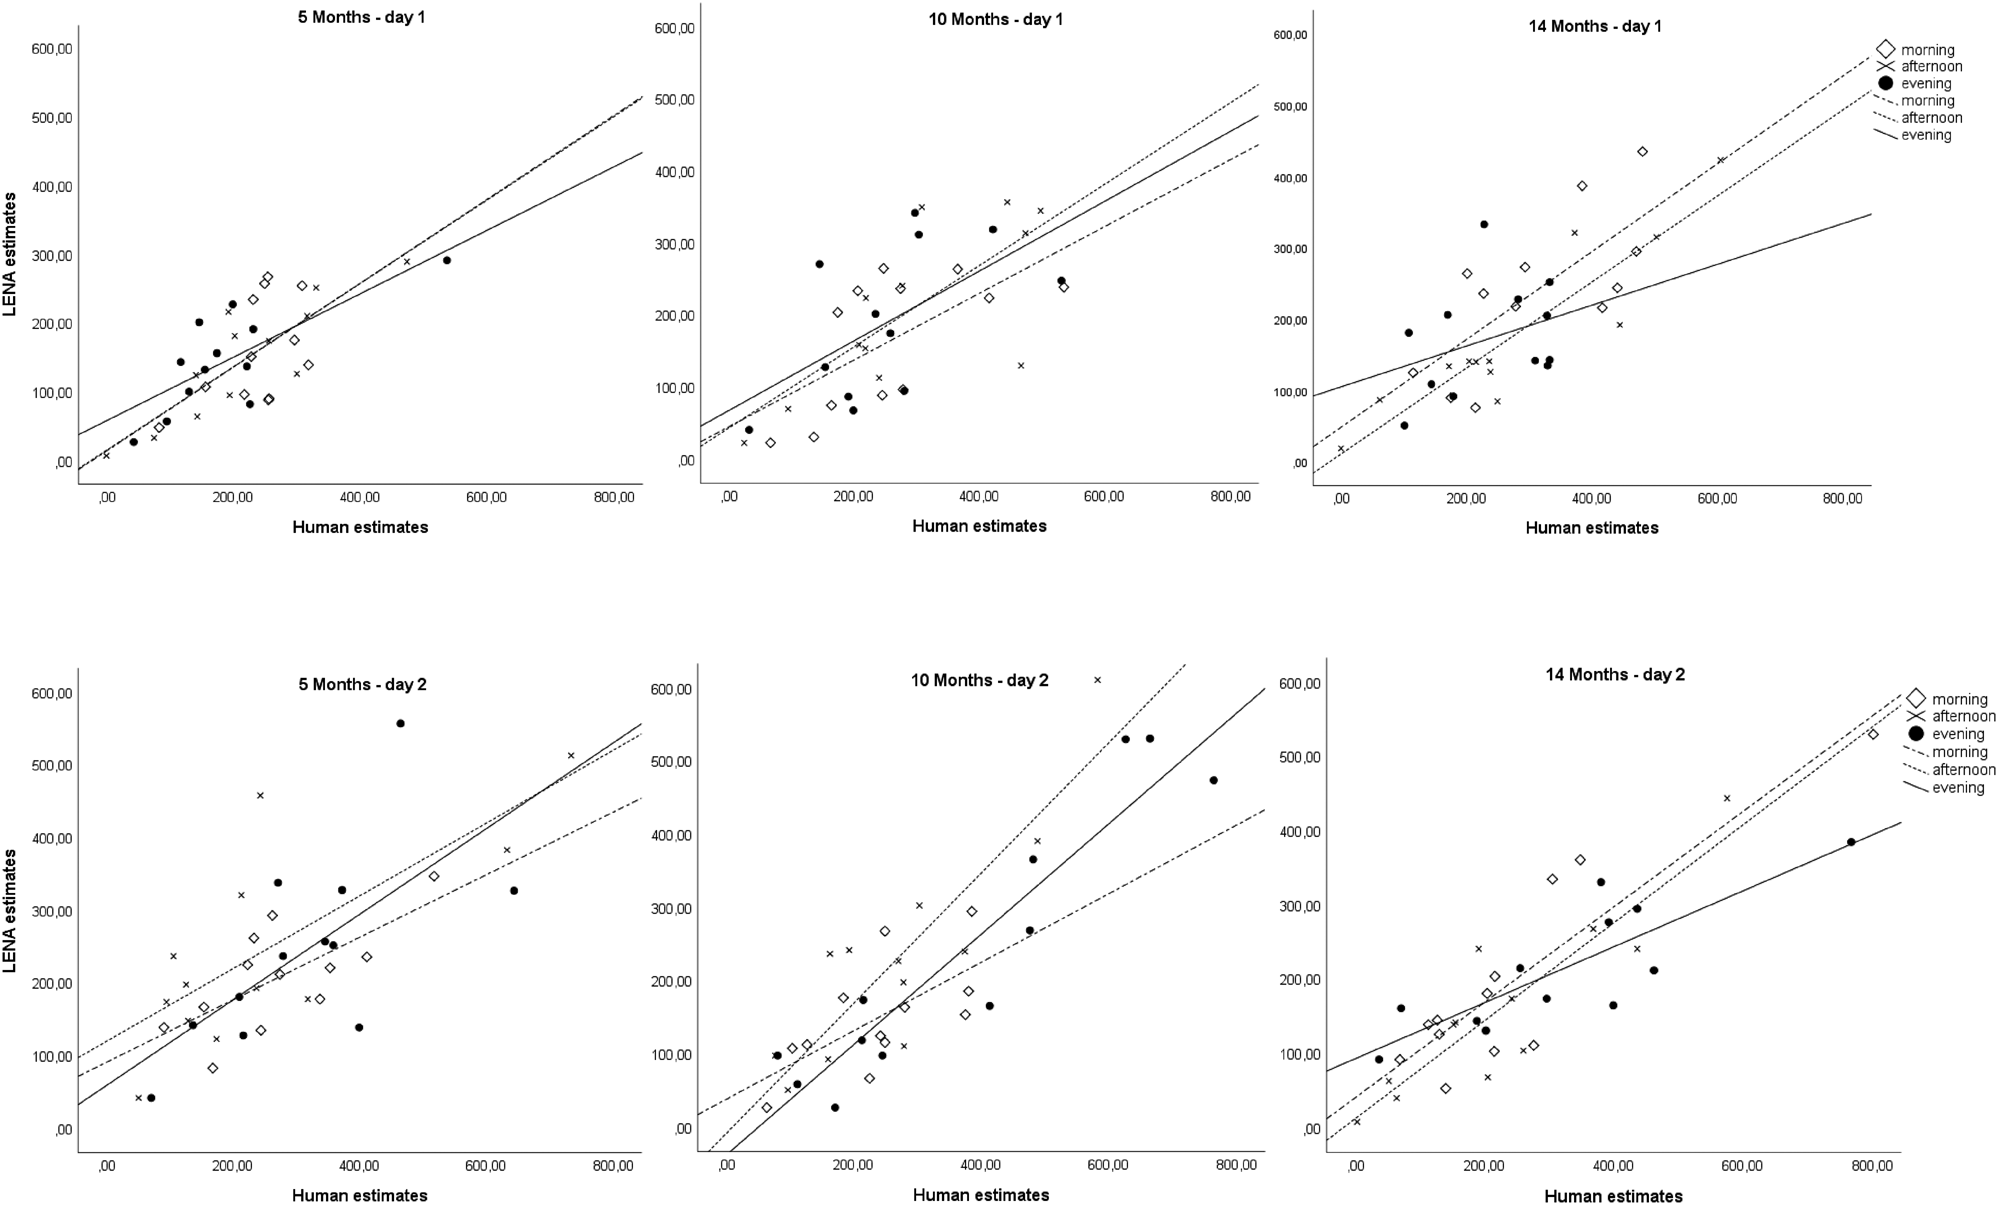
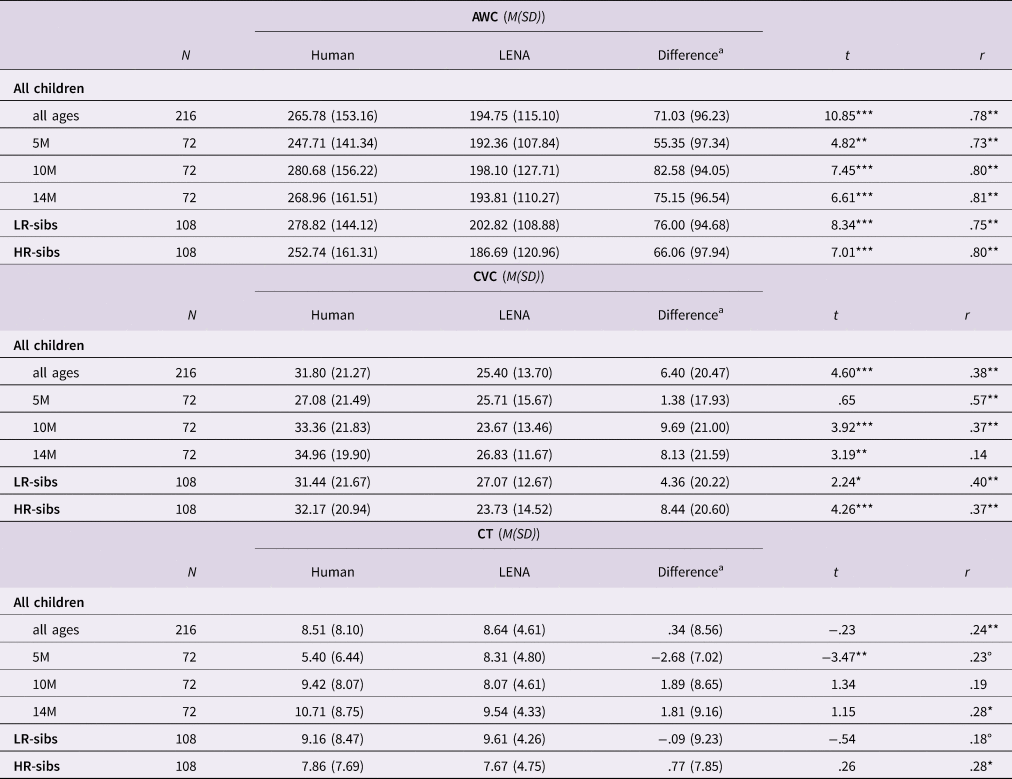
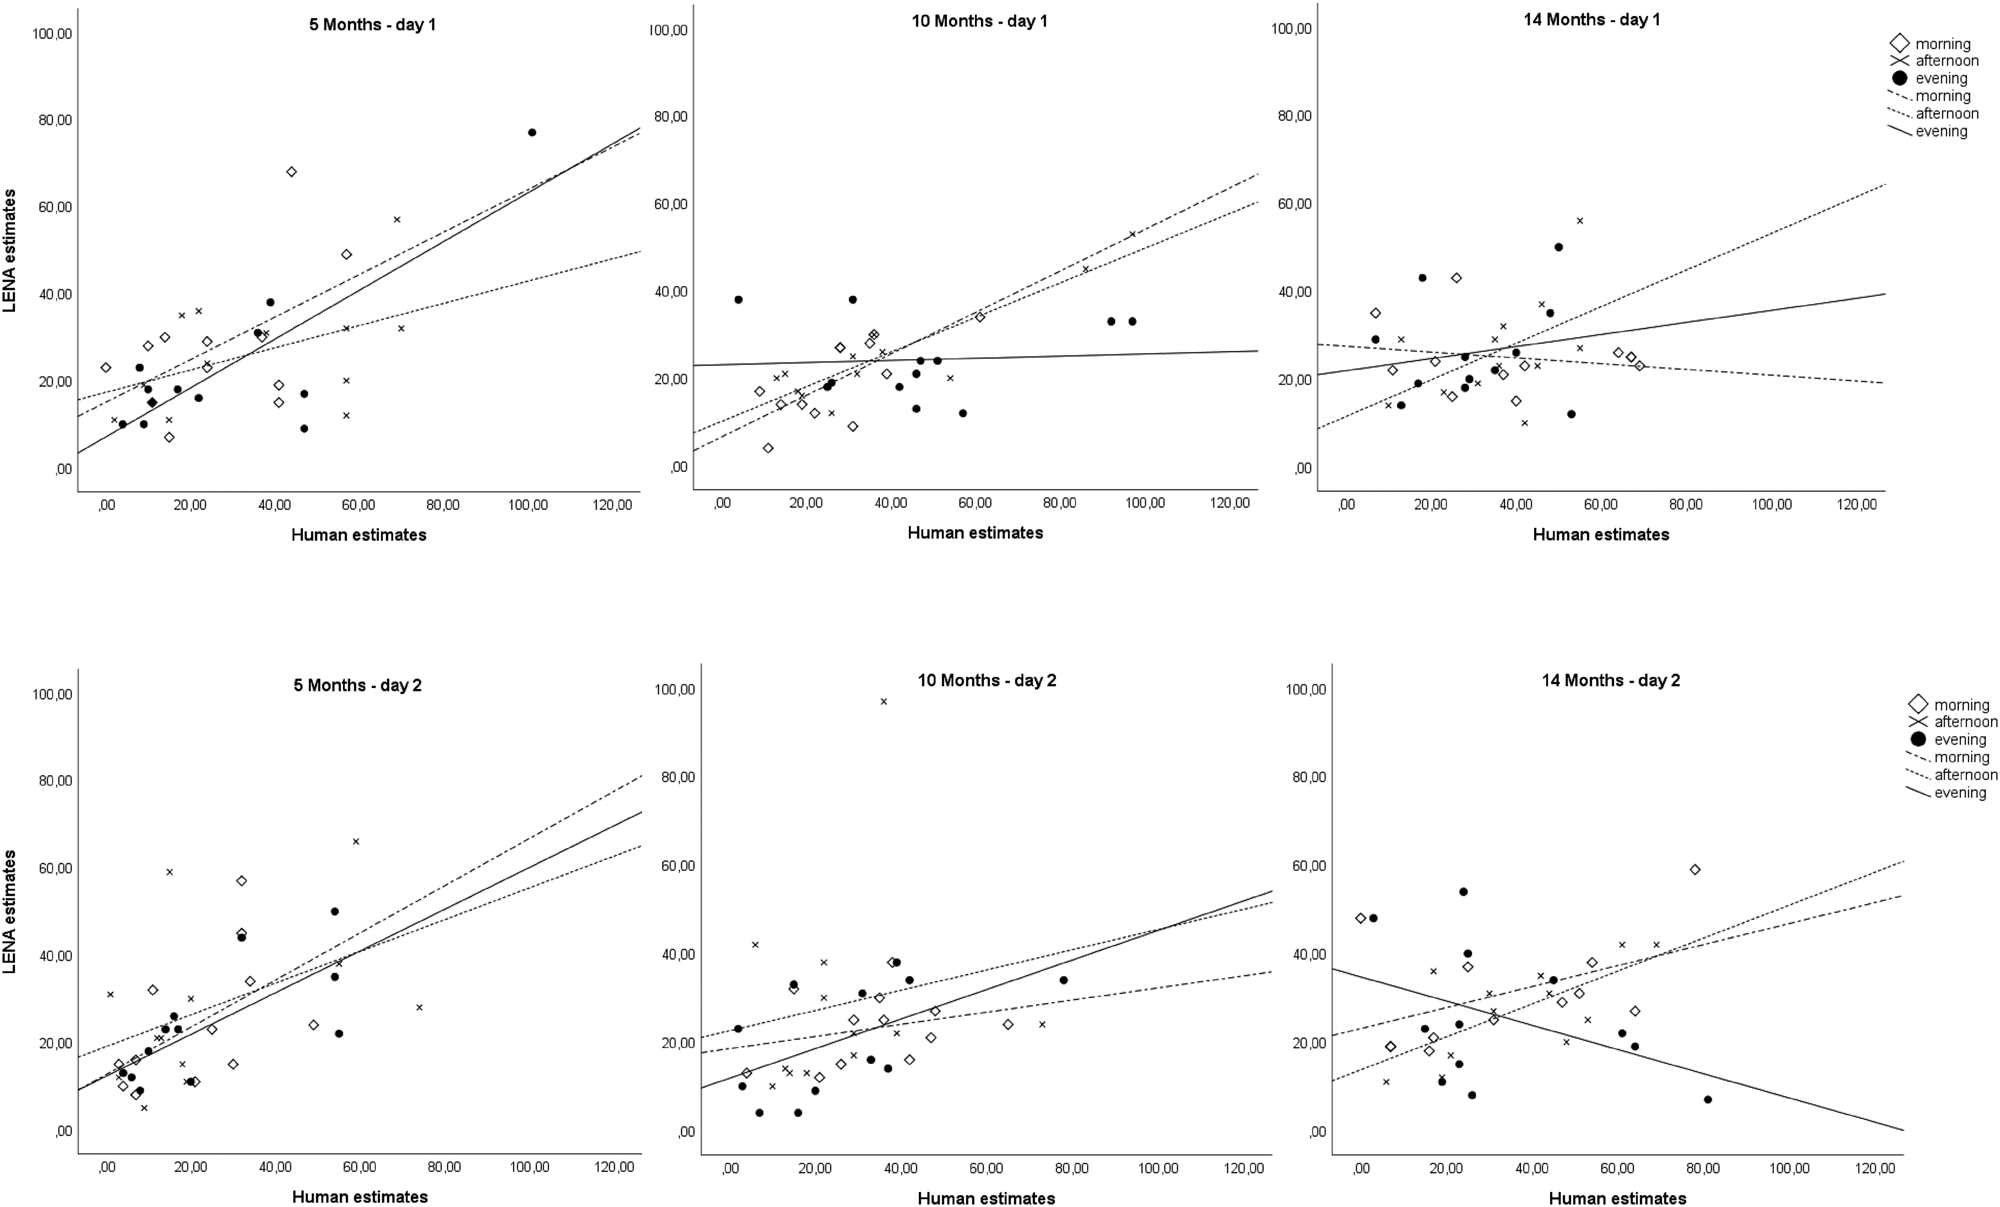
Means and standard deviations for human count estimates and LENA estimates, the results of the paired samples t-test and Pearson product-moment zero-order correlations are presented in Table 4. On average, the LENA system counted significantly fewer adult words than the human coders (p < .001; see Table 4). The mean difference, between the LENA system and human estimates, ranged from 55.35 (SD = 97.23) at 5 months to 82.58 (SD = 94.05) at 10 months (see Table 4). The variation (SD) was also higher in human count estimates compared to the estimates of the LENA system (see Table 4 and Figure 1). Figure 1 displays scatterplots of the LENA system and human estimates for the three different ages and in addition also for the different recording days as well as the three different time zones (morning, afternoon and evening) from which 5-min chunks were selected.
Visualisation of LENA versus Human estimates for AWC by age groups represented for both recording days and the three different zones (morning, afternoon and evening) from which 5-min chunks were selected.

Means and standard deviations for human count estimates and LENA estimates, Paired samples t-test and Pearson correlations between LENA and human estimates for all children, across all ages and per age, and for LR-sibs and HR-sibs separately.

Note. 5M = 5 months, 10M = 10 months, 14M = 14 months, HR-sibs = high-risk siblings, LR-sibs = low-risk siblings, AWC = adult word count (all words), CVC = child vocalisation count, CT = conversational turns, N = amount of 5-min chunks, Human = human count estimate, LENA = LENA system count, aDifference values reflect human count estimates minus LENA system counts, t = value of the paired samples t-test, r = Pearson correlation between human and LENA count estimate, °p < .10, *p < .05, **p < .01, ***p < .001.
Despite significant mean differences, Pearson product-moment zero-order correlations indicated that human count estimates of adult words significantly correlated (p < .01) with the corresponding LENA system estimates. This significant and high correlation (r = .73 to .81) was found for all children together, for both groups separately, and for the different age groups (see Table 4).
Child vocalisation count
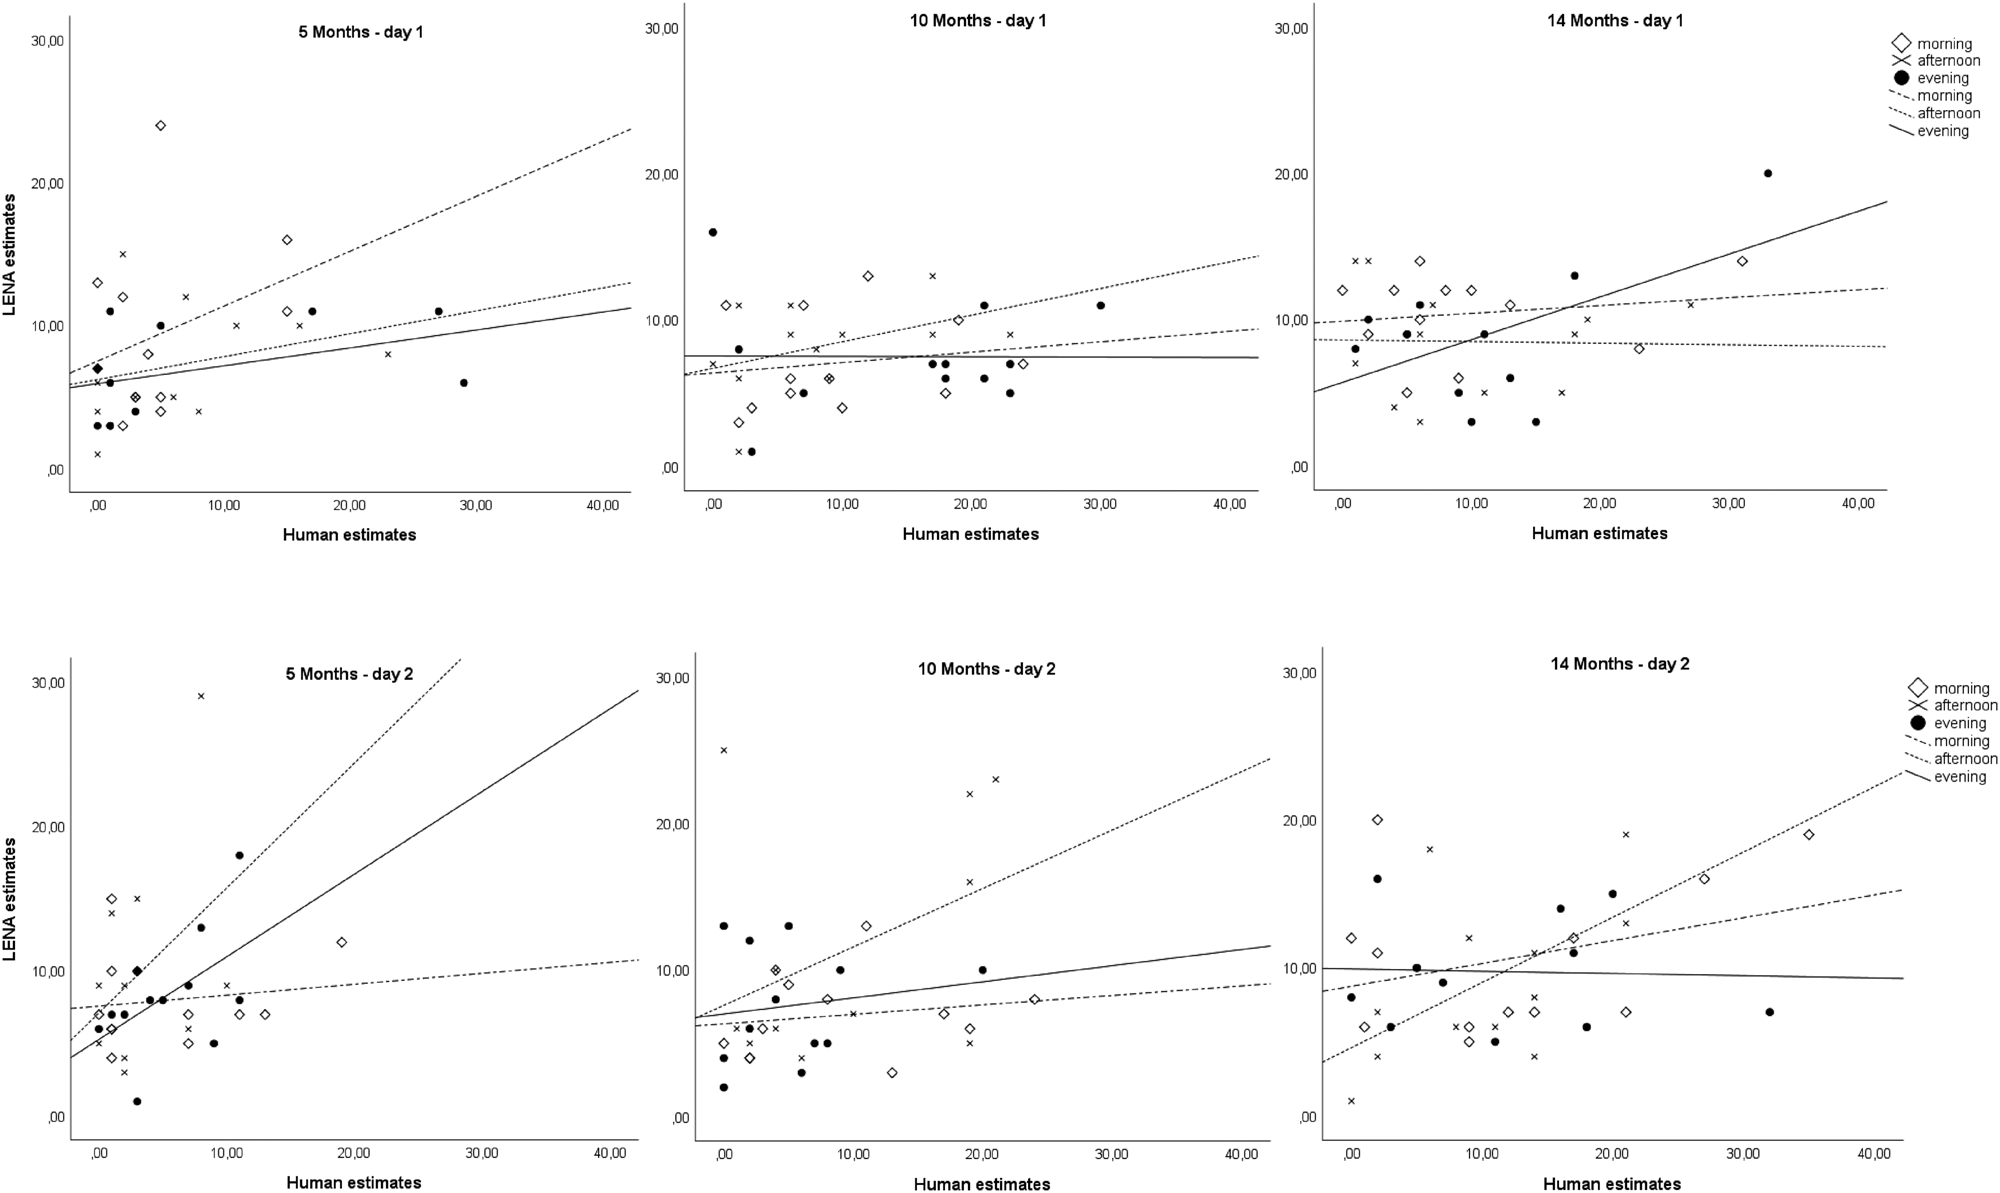
Means and standard deviations for human count estimates and LENA estimates, the results of the paired samples t-test and Pearson product-moment zero-order correlations are presented in Table 4. The LENA system systematically counted significantly fewer child vocalisations than human coders did (mean difference ranged from 4.36 (SD = 20.22) in LR-sibs to 9.69 (SD = 21.00) at 10 months; see Table 4), except at the age of 5 months where a non-significant mean difference of 1.38 (SD = 17.93) was reported. In addition, human count estimates also showed higher variation (SD) compared to the estimates of the LENA system (see Table 4 and Figure 2). Scatterplots of the LENA system and human estimates for the three different ages and for the different recording days as well as the three different zones (morning, afternoon and evening) from which 5-min chunks were selected are displayed in Figure 2.
Visualisation of LENA versus Human estimates for CVC by age groups represented for both recording days and the three different zones (morning, afternoon and evening) from which 5-min chunks were selected.

Despite significant mean differences (except at the age of 5 months), Pearson product-moment zero-order correlations showed that human count estimates of child vocalisations significantly correlated (p < .01) with the corresponding LENA estimates (see Table 4). This significant correlation was found for all participants and also when the risk status was taken into account. When looking at the different ages the LENA system was used, significant correlations between human count estimates and LENA estimates were only found at the age of 5 (r = .57, p < .01) and 10 months (r = .37, p < .01) but not at the age of 14 months (r = .14, p = .23) (see Table 4). A Fisher r-to-z transformation shows that the correlation at 14 months was significantly smaller than the one at 5 months (z = 2.98, p < .01), but did not significantly differ from the correlation at 10 months (z = 1.45, p = .15). Although significant at 5 and 10 months, correlations were moderate to low. Furthermore, the correlation between human count estimates and LENA estimates was also rather low for all children together (r = .38, p <.01) and when group status was taken into account (LR-sibs: r = .40, p <.01; HR-sibs: r = .37, p <.01) (see Table 4).
Conversational turns
Means and standard deviations for human count estimates and LENA estimates, the results of the paired samples t-test and Pearson product-moment zero-order correlations are presented in Table 4. As reported in Table 4, the average amount of conversational turns produced by human counts and the LENA system were very similar (mean difference ranged from −.09 (SD = 9.23) in LR-sibs to 1.89 (SD = 8.65) at 10 months). Only at the age of 5 months a significant difference was reported between human and LENA counts (mean difference is −2.68 and SD is 7.02). The variation was higher in human count estimates compared to the estimates of the LENA system (see Table 4 and Figure 3). Scatterplots of the LENA system and human estimates for the three different ages and for the different recording days as well as the three different zones (morning, afternoon and evening) from which 5-min chunks were selected are displayed in Figure 3.
Visualisation of LENA versus Human estimates for CT by age groups represented for both recording days and the three different zones (morning, afternoon and evening) from which 5-min chunks were selected.

Despite the lack of significant mean differences (except at the age of 5 months), human count estimates of conversational turns did not consistently correlate with the corresponding LENA estimates at different ages and for different groups (r = .18 to .28; see Table 4). The correlation was significant but low when no distinction was made regarding age or group (r = .24, p < .01) and at the age of 14 months (r = .28, p < .05). When risk status was taken into account, a significant low correlation was only found in HR-sibs (r = .28, p < .05).
Discussion
This study was the first to validate the LENA system performance in Dutch-speaking children younger than 2 years of age. AWC, CVC and CT estimates were performed for 216 5-min chunks, making this the second largest study investigating the validity of the LENA system in a language other than American English. In addition, the current sample consisted of children at high and low risk for ASD which made it possible to determine if a child's risk status would influence LENA validity.
In general, correlational analyses revealed good overall accuracy of the LENA system in estimating the amount of adult words (r = .78). Overall agreement regarding the amount of child vocalisations (r = .38) and conversational turns (r = .24) was rather low. Several suggestions can be made which may explain the variability of correlations found in different studies (e.g., different languages, methodological and environmental differences, age at which the recording took place, etc.) (Busch et al., Reference Busch, Sangen, Vanpoucke and van Wieringen2018). Some of these explanations, suggested by Busch et al. (Reference Busch, Sangen, Vanpoucke and van Wieringen2018), will also be discussed regarding the current study, yet supplemented with other possible explanations.
Good correlation between human and LENA estimates for AWC
Correlations found in the current study were within the range of previously reported correlations in American English and other languages. The current results were higher than correlations reported in Swedish and in European French (Canault et al., Reference Canault, Le Normand, Foudil, Loundon and Thai-Van2016; Schwarz et al., Reference Schwarz, Botros, Lord, Marcusson, Tidelius and Marklund2017). Within the Swedish sample, comparisons were made for only 48 5-min samples in 30-month old children while the sample in European French consisted of 324 10-min samples in children aged 0–48 months (Canault et al., Reference Canault, Le Normand, Foudil, Loundon and Thai-Van2016; Schwarz et al., Reference Schwarz, Botros, Lord, Marcusson, Tidelius and Marklund2017). In the Swedish and European French sample a correlation of .67 and .64, respectively, was reported while the current overall correlation for AWC in Dutch was .78. When comparing correlations from the different age groups of Canault et al. (Reference Canault, Le Normand, Foudil, Loundon and Thai-Van2016) (0–6 months: .87; 7–12 months: .72, 13–18 months: .61) with the correlations of the same age in the current study, significantly lower correlations were found at 5 months (z = −2.19, p < .05), equal correlations were found at 10 months (z = 1.03, p = .30) and significantly higher correlations were found at 14 months (z = 2.26, p < .05) for AWC in the current study. However, within Dutch-speaking samples a strong correlation between LENA and human counts was reported for AWC by Busch et al. (Reference Busch, Sangen, Vanpoucke and van Wieringen2018) in 2 to 5 year old children (r = .87) and in the current sample of children younger than two years of age (r = .78). These results suggest that there is a strong correlation for AWC in a Dutch sample, independent of the intended age range of the LENA system. This is in line with the results of the Natural Language Study indicating that chronological age does not significantly influence AWC starting from the age of 5 months onwards (Gilkerson et al., Reference Gilkerson, Richards, Warren, Montgomery, Greenwood, Oller, Hansen and Paul2017). Together with previous studies in languages other than American English, the current results seem to indicate that the LENA system does a good job at estimating the amount of adult words in Dutch (Busch et al., Reference Busch, Sangen, Vanpoucke and van Wieringen2018; Canault et al., Reference Canault, Le Normand, Foudil, Loundon and Thai-Van2016; Gilkerson et al., Reference Gilkerson, Zhang, Xu, Richards, Xu, Jiang, Harnsberger and Topping2015; Pae et al., Reference Pae, Yoon, Seol, Gilkerson, Richards, Ma and Topping2016; Schwarz et al., Reference Schwarz, Botros, Lord, Marcusson, Tidelius and Marklund2017; Weisleder & Fernald, Reference Weisleder and Fernald2013).
Influence of child's age on the correlation between human and LENA estimates for CVC
The chronological age of the key child seemed to have an influence on the strength of the correlations between human and LENA estimates, especially with regard to child vocalisations. The agreement for child vocalisations between LENA system estimates and human estimates seemed to be dependent on the child's age. At the age of 5 months (r = .57), the correlation reported in the current study was slightly higher than the one reported in European French (0–6 months: r = .49; Canault et al., Reference Canault, Le Normand, Foudil, Loundon and Thai-Van2016), yet they did not significantly differ from one another (z = .60, p = .55). At the age of 10 (r = .37) and 14 months (r = .14), correlations were lower than those reported in European French (7–12 months: r = .54; 13–18 months: r = .67; Canault et al., Reference Canault, Le Normand, Foudil, Loundon and Thai-Van2016) and they significantly differed from one another at 14 months (z = −3.63, p < .001) but not at 10 months (z = −1.17, p = .24). In addition, Busch et al. (Reference Busch, Sangen, Vanpoucke and van Wieringen2018) reported a substantially higher correlation (r = .77) between LENA and human counts in 2 to 5 year old Dutch-speaking children. Thus, the current results indicate rather low correlations for CVC in Dutch-speaking children under two years of age and correlations seem to decline with increasing age. Yet, Busch et al. (Reference Busch, Sangen, Vanpoucke and van Wieringen2018) reported a high correlation in Dutch-speaking children above the age of two. Studies validating CVC in languages other than American English are, however, rather limited.
Gilkerson et al. (Reference Gilkerson, Richards, Warren, Montgomery, Greenwood, Oller, Hansen and Paul2017) indicated that there may be age related differences when measuring the home language environment using the LENA system, especially for CVC and CT. Within the current sample, this might mainly be true for CVC as these correlations substantially decreased with increasing age. Different suggestions have been made by Gilkerson et al. (Reference Gilkerson, Richards, Warren, Montgomery, Greenwood, Oller, Hansen and Paul2017) as to what might be at the base of age differences (e.g., differences in sleep patterns, modelling techniques, reliability of automated voice labelling across age,…). In the current study this also remains unclear, yet a few suggestions can be made.
First, the decline in the correlations between human and LENA estimates from 5 to 14 months might indicate increasing difficulty in correctly identifying child vocalisations by the LENA system with increasing age of the key child. Table 4 shows significant and high mean difference scores at the age of 10 and 14 months, while this is not the case at the age of 5 months. LENA estimates at the age of 10 and 14 months are significantly lower than human estimates. This increasing difficulty can, on one hand, be related to a significant increase in child vocalisations up to 26 months (Gilkerson et al., Reference Gilkerson, Richards, Warren, Montgomery, Greenwood, Oller, Hansen and Paul2017). This is in line with the study of Busch et al. (Reference Busch, Sangen, Vanpoucke and van Wieringen2018) that reported significant proportional biases with regard to CVC, with higher LENA than human estimates in samples that contained many vocalisations. Stability in CVC beyond 26 months of age (Gilkerson et al., Reference Gilkerson, Richards, Warren, Montgomery, Greenwood, Oller, Hansen and Paul2017) may subsequently explain why high correlations for CVC were reported by Busch et al. (Reference Busch, Sangen, Vanpoucke and van Wieringen2018) in Dutch-speaking children older than 2 years of age. The presence of other children may, on the other hand, also explain why correlations for CVC seemed to decrease with increasing age. At the age of 5 months, vocalisations produced by the key child significantly differ from speech produced by the older sibling(s). However, with increasing age vocalisations of the key child more and more resemble those of their older sibling(s) making the distinction between different children more difficult for the LENA system.
Second, misclassification by the LENA system may also be at the base of low correlations. When visually inspecting the scatterplots at 10 and 14 months (see Figures 2 and 3), it appeared that the selected 5-min chunks in the evening of the first recording day at 10 months and the second recording day at 14 months showed a very low correlation between LENA system counts and human counts. When we excluded these 5-min chunks, correlations for both CVC (10M: r = .44, p < .001; 14M: r = .38, p < .01) and CT (10M: r = .27, p < .05; 14M: r = .35, p < .01) increased at both ages. Listening to these 5-min chunks indicated that the majority of these chunks were accidentally selected shortly before bedtime. Parents were often getting their children dressed for bedtime and putting them to bed. What most of these chunks have in common is that the vest these children wore, containing the LENA recorder in the front chest pocket, was taken off and put near the child. Consequently, the distance between the key child and the LENA recorder changed and identifying the source of the audio segment correctly might have become more difficult for the LENA software (Jones et al., Reference Jones, Skwerer, Pawar, Hamo, Carberry, Ajodan, Caulley, Silverman, McAdoo, Meyer, Yoder, Clements, Lord and Tager-flusberg2019). In addition, other children were often also present during this bedtime period whereby the LENA system might have misclassified the key child as another child or vice versa. Furthermore, a substantial amount of children alternated whining noises with vocalisations right before their bedtime. Differences between both sounds might not have been easily distinguishable by the LENA system as Xu et al. (Reference Xu, Yapanel and Gray2009) reported that the LENA algorithms correctly detected 75% of the human-identified child vocalisations but misclassified 25% of these vocalisations as fixed signals or vegetative sounds when evaluating the validity for American English. Lastly, a few parents were reading an interactive book and used motherese, characterised by a high-pitch voice, when reading to the child. As reported in the study of VanDam and Silbert (Reference VanDam and Silbert2016) and Gilkerson et al. (Reference Gilkerson, Zhang, Xu, Richards, Xu, Jiang, Harnsberger and Topping2015), it might be possible that the LENA misclassified high-pitched child-directed speech of the mother as vocalisations from the key child due to similarities in their fundamental frequencies.
Low correlation between human and LENA estimates for CT
The agreement of human estimates of CT with estimates made by the LENA system was low (correlations ranging from .19 at 10 months to .28 at 14 months), which is similar to the initial correlations reported in Chinese (r = .22) and Korean (r = −.03) (Gilkerson et al., Reference Gilkerson, Zhang, Xu, Richards, Xu, Jiang, Harnsberger and Topping2015; Pae et al., Reference Pae, Yoon, Seol, Gilkerson, Richards, Ma and Topping2016). In contrast to the Chinese and Korean sample, correlations in the current study could, however, not be increased by eliminating outliers with high amounts of overlap and/or noise. Furthermore, the current results are somewhat lower than the overall moderate correlation reported for CT in the review of Cristia et al. (r = .36; Reference Cristia, Bulgarelli and Bergelson2020a). The only studies reporting moderate (r = .52) to strong (r = .70) correlations were by Busch et al. (Reference Busch, Sangen, Vanpoucke and van Wieringen2018) in Dutch-speaking children aged 2–5 years and by Ganek and Eriks-Brophy (Reference Ganek and Eriks-Brophy2018b) in Vietnamese speaking children aged 22 to 42 months, respectively. Thus, correlations with regard to the validation of CT differ greatly. Yet, in general an overall low agreement between LENA and human CT counts is reported. In addition, the review of Cristia et al. (Reference Cristia, Bulgarelli and Bergelson2020a) suggests an under-estimation of CT counts by the LENA system which is also found in the current study, especially at the age of 5 months. Nevertheless, both under- and over-estimation by the LENA system has been reported (see Table 4). These results might thus be more in line with the proportional biases reported by Busch et al. (Reference Busch, Sangen, Vanpoucke and van Wieringen2018) suggesting that LENA's CT counts might be higher than human counts for samples with few turns and lower for samples with many turns (Busch et al., Reference Busch, Sangen, Vanpoucke and van Wieringen2018).
The manual coding on this study differed from audio processing by the LENA system on one major aspect, which may possibly explain differences regarding correlations for CT. Within the LENA algorithm, CT are only counted when they are not interrupted by another child and/or adult. Segments containing overlapping speech are not included when generating a CT count. The LENA Research foundation also suggests that overlapping speech is most likely not beneficial for language learning and exclusion of these segments might thus lead to a more accurate representation of the child's meaningful language environment (Xu et al., Reference Xu, Yapanel and Gray2009). As the LENA system cannot directly measure which speech is beneficial for language learning, this suggestion remains rather speculative. Contrary to the LENA system, human coders are able to disentangle different speakers during overlapping speech and, when transcribing natural language samples, overlapping speech is often also taken into account (e.g., Northrup & Iverson, Reference Northrup and Iverson2015). Therefore, the current study also counted CT during those segments. A certain amount of variation between human and LENA estimates might thus be due to differences in defining a CT. Unfortunately, it is not possible to calculate the correlation coefficient of CT occurring outside of overlapping segments in the current study, as this distinction was not implemented in the coding scheme. The lack of obvious differences between mean human and LENA CT estimates (see Table 4) does, however, suggest that there are other possible factors influencing the correlation between human and LENA estimates. For example, Busch et al. (Reference Busch, Sangen, Vanpoucke and van Wieringen2018) reported significant proportional biases in CT counts with higher LENA than human estimates in samples that contained few vocalisations.
Correlation between human and LENA estimates in a risk group
The LENA system has been valuable for the evaluation of vocalisations of young children with ASD and also for the differentiation of children with ASD from typically developing children based on characteristics of vocalisations or conversations (Oller et al., Reference Oller, Niyogi, Gray, Richards, Gilkerson, Xu, Yapanel and Warren2010; Warren et al., Reference Warren, Gilkerson, Richards, Oller, Xu, Yapanel and Gray2010; Yoder, Oller, Richards, Gray & Gilkerson, Reference Yoder, Oller, Richards, Gray and Gilkerson2013). Furthermore, LENA system measures have been shown to correlate with later language skills in children with a different developmental status (e.g., children with ASD or hearing loss and preterm children) (Wang, Williams, Dilley & Houston, Reference Wang, Williams, Dilley and Houston2020). However, no studies have investigated if the risk status or diagnosis of a child might affect the validity of the LENA system. The current study investigated if risk status may affect LENA system performance as the study of Jones et al. (Reference Jones, Skwerer, Pawar, Hamo, Carberry, Ajodan, Caulley, Silverman, McAdoo, Meyer, Yoder, Clements, Lord and Tager-flusberg2019) reported that the LENA system did not reliably capture the speech/language of older children and adolescents with ASD. It is, however, important to interpret the results cautiously as the current study consisted of a sample of 12 children (6 of whom were at high risk for ASD) who were followed longitudinally. Given the small sample, there is a lack of power behind declaring an authoritatively detected difference.
The current results indicate that risk status does not seem to have an influence on the LENA system performance in young children, as correlations did not significantly differ for HR-sibs and LR-sibs when performing a Fisher r-to-z transformation (AWC: z = −.91, p = .36; CVC: z = .26, p = .79; CT: z = −.77, p = .44). This suggests that there are no distinct characteristics of the speech/language or the environment of children at high risk for ASD between 5 to 14 months of age that negatively influence the algorithm of the LENA system when providing estimates of the home language environment. Thus, possible differences between both groups may not be due to measurement differences by the LENA system. The study of Jones et al. (Reference Jones, Skwerer, Pawar, Hamo, Carberry, Ajodan, Caulley, Silverman, McAdoo, Meyer, Yoder, Clements, Lord and Tager-flusberg2019), however, indicated that the LENA system did not reliably capture the speech/language of older children and adolescents with a diagnosis of ASD. Yet, Jones et al. (Reference Jones, Skwerer, Pawar, Hamo, Carberry, Ajodan, Caulley, Silverman, McAdoo, Meyer, Yoder, Clements, Lord and Tager-flusberg2019) used the LENA system in children older than age 5 (which is outside the intended scope of the LENA system) and they suggested that the speech/language of older children with ASD may be characterized by changes in voice quality which can negatively influence the automated coding procedure of the LENA system (Jones et al., Reference Jones, Skwerer, Pawar, Hamo, Carberry, Ajodan, Caulley, Silverman, McAdoo, Meyer, Yoder, Clements, Lord and Tager-flusberg2019). Consequently, this may imply that changes in voice quality of children with ASD may be more apparent with increasing age. Therefore, it is possible that the LENA system does not reliably capture the speech/language of older children and adolescents with ASD, yet does reliably capture the speech/language of younger children at risk for ASD.
Do sampling differences influence the agreement between human and LENA estimates?
First of all, the amount of AWC, CVC and CT the selected sample contains might influence agreement. Gilkerson et al. (Reference Gilkerson, Zhang, Xu, Richards, Xu, Jiang, Harnsberger and Topping2015) selected 5-min samples with the highest CT count when trying to validate the LENA system for Chinese. They, however, suggested that by selecting samples with the highest CT count they may have maximized their chances of obtaining a possible unrepresentative sample, as samples with high CT counts may contain the highest amount of mislabelled segments (Gilkerson et al., Reference Gilkerson, Zhang, Xu, Richards, Xu, Jiang, Harnsberger and Topping2015). On the other hand, samples with high AWC or CT are suggested to mainly occur in clear sections of the recording consequently containing little overlapping speech, which may bias results to a higher level of agreement (Cristia, Lavechin, Scaff, Soderstrom, Rowland, Räsänen, Bunce & Bergelson, Reference Cristia, Lavechin, Scaff, Soderstrom, Rowland, Räsänen, Bunce and Bergelson2020b). The current study tried to take this into account by randomly selecting 5-min samples containing different amounts of AWC, CVC and CT (see also Busch et al., Reference Busch, Sangen, Vanpoucke and van Wieringen2018; Canault et al., Reference Canault, Le Normand, Foudil, Loundon and Thai-Van2016; Weisleder & Fernald, Reference Weisleder and Fernald2013). Still, low correlations were found in the current study regarding CVC and CT counts. The validation study of Busch et al. (Reference Busch, Sangen, Vanpoucke and van Wieringen2018), however, indicated that, when comparing measurement methods, the sample should contain a wide range of the factors that you intend to validate. Therefore, they used a more controlled sample selection that guaranteed they had samples containing different amounts of AWC, CVC and CT covering the entire range of the counts (Busch et al., Reference Busch, Sangen, Vanpoucke and van Wieringen2018). Consequently, this may have led to the higher correlations reported in their study.
Second, the duration of the selected samples might also influence agreement between the LENA system and manual transcription. The majority of the validation studies, thus far, selected samples with a duration of 5 minutes (e.g., Busch et al., Reference Busch, Sangen, Vanpoucke and van Wieringen2018; Gilkerson et al., Reference Gilkerson, Zhang, Xu, Richards, Xu, Jiang, Harnsberger and Topping2015) or 10 minutes (e.g., Canault et al., Reference Canault, Le Normand, Foudil, Loundon and Thai-Van2016; Pae et al., Reference Pae, Yoon, Seol, Gilkerson, Richards, Ma and Topping2016). It is suggested, on the one hand, that an increase to 30 min/one hour might yield better performance of the LENA system (Canault et al., Reference Canault, Le Normand, Foudil, Loundon and Thai-Van2016; Gilkerson et al., Reference Gilkerson, Zhang, Xu, Richards, Xu, Jiang, Harnsberger and Topping2015, Reference Gilkerson, Richards, Warren, Montgomery, Greenwood, Oller, Hansen and Paul2017). On the other hand, Cristia, Lavechin, et al. (Reference Cristia, Lavechin, Scaff, Soderstrom, Rowland, Räsänen, Bunce and Bergelson2020b) indicated that speech is produced in bursts (periods of silence followed by conversation and on their turn followed by silence again) rather than at a periodic rate. Therefore the authors suggested to keep a fixed total length of selected audio, yet select shorter samples (1–2 min). This may tend more to capture heterogeneity in audio samples suggesting better generalisation than longer samples that will be more internally homogeneous (Cristia, Lavechin, et al., Reference Cristia, Lavechin, Scaff, Soderstrom, Rowland, Räsänen, Bunce and Bergelson2020b).
Third, different sample environments might also be at the basis of low agreement. Performing a validation study containing samples of a more controlled and quiet environment might hold better results although this may not be representative for LENA system performance in natural settings. Recordings for the Korean sample were, for example, partly made during play and picture book reading in a hospital (Pae et al., Reference Pae, Yoon, Seol, Gilkerson, Richards, Ma and Topping2016). The more controlled environment in the study of Pae et al. (Reference Pae, Yoon, Seol, Gilkerson, Richards, Ma and Topping2016) is in contrast with the naturalistic recordings of the current study in which often other children and/or other family members were present. As indicated by Gilkerson et al. (Reference Gilkerson, Zhang, Xu, Richards, Xu, Jiang, Harnsberger and Topping2015) and Pae et al. (Reference Pae, Yoon, Seol, Gilkerson, Richards, Ma and Topping2016), high amounts of overlapping speech and/or noise may have an influence on the agreement between human and LENA estimates. Within the current study no outliers regarding overlapping speech and or noise were, however, detected. Nevertheless, the validation study in European French was also recorded within the natural environments of the children assuring high ecological validity, yet they sometimes reported higher correlations than the current study (Canault et al., Reference Canault, Le Normand, Foudil, Loundon and Thai-Van2016).
In conclusion, careful thought should be given to sample selection in validation studies. Both the amount of AWC, CVC and CT that they contain and the duration of the selected samples should be taken into account. A broad range of samples should be selected with regard to the measures that the study intends to validate. The current study tried to do this in a semi-randomized matter, yet a more controlled way (see Busch et al., Reference Busch, Sangen, Vanpoucke and van Wieringen2018) might hold better results. With regard to the sample duration, both an increase and a decrease in duration have been suggested. Further research is necessary in order to determine which strategy might be best in light of validation studies. Lastly, researchers should also take into account that the recording environment (e.g., a natural versus a controlled environment) might influence validation results. The LENA system was, however, intended for use in natural environments.
Implications
A child's vocabulary development is, amongst others, predicted by the number of word learning trials (e.g., language input) the child is exposed to and by the number of conversational turns between the child and a caregiver (Huttenlocher et al., Reference Huttenlocher, Haight, Bryk, Seltzer and Lyons1991; Ratner, Reference Ratner2013; Wang et al., Reference Wang, Hartman, Aziz, Arora, Shi and Tunison2017; Zimmerman et al., Reference Zimmerman, Gilkerson, Richards, Christakis, Xu, Gray and Yapanel2009). The current results suggest that the LENA system can be used to measure the amount of language input but not the amount of child vocalisations and conversational turns within the home language environment of Dutch-speaking families of very young children. Researchers, clinicians and parents should, however, bear in mind that mainly speech directed to the child and not overheard adult conversations contribute to a child's vocabulary development (Ratner, Reference Ratner2013; Weisleder & Fernald, Reference Weisleder and Fernald2013). The LENA system is currently not able to determine the amount of child-directed versus overheard speech; thus, the LENA output regarding adult language input should be interpreted with caution. In addition, the LENA system only measures the amount of language input and not the quality (e.g., richness, complexity). Nevertheless, it should be noted that the LENA system has an added value for conducting very naturalistic recordings of the home language environment. Due to the fact that the child is wearing a comfortable vest in which a light recording device is present, both parent and child are quickly accustomed to the recording situation and may forget that they are being recorded. Consequently, this leads to ecologically valid and natural recordings.
Strengths and limitations
An important strength of this study is the considerable amount (18 hours) of LENA recording data from 12 children that was coded by human coders. This makes the current study the second largest validation study in a language other than American English. Despite that, an issue of nonindependence has to be raised as the total amount of chunks that were coded consisted of multiple chunks of the same child. This indicates that paired sample t-tests, Pearson correlations and Fisher r-to-z transformations were conducted on nonindependent data that may have influenced the results. Furthermore, correlations indicate the strength of linear association and not agreement (Busch et al., Reference Busch, Sangen, Vanpoucke and van Wieringen2018). Together with the fact that the exact meaning of correlations cannot merely be interpreted based on the correlation coefficient (Bosco et al., Reference Bosco, Aguinis, Singh, Field and Pierce2015; Taylor, Reference Taylor1990), strong conclusions regarding the validity of the LENA system cannot be made when they are based purely on correlations. In addition, Busch et al. (Reference Busch, Sangen, Vanpoucke and van Wieringen2018) indicated that correlations do not take into account systematic biases that may occur between methods. LENA recordings took place within a longitudinal prospective study following LR-sibs and HR-sibs which resulted in the ability to gather longitudinal data of these children. This, however, limited us in gathering recordings at broader age ranges, as recordings were scheduled near assessment appointments. Generalizability of the current results is thus limited to the reported age range of the current study (5 to 14 months). Lastly, comparisons of conversational turns were difficult as the current study counted these turns differently from the LENA algorithm. Within the current study it was decided to count conversational turns as we would normally do when transcribing natural language.
Conclusion
In conclusion, current results suggest that the LENA system can accurately assess the amount of adults’ words but not conversational turns in Dutch-speaking families. With regard to the amount of child vocalisations, the LENA system appears to be moderately accurate at 5 months but its accuracy seems to decrease with age. At the age of 14 months substantial differences are reported between LENA system estimates and human estimates. Thus, the LENA system can be used in Dutch-speaking families within the home language environment when evaluating the amount of adult words spoken near the key child but not the amount of vocalisations by the key child, nor the conversational turns between an adult and the key child.