1. INTRODUCTION
Laser technology makes it possible now to generate extremely short (femtosecond) and intense (>1022 W/cm2) laser pulses (Mourou et al., Reference Mourou, Tajima and Bulanov2006; Borghesi et al., Reference Borghesi, Kar, Romagnani, Toncian, Antici, Audebert, Brambrink, Ceccherini, Cechetti, Fuchs, Galimberti, Gizzi, Grismayer, Liseykina, Jung, Macchi, Mora, Osterholtz, Schiavi and Willi2007), and considerable attention has been given in recent years to the problem of thin foil targets irradiated by high intensity laser pulses. The interaction of such pulses with matter introduces new phenomena and important literature has been published in the last decade dedicated to the experimental and theoretical investigation of this problem (see for instance, Schaumann et al., Reference Schaumann, Schollmeier, Rodriguez-Prieto, Blazevic, Brambrink, Geissel, Korostiy, Pirzadeh, Roth, Rosmej, Faenov, Pikuz, Tsigutkin, Maron, Tahir and Hoffman2005; Robson et al., Reference Robson, Simpson, Clarke, Ledingham, Lindau, Lundh, McCanny, Mora, Neely, Wahlström, Zepf and McKenna2007; Liseykina et al., Reference Liseykina, Borghesi, Macchi and Tuveri2008; Klimo et al., Reference Klimo, Psikal, Limpouch and Tikhonchuk2008; Schlegel et al., Reference Schlegel, Naumova, Tikhonchuk, Labaune, Sokolov and Mourou2009; Robinson et al., Reference Robinson, Gibbon, Zepf, Kar, Evans and Bellei2009; Kasperczuk et al., Reference Kasperczuk, Pisarczyk, Demchenko, Gus'kov, Kalal, Ullschmied, Krousky, Masek, Pfeifer, Rohlena, Skala and Pisarczyk2009). Promising applications in a variety of areas in physics, medicine, and more recently in ion-driven fast ignition (see for instance, Hegelich et al., Reference Hegelich, Albright, Cobble, Flippo, Letzring, Paffet, Ruhl, Schreiber, Schulze and Fernandez2006; Fernandez et al., Reference Fernandez, Honrubia, Albright, Flippo, Gautier, Hegelich, Schmitt, Temporal and Yin2009) have been extensively discussed.
Recent experimental results have shown the advantage of thin targets for collimated ion acceleration, when normally incident high intensity circularly polarized laser beams are used (Kar et al., Reference Kar, Borghesi, Bulanov, Key, Liseykina, Macchi, Mackinnon, Patel, Romagnani, Schiavi and Willi2008; Henig et al., Reference Henig, Steinke, Schnürer, Sokollik, Hörlein, Kiefer, Jung, Schreiber, Hegelich, Yan, Meyer-terVehn, Tajima, Nickels, Sandner and Habs2009; Prasad et al., Reference Prasad, Andreev, Ter-Avetisyan, Doria, Quinn, Romagnani, Brenner, Carroll, Dover, Neely, Foster, Gallegos, Green, McKenna, Najmudin, Palmer, Schreiber, Streeter, Tresca, Zepf and Borghesi2011). The thickness of the target appears to be a key factor in the production of plasma jets. Here, we present numerical simulations with a one-dimensional (1D) model using an Eulerian Vlasov code to solve the relativistic Vlasov-Maxwell equations, and to study the radiation pressure acceleration of ions when a high intensity circularly polarized laser beam is normally incident on the surface of a plasma target, when the thickness of the target is reduced from several skin depths c/ωpe, down to a thickness of the order of c/ωpe (ωpe is the electron plasma frequency and c the velocity of light). In the case of a circular polarization of the laser beam, there is a non-oscillatory radiation pressure applied at the target surface by the incident laser wave. This radiation pressure has a dominant role in the ion acceleration and the plasma jet formation processes. It pushes the electrons at the plasma surface producing a sharp density gradient at the surface of the target. There is a build-up of the electron density at this surface, which creates a large space-charge, giving rise to a longitudinal electric field. This electric field at the wave-front plasma-edge interface accelerates the ions at the surface of the target in the forward direction, and leads to the formation of plasma jets. Results previously reported in 1D for this problem using an Eulerian Vlasov code for the numerical solution of the relativistic Vlasov-Maxwell equations ( Shoucri et al., Reference Shoucri, Afeyan and Charbonneau-Lefort2008; Reference Shoucri, Lavocat-Dubuis, Matte and Vidal2010; Reference Shoucri, Lavocat-Dubuis, Matte and Vidal2011; Shoucri & Afeyan, Reference Shoucri and Afeyan2010), have considered the case of thick high density targets (with n/n cr = 100, where the critical density n cr = 1.1 × 10²¹λ0−2cm−3, λ0 is the laser wavelength in microns), where the thickness of the target was of the order of several skin depths c/ωpe. It is the purpose of the present work to investigate the cases when the thickness of the target is reduced. Results show that in this case there is an increase in the velocity of the accelerated ions, in qualitative agreement with experimental observations (Kar et al., Reference Kar, Borghesi, Bulanov, Key, Liseykina, Macchi, Mackinnon, Patel, Romagnani, Schiavi and Willi2008; Henig et al., Reference Henig, Steinke, Schnürer, Sokollik, Hörlein, Kiefer, Jung, Schreiber, Hegelich, Yan, Meyer-terVehn, Tajima, Nickels, Sandner and Habs2009; Prasad et al., Reference Prasad, Andreev, Ter-Avetisyan, Doria, Quinn, Romagnani, Brenner, Carroll, Dover, Neely, Foster, Gallegos, Green, McKenna, Najmudin, Palmer, Schreiber, Streeter, Tresca, Zepf and Borghesi2011; Qiao et al., Reference Qiao, Geissler, Kar, Borghesi and Zepf2011).
In a previous recent publication, a case with n cr = 25 has been studied (Shoucri, Reference Shoucri2012), and it was observed that a reduction in the target thickness resulted in an increase in the velocity of the accelerated ion bunch and of the plasma jet. However, the case of a very thin target (of the order of the skin depth c/ωpe) was not considered. The case of a high density with n cr = 100 is of interest, because under the condition of an intense laser beam incident on a solid target, the solid target ionizes very rapidly, in a few cycles of the light wave, and the laser beam interacts directly with plasma with a very high density. In the present work, we present results for three different simulations obtained for the same laser beam intensity (the normalized amplitude of the vector potential of the incident laser beam is  $a_0=25/\sqrt 2$), but with different target thicknesses. A first simulation, where the target thickness (the flat uniform density plasma thickness) is L p = 5.1c/ωpe, has been performed. Results in this case are similar to the thick target cases in Macchi et al. (Reference Macchi, Cattani, Liseykina and Cornolti2005), Liseikina and Macchi (Reference Liseikina and Macchi2007), Klimo et al. Reference Klimo, Psikal, Limpouch and Tikhonchuk2008, Shoucri et al. (Reference Shoucri, Afeyan and Charbonneau-Lefort2008; Reference Shoucri, Lavocat-Dubuis, Matte and Vidal2010; Reference Shoucri, Lavocat-Dubuis, Matte and Vidal2011), Shoucri and Afeyan (Reference Shoucri and Afeyan2010), and Shoucri (Reference Shoucri and Shoucri2010). A second simulation where the target thickness is L p = 2.8c/ωpe is presented, and the evolution of the system shows the transformation of the target into a double layer structure before the formation of the plasma jet. A third simulation where the target thickness is reduced to L p = 1.46c/ωpe is presented, and shows the formation of a solitary-like structure before the formation of the plasma jet. The cases of the thinner targets show acceleration of the ions to higher velocities, which seems to agree qualitatively with the experimental observations (Kar et al., Reference Kar, Borghesi, Bulanov, Key, Liseykina, Macchi, Mackinnon, Patel, Romagnani, Schiavi and Willi2008; Andreev et al., Reference Andreev, Lévy, Ceccotti, Thaury, Platonov, Loch and Martin2008; Henig et al., Reference Henig, Steinke, Schnürer, Sokollik, Hörlein, Kiefer, Jung, Schreiber, Hegelich, Yan, Meyer-terVehn, Tajima, Nickels, Sandner and Habs2009; Prasad et al., Reference Prasad, Andreev, Ter-Avetisyan, Doria, Quinn, Romagnani, Brenner, Carroll, Dover, Neely, Foster, Gallegos, Green, McKenna, Najmudin, Palmer, Schreiber, Streeter, Tresca, Zepf and Borghesi2011; Qiao et al., Reference Qiao, Geissler, Kar, Borghesi and Zepf2011). So the three cases show substantial differences in the evolution toward the formation of a neutral plasma jet, and in the evolution of the corresponding phase-space structures of the distribution functions. In particular, in the case when the target thickness is L p = 1.46c/ωpe, of the order of the skin depth, the laser field does not significantly decay within the foil, and there is a transmitted field and electrons ejected that appear to leak from the back of the target and to be accelerated in this transmitted field (a regime called “leaky light sail radiation pressure acceleration regime” in Qiao et al. (Reference Qiao, Geissler, Kar, Borghesi and Zepf2011)). The absence of noise in the Eulerian Vlasov code (Shoucri, Reference Shoucri and Shoucri2010) allows an accurate representation of the phase-space of the distribution functions. In the different simulations that we present, we consider the case when the free space wavelength of the laser beam λ is much greater than the initial scale length L edge of the ramp in the plasma density at the target surface (λ≫L edge).
2. THE RELEVANT EQUATIONS OF THE EULERIAN VLASOV CODE AND THE NUMERICAL METHOD
The relevant equations for the problem we are studying have been presented previously (see for instance Shoucri et al., Reference Shoucri, Afeyan and Charbonneau-Lefort2008; Reference Shoucri, Lavocat-Dubuis, Matte and Vidal2010; Reference Shoucri, Lavocat-Dubuis, Matte and Vidal2011; Shoucri Reference Shoucri and Shoucri2010; Reference Shoucri2012). We rewrite these equations in order to fix the notation. Time t is normalized to the inverse laser wave frequency ω−1, length is normalized to l 0 = cω−1, velocity and momentum are normalized, respectively, to the velocity of light c and to M ec, where M e is the electron mass. The 1D Vlasov equations for the electrons and ions distribution functions f e,i(x,p xe,i,t) verify the relation:
 $$\displaystyle{{\partial f_{e\comma i} } \over {\partial t}}+\displaystyle{{\,p_{xe\comma i} } \over {m_{e\comma i} {\rm \gamma} _{e\comma i} }}\displaystyle{{\partial f_{e\comma i} } \over {\partial x}}+\left({ \mp E_x - \displaystyle{1 \over {2m_{e\comma i} {\rm \gamma} _{e\comma i} }}\displaystyle{{\partial a_ \bot ^2 } \over {\partial x}}} \right)\displaystyle{{\partial f_{e\comma i} } \over {\partial p_{xe\comma i} }}=0\comma \;$$
where
 $${\rm \gamma} _{e\comma i}=\left({1+\left({\,p_{xe\comma i}^{} /m_{e\comma i} } \right)^2+\left({a_ \bot /m_{e\comma i} } \right)^2 } \right)^{1/2}.$$
The upper sign in Eq. (1) is for the electron equation and the lower sign for the ion equation, and subscripts e and i denote electrons and ions, respectively. In our normalized units m e = 1, and m i = M i/M e is the ratio of ion to electron masses. The longitudinal electric field E x is calculated from Ampére's law:
 $$\displaystyle{{\partial E_x } \over {\partial t}}=- J_x \comma \; \quad \quad J_x=\vint\nolimits_{ - \infty }^{+\infty } {\displaystyle{{\,p_{xi} } \over {m_i {\rm \gamma} _i }}} f_i dp_{xi} - \vint\nolimits_{ - \infty }^{+\infty } {\displaystyle{{\,p_{xe} } \over {m_e {\rm \gamma} _e }}} f_e dp_{xe}.$$
The transverse electric field  $ {\mathop{E} \limits^{\rightharpoonup}}_{\bot} $ is calculated from the relations:
 $$ {\mathop{E} \limits^{\rightharpoonup}}_{\bot}=- \displaystyle{{\partial {\mathop{a} \limits^{\rightharpoonup}}_{\bot}} \over {\partial t}}\comma \;$$
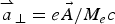 ${\mathop{a} \limits^{\rightharpoonup}}_{\bot}=e\vec A/M_e c$ is the normalized vector potential.
The transverse electromagnetic fields E y, B z and E z, B y for the circularly polarized wave obey Maxwell's equations. With E ± = E y ± B z and F ± = E z ± B y, we write these equations in the following form:
 $$\left({\displaystyle{\partial \over {\partial t}} \pm \displaystyle{\partial \over {\partial x}}} \right)E^ \pm=- J_y \comma \; \quad \quad \left({\displaystyle{\partial \over {\partial t}} \mp \displaystyle{\partial \over {\partial x}}} \right)F^ \pm=- J_z\comma \; $$
which are integrated along their vacuum characteristics x = t. In our normalized units, we have the following expressions for the normal current densities:
 $${\mathop{J} \limits^{\rightharpoonup}}_{\bot}={\mathop{J} \limits^{\rightharpoonup}}_{\bot e}+{\mathop{J} \limits^{\rightharpoonup}}_{\bot i}\comma \; \quad \quad {\mathop{J} \limits^{\rightharpoonup}}_{ \bot e\comma i}=- \displaystyle{{{\mathop{a} \limits^{\rightharpoonup}}_{\bot}} \over {m_{e\comma i} }}\vint\nolimits_{ - \infty }^{+\infty } {\displaystyle{{\,f_{e\comma i} } \over {{\rm \gamma} _{e\comma i} }}} dp_{xe\comma i}.$$
The relevant equations are solved numerically using an Eulerian Vlasov code. The numerical scheme applies a direct solution method of the Vlasov equation as a partial differential equation in phase-space. This method has become an important method for the numerical solution of the Vlasov equation. The numerical scheme is based on a two-dimensional advection technique, of second-order accuracy in the time-step, where the value of the distribution function is advanced in time by interpolating in two-dimensional along the characteristics using a tensor product of cubic B-splines (Shoucri, Reference Shoucri2008a; Reference Shoucri2008b; Reference Shoucri, Colombo and Rizzo2009; Reference Shoucri and Shoucri2010; Shoucri et al., Reference Shoucri, Gerhauser and Finken2003). Recent comparison presented in Shoucri et al. (Reference Shoucri, Lavocat-Dubuis, Matte and Vidal2010; Reference Shoucri, Lavocat-Dubuis, Matte and Vidal2011) between this code and a particle-in-cell (PIC) code (Gibbon & Bell, Reference Gibbon and Bell1992) in the case of a thick target, for the problem of ion acceleration and plasma jets formation when a circularly polarized laser beam is normally incident on the surface of an over-dense plasma, has shown good agreement between the macroscopic quantities calculated with both codes. The Vlasov code, however, gave a more accurate representation of the phase-space structure of the distribution functions. Interest in Eulerian grid-based solver associated with the method of characteristics for the numerical solution of the Vlasov equation arises from the absence of noise associated with these codes, which allows the accurate study of the different density regions of the phase-space (Shoucri, Reference Shoucri2012). We mention also several other applications of Eulerian Vlasov codes to this specific problem of the interaction of a laser beam incident on an over-dense plasma (Ruhl et al., Reference Ruhl and Mulser1995; Macchi et al., Reference Macchi, Cattani, Liseykina and Cornolti2005; Eliasson et al., Reference Eliasson, Liu, Shao, Sagdeev and Shukla2009).
3. RESULTS
For all the cases considered, we have a forward-propagating circularly polarized laser beam entering the system at the left boundary (x = 0), where the forward-propagating fields are E + = 2E 0P r(t)cos(τ) and F − = −2E 0P r(t)sin(τ), E + and F − are defined in Eq. (4). In these expressions, τ = t − 1.5t p and t p = 12 (i.e., slightly less than two laser periods) is the pulse duration (full width at half maximum) of the beam intensity. Time is in units of ω−1. In our normalized units, E 0 = a 0. For a Gaussian time dependence, the shape factor P r(t) is given by:
 $$P_r \lpar t\rpar =\exp \lpar \!\!- 2\ln \lpar 2\rpar \lpar {\rm \tau} /t_p \rpar ^2 \rpar .$$
The forward-propagating laser beam behaves as a Gaussian pulse in time, which reaches its peak at t = 1.5t p = 18. The units of time and space can be easily translated into units of ωpe−1 and c/ωpe by multiplying them by a factor of 10, since in our calculations ωpe/ω = 10, which corresponds to n 0/n cr = 100.
A characteristic parameter of high-power laser beams is the normalized vector potential or quiver momentum 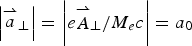 $\left\vert {\mathop{a} \limits^{\rightharpoonup}}_{\bot}\right\vert = \left\vert {e{\mathop{A} \limits^{\rightharpoonup}}_{\bot} /M_e c} \right\vert =a_0 $, where
 ${\mathop{A} \limits^{\rightharpoonup}}_ {\bot} $ is the vector potential of the wave. We chose
 $a_0=25/\sqrt 2 $ for the three simulations. For a circularly polarized wave
 $2a_0^2=I{\rm \lambda} _0^2 /1.368{\rm x10}^{{\rm 18}}$, where I is the intensity in Wcm−2 and λ0 is the laser wavelength in microns. Deuterium plasma is used with M i/M e = 2 × 1836, where M i is the deuterium mass. The initial distribution functions for electrons and ions are Maxwellian with temperatures T e = 1 keV for the electrons and T i = 0.1 keV for the ions.
3.1. The Case of a Plasma Slab with L p = 5.1c/ωpe
This case is equivalent to a thick plasma slab, similar to what has been previously presented in Macchi et al. (Reference Macchi, Cattani, Liseykina and Cornolti2005), Klimo et al. (Reference Klimo, Psikal, Limpouch and Tikhonchuk2008), Liseikina and Macchi (Reference Liseikina and Macchi2007), Shoucri et al. (Reference Shoucri, Afeyan and Charbonneau-Lefort2008; Reference Shoucri, Lavocat-Dubuis, Matte and Vidal2010; Reference Shoucri, Lavocat-Dubuis, Matte and Vidal2011), Shoucri and Afeyan (Reference Shoucri and Afeyan2010), and Shoucri (Reference Shoucri and Shoucri2010). We present these results here to facilitate comparison with the results to be presented in Sections 3.2 and 3.3. We use N = 6000 points in space, and in momentum space we use 1400 grid points for the electrons and 7000 for the ions (the extreme of the electron and ion momentum are ±4 and ±350, respectively). The length of the system is L = 6 in units c/ω. From these parameters we have a grid spacing Δx = 0.001 and we use a time-step Δt = Δx. We have a vacuum region of length L vac = 4.597 on the left side in front of the plasma slab. The steep ramp in density at the plasma edge on each side of the uniform flat top density of the slab target has a length L edge = 0.15. The length of the plasma slab, with a flat top density of 1 (normalized to 100n cr) is L p = 0.51 (or 5.1 in terms of c/ωpe), and the length of the vacuum region to the right of the slab is 0.593, for a total length of L = 6. The target thus extends initially from 4.597 to 5.407, with a plateau between 4.747 to 5.257. Note that the vacuum region to the right of the slab is taken to be small, since for the parameters we are studying, there is essentially no penetration of the plasma or electromagnetic fields in this region. In our units the skin depth c/ωpe = (c/ω)(ω/ωpe) = 0.1c/ω, so the length of the plasma slab is L p ≈ 5.1 skin depths c/ωpe. In free space ω = k for the electromagnetic wave, and as λ = 2π, the condition that λ≫L edge is well satisfied.
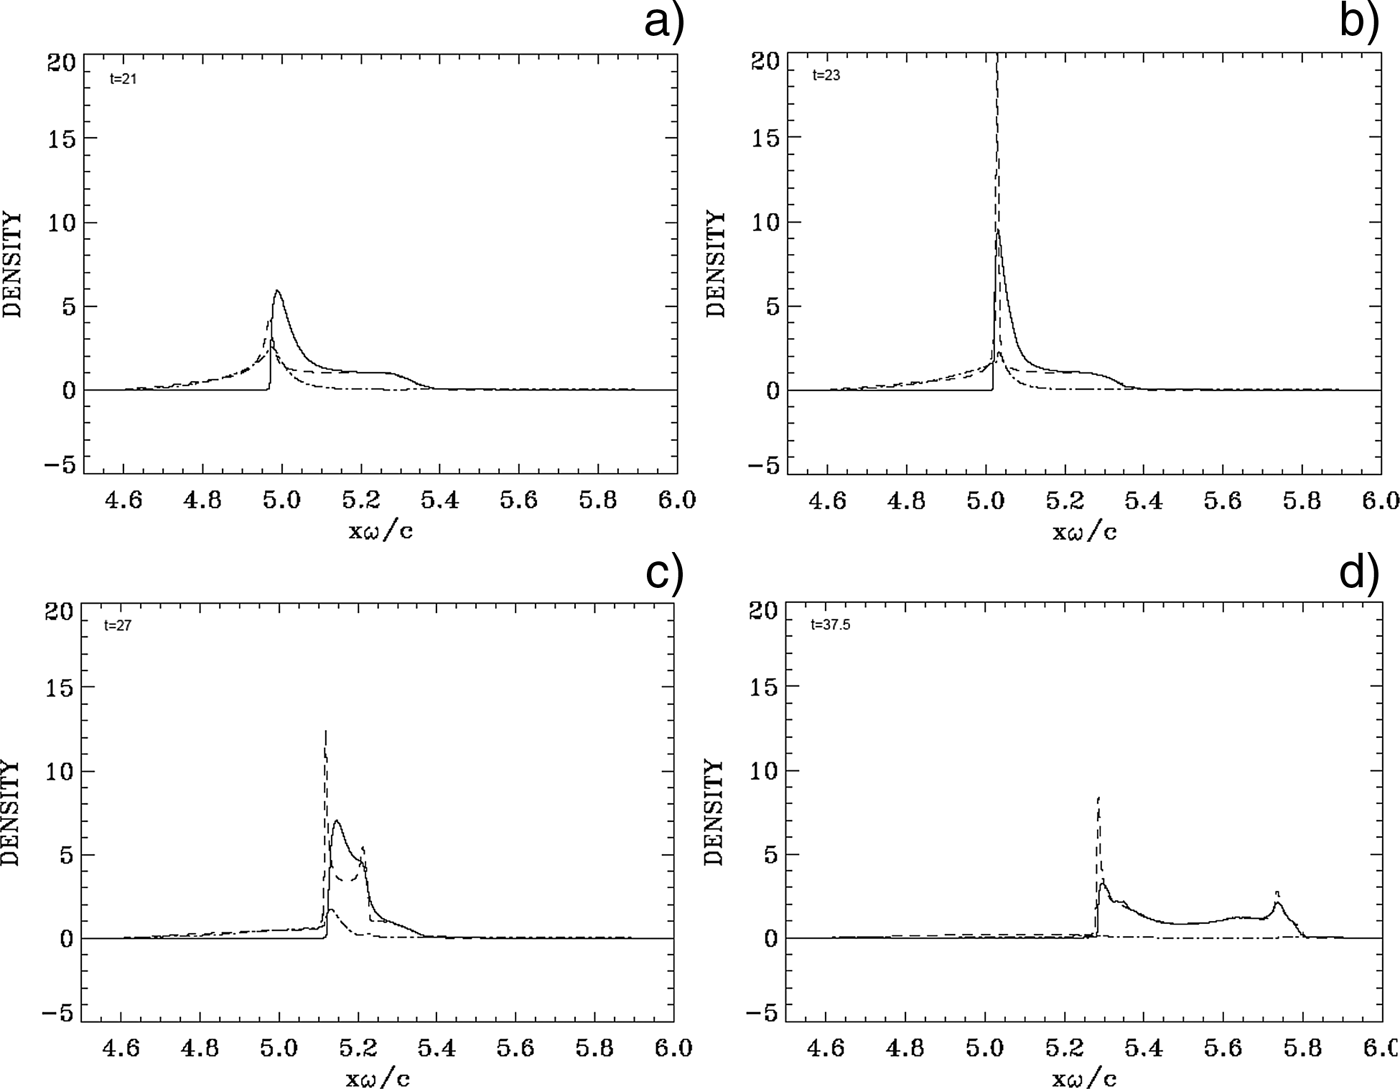
At the beginning, there is no movement in the initial neutral plasma slab. We note from Eq. (6) that the laser intensity reaches a peak at a time 1.5t p = 18 at the boundary x = 0. This peak has to travel a distance of about x ≈ 5 to reach the target surface (see the position of the edge in Fig. 1a). So the maximum laser intensity will reach the target surface at about t ≈ 23, i.e., about the time we observe the strong acceleration of the ions at the target surface in Figure 1b. We present in Figure 1 the electron and ion density profiles at times t = 21, 23, 27, and 37.5 (time is in unit of ω−1, full curves for the electrons and dashed curves for the ions). The electric field (dashed-dotted curves) is also plotted (divided by a factor of 10 to display it on the same scale). We concentrate these plots on the region of the slab, since otherwise on both sides we have vacuum. In Figure 1a at t = 21, when the intensity of the laser pulse reaching the target surface starts increasing, electrons are pushed and accelerated at the wave-front plasma-edge interface under the effect of the radiation pressure and form a steep density spike. Due to the radiation pressure at the plasma surface, there is a charge separation which forms, and its penetration in the plasma at the sharp gradient at the surface of the target in Figure 1a is of the order of 0.1c/ω, which is the value of the skin depth in our normalized units as mentioned previously. An electric field is formed at the target surface due to the charge separation appearing there. Then, very rapidly, there is a huge jump in the ion density at the target surface, as shown in Figure 1b at t = 23 (when the laser pulse intensity at the target surface is reaching its peak), reaching an ion density peak of about 20. This rapid build-up of the ion density at the target surface has been reported and discussed in several publications (Macchi et al., Reference Macchi, Cattani, Liseykina and Cornolti2005; Reference Macchi, Veghini, Liseykina and Pegoraro2010; Shoucri et al., Reference Shoucri, Afeyan and Charbonneau-Lefort2008; Reference Shoucri, Lavocat-Dubuis, Matte and Vidal2010; Reference Shoucri, Lavocat-Dubuis, Matte and Vidal2011; Shoucri & Afeyan, Reference Shoucri and Afeyan2010; Shoucri, Reference Shoucri and Shoucri2010). Now the laser ponderomotive force is pushing the electrons forward, and the restoring force of the space charge electric field is keeping the ion and electron peaks close to each other. Ions are also accelerated on the inner side of the target surface, to follow the expanding electrons. In Figures 1c–1d, we see the electrons and the ions expanding to the right. There is a shock-like structure appearing on the right of the expanding neutral plasma, and propagating to the right, with the electrons neutralizing the ions in what appears to be a neutral plasma jet. In Figure 1d, the electron peak and the ion peak at the front of the plasma target are slowly decaying while the neutral plasma is expanding to the right. At the target surface the radiation pressure is also slowly decaying due to the decay of the laser pulse, together with the electric field balancing the ponderomotive force, and the peak at the target surface moves very slowly under the combined effects of the ponderomotive force and the longitudinal electric field. This result is in agreement with several simulations with different parameters for thick plasma targets (i.e., thickness is several times the skin depth) previously presented (Shoucri & Afeyan, Reference Shoucri and Afeyan2010; Shoucri, Reference Shoucri and Shoucri2010; Reference Shoucri2012; Shoucri et al., Reference Shoucri, Lavocat-Dubuis, Matte and Vidal2010; Reference Shoucri, Lavocat-Dubuis, Matte and Vidal2011).
Electron (full curves) and ions (dashed curves) density profiles (in units of 100n cr). The electric field (dashed-dotted curves, divided by a factor of 10). Plots at: (a) t = 21, (b) t = 23, (c) t = 27, (d) t = 37.5.

Figure 2 shows the phase-space contour plots of the ion distribution function at t = 23 (during the rapid acceleration of the ions at the target surface presented in Fig. 1b) and 37.5, when the neutral plasma jet is formed, and ions have stopped accelerating. The ions reach a peak in momentum of about 200. Figure 3 shows a zoom around this maximum of the contour plot in Figure 2b. For the maximum momentum M iυ/M ec ≈ 200 or υ/c ≈ 200/(2 × 1836) = 0.054. The same value for the velocity can be calculated following the edge of the shock-like structure of the neutral plasma bump, which is free-streaming at the right in Figures 1c and 1d. By simple inspection in Figure 1c, the edge of the shock-like structure expanding to the right is at about 5.25 at t = 27, and at x ≈ 5.8 at t = 37.5. This corresponds to an average velocity υ/c ≈ (5.8−5.25)/(37.5−27) = 0.052, in good agreement with what has been calculated above from the value of the maximum momentum. This corresponds to an energy of the deuterium ions of M iυ2/2 = M ic 2 (υ/c)2/2 = 938 × 0.003 = 2.78 MeV.
(Color online) Phase-space plots of the ion distribution function. Plots at: (a) t = 23, (b) t = 37.5.
(Color online) Zoom of the top of the plot in Figure 2b at t = 37.5.
In Figure 4, we present the phase-space contour plots of the electron distribution function at t = 17, 23, 30, and 37.5. The steep electron edge which is observed at the target surface in Figure 4a at t = 17 and Figure 4b at t = 23 is due to the effect of the radiation pressure of the wave, which is pushing the electrons at the target surface. Figure 4b at t = 23 corresponds to the time where we observe the rapid acceleration of the ions at the target surface, mentioned in Figure 1b. Note the rapid heating of the electron distribution function at the target surface in Figures 4a–4c. As the electromagnetic field has a circular polarization, the ponderomotive force is not oscillating at twice the laser frequency, as would be the case for linear polarization. Nonetheless, the temporal variation of the electromagnetic –field is very rapid as the full width at half maximum is less than twice the laser period (see Eq. (6)). More importantly, the longitudinal electric field builds up very rapidly in time at the plasma-vacuum-interface. This means that two electrons arriving there at very slightly different times have seen very different force fields, and hence different accelerations.
(Color online) Phase-space plots of the electron distribution function. Plots at: (a) t = 17, (b) t = 23, (c) t = 30, (d) t = 37.5. Note the heating of the distribution function in figures (a)–(c).
In Figure 4c at t = 30, the peak at the right is for the electrons propagating in the neutral plasma jet expanding and moving away from the back of the target in the forward direction, providing a population which is neutralizing the ion beam. The calculation is stopped at t = 37.5, when the incident laser pulse is still exerting a small pressure on the surface of the target, balanced by a small electric field. We have a situation where the decreasing pressure of the wave at the left is essentially balanced by the decreasing electric field at what used to be the target surface, maintaining the left boundary essentially very close to an equilibrium position at x ≈ 5.3. The right peak in Figure 4d corresponds to the shock structure propagating to the right in Figure 1d. The ions in the neutral plasma jet are free streaming and are not accelerating any more.
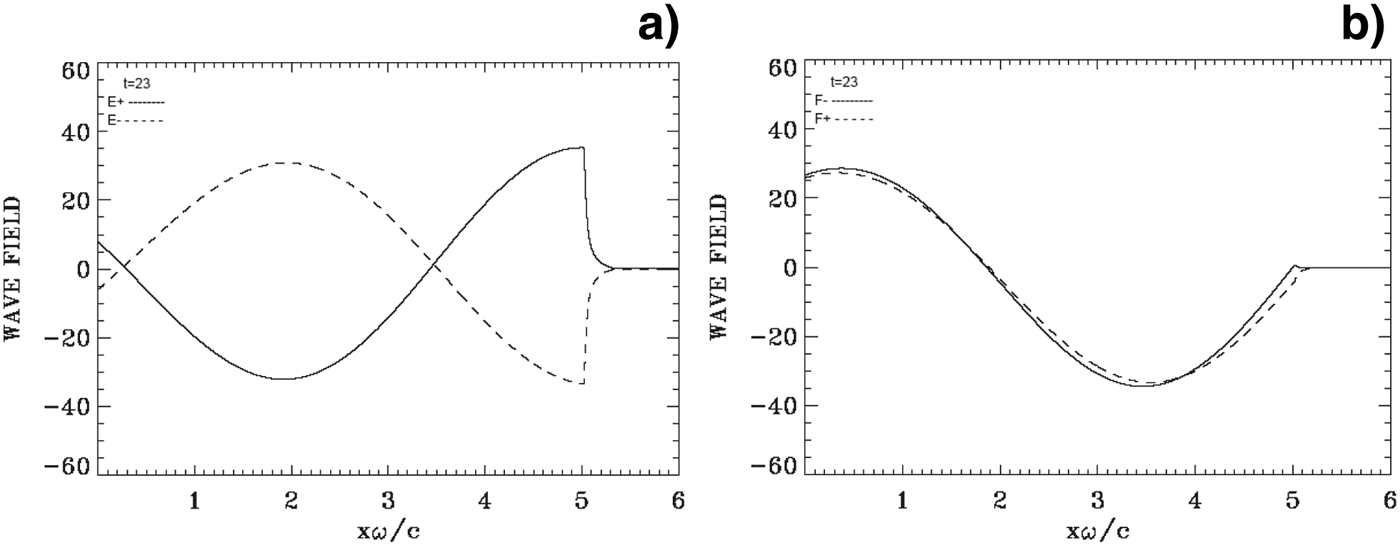
Figure 5 presents on the left the forward propagating wave E + (full curves, see Eq. (4) for definitions) and the backward reflected wave E − (dashed curves), and on the right the corresponding results for the forward propagating wave F − (full curves), and the backward propagating wave F + (dashed curves). These curves are calculated at t = 23, at the time of the rapid acceleration of the ions at the target surface observed in Figure 1b. We note that the maximum of the incident wave E + (full curve, on the left) is very close to the peak of the laser pulse at t = 23 as previously mentioned. The electromagnetic wave damps in the plasma over a distance of the order of the skin depth c/ωpe, equal to 0.1 in our normalized units as previously discussed (there is no penetration in this case of the electromagnetic wave through the target). The strong initial increase of the ion and electron densities at the wave-front plasma-edge interface makes the plasma more opaque, with the steep plasma edge acting as a moving mirror for the incident light, but the relativistic mass increase due to the very intense laser field (Macchi et al., Reference Macchi, Cornolti, Pegoraro, Liseikina, Ruhl and Vshivkov2001) decreases the effective ωpe, and thus tends to have the opposite effect. Note also that when E + is at a peak value, F − is zero, and vice-versa.
Incident waves E + and F − (full curves) and reflected waves E − and F + (dashed curves) at t = 23. In this case the penetration of the electromagnetic wave at the plasma surface is of the order of the skin depth.
3.2. The Case of a Plasma Slab with L p = 2.86c/ωpe
We use N = 5000 grid points in space, and in momentum space we use 1400 grid points for the electrons and 7000 grid points for the ions (extreme of the electron momentum are ±4 and ±350 for the ion momentum). The length of the system is L = 10 in units of c/ω. From these parameters we have grid spacing Δx = 0.002 and we use a time-step Δt = Δx. We have a vacuum region of length L vac = 4.71 on either side of the plasma slab. The steep ramp in density at the plasma edge on each side of the uniform flat top density of the slab target has a length L edge = 0.15. The length of the central plasma target slab, with a flat top density of 1 (normalized to 100n cr) is L p = 0.286 (or 2.86 in terms of the skin depth c/ωpe), for a total length of 10. Note in the present case that the plasma target slab is centered in the domain of length L = 10. The initial plasma slab extends from 4.71 to 5.296 and the plateau region is between 4.86 and 5.146.
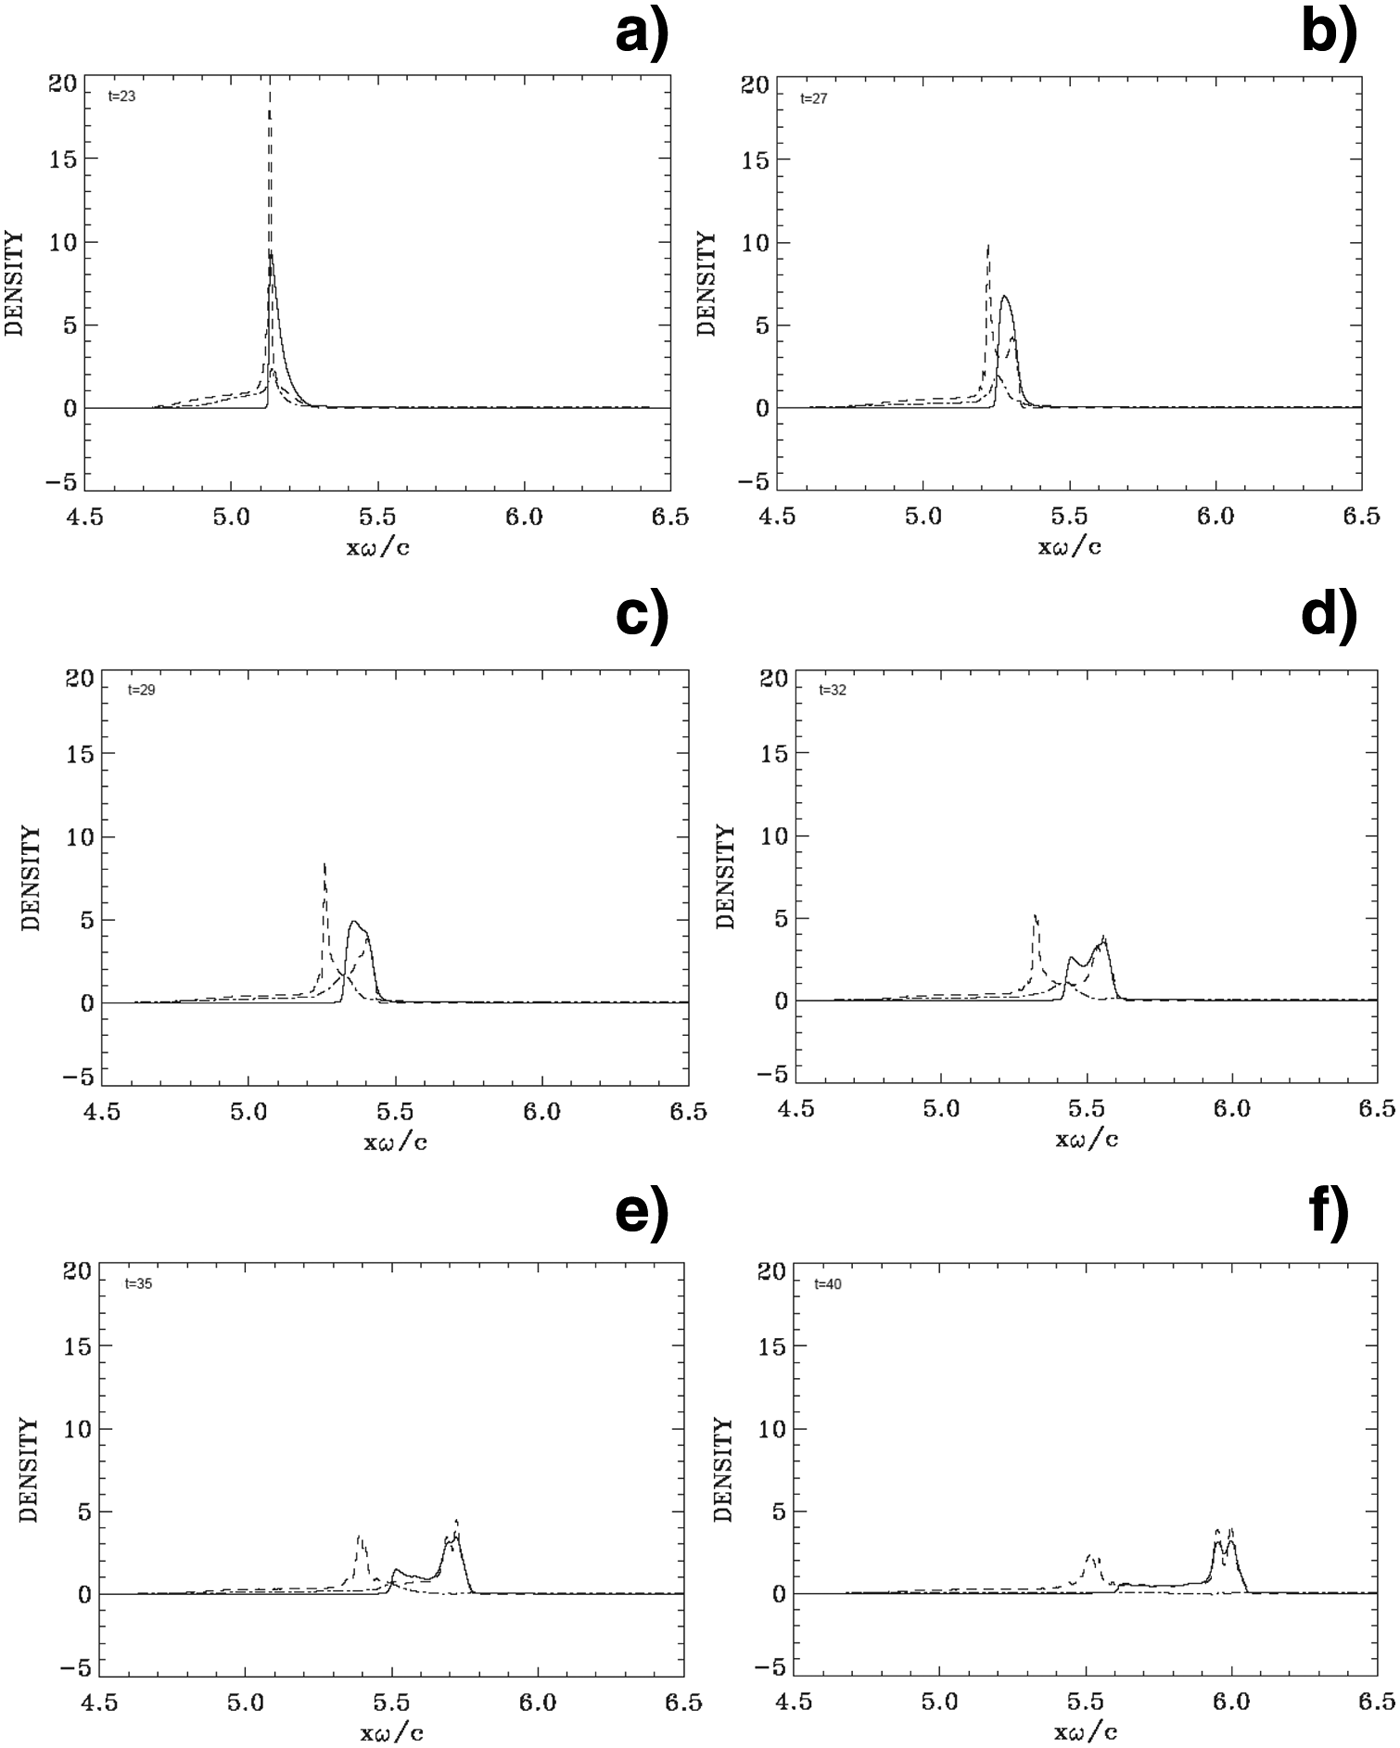
Initially, the mechanism of radiation pressure acceleration at the target surface is similar to what has been presented in the previous section. Electrons are pushed by the radiation pressure and accelerated at the target surface and form a steep density spike. An electric field is formed at the target surface due to the charge separation, and its penetration in the plasma beyond the steep edge is of the order of 0.1c/ω, which is the value of the skin depth. We present in Figure 6 some of the results obtained for the density profiles against distance, at times t = 23, 27, 29, 32, 35, and 40 (full curves for the electrons and dashed curves for the ions). The electric field (dashed-dotted curves) is also plotted (divided by a factor of 10). In Figure 6a at t = 23 (about the time at which the peak laser intensity reaches the target surface), we see again a rapid and huge jump in the ion density at the target surface, reaching a peak value of about 20, similar to what is presented in Section 3.1 (Fig. 1b). In the present case however, the deformation has penetrated almost the entire slab. Then, contrary to the results in the previous section, we observe the electron peak density separating from the ion peak density in Figures 6b and 6c, forming a double-layer. The solitary-like electron structure appears to be trapping an ion population (see for instance, Figs. 6c and 6d). The ion peak observed in Figure 6a has now decreased in Figures 6b and 6c. In Figure 6d at t =32, the electron solitary structure splits. There is a peak that is following and neutralizing the ion peak on the right, and there is a population of excess electrons that is slowing down and accelerated backward (see also Fig. 8d). This is due to the fact that the radiation pressure of the wave is decreasing, due to the decrease of the laser pulse amplitude. In Figure 6e at t = 35, the electron peak coincides with the ion peak at the right in the figure, giving a neutral plasma solitary structure free streaming to the right, and the other decoupled electron peak further distancing itself to the left, since the pressure of the laser pulse has further decreased. There is a balance between the radiation pressure of the decreasing incident laser beam and the decaying positive electric field, which is maintaining the left edge of the decoupled electrons more or less in equilibrium around the position x ≈ 5.6 (see Figs. 6e and 6f). This is also observed in the contour plot in Figure 8f at t = 40, where we see the left peak has shifted down to an average velocity close to zero, while the electrons in the solitary structure to the right are continuing their free-streaming trajectory with an average velocity following the neutral plasma jet. Thus, the neutral plasma structure we see in Figure 6f has an electron population with a velocity varying from zero at the left, to the value of the velocity of the neutral solitary structure at the right. An approximate evaluation of the velocity of the neutral plasma structure at the right can be obtained by following its edge, which in Figure 6e is located at about x ≈ 5.78 at t = 35, and in Figure 6f is located at about x ≈ 6.06 at t = 40, for an average velocity of ≈0.06c. We also see in the contours presented in Figure 8f the electron distribution function at the right around the position of the plasma jet centered approximately around υ/c ≈ 0.06. The same value of the velocity will be calculated in the next paragraph from the results in Figure 7.
Electron (full curves) and ions (dashed curves) density profiles (in units of 100n cr). The electric field (dashed-dotted curves, divided by a factor of 10). Plots at: (a) t = 23, (b) t = 27, (c) t = 29, (d) t = 32, (e) t = 35, (f) t = 40. Note the continuous separation between the ion peak and the electron peak in figures (b)–(f).
(Color online) Phase-space plots of the ion distribution function. Plots at: (a) t = 40, (b) t = 40 (zoom).
(Color online) Phase-space plots of the electron distribution function. Plots at: (a) t = 10, (b) t = 17, (c) t = 23, (d) t = 32, (e) t = 40, (f) t = 40 (zoom).
Figure 7 shows the phase-space contour plots of the ion distribution function at t = 40, when the neutral plasma jet is formed (ion acceleration has stopped, since the ion population at the right in Fig. 6 is now free streaming in the neutral plasma jet). Figure 7b shows a zoom at the top, showing a knee structure, reaching a peak in momentum of about 220 (this peak is higher than the value of about 200 observed in Fig. 2). Around the momentum value of 205, there is a densely populated spot. For the maximum momentum M iυ/M ec ≈ 220 or υ/c ≈ 220/(2 × 1836) = 0.06 This is essentially the same value we calculated following the edge of the shock-like structure of the solitary neutral plasma jet bump at the right in Figures 6e and 6f. This corresponds to an energy of the deuterium ions of M iυ2/2 = M ic 2 (υ/c)2/2 = 938 × 0.0039 = 3.37 MeV.
In Figure 8, we present the phase-space contour plots of the electron distribution function at t = 10, 17, 23, 32, and 40. The initial evolution is close to what we presented in the previous section. The steep electron edge that is observed at the target surface in Figure 8b at t = 17 and Figure 8c at t = 23, for instance, is due to the effect of the radiation pressure of the wave, which pushes the electrons at the target surface, and initially heats the electron distribution function. Figure 8c at t = 23 corresponds to the time where we observe the rapid acceleration of the ions at the target surface, mentioned in Figure 6a. We note however in Figure 8c that the wave has penetrated the entire plasma slab (indeed in Fig. 9 below we see a small wave transmitted to the right of the target). In Figure 8d at t = 32 and Figure 8e at t = 40, we see the split in the solitary structure of the electrons into two populations, which we discussed in Figures 6d and 6e, the peak to the right is for the electrons neutralizing the ion peak propagating in the neutral plasma jet moving away from the back of the target, and the other peak at the left is for an electron population which is slowing down backward, distancing itself from the electron population in the plasma jet at the right. The decreasing pressure of the wave at the target surface is essentially balanced by the decreasing electric field at the surface, where now the edge is essentially not moving, as previously mentioned in Figures 6d–6f. Note the two vortices-like structures at the position of the plasma jet in the zoom in Figure 8f. Note also the cooling in the distribution function, after the initial heating apparent in Figure 8c.
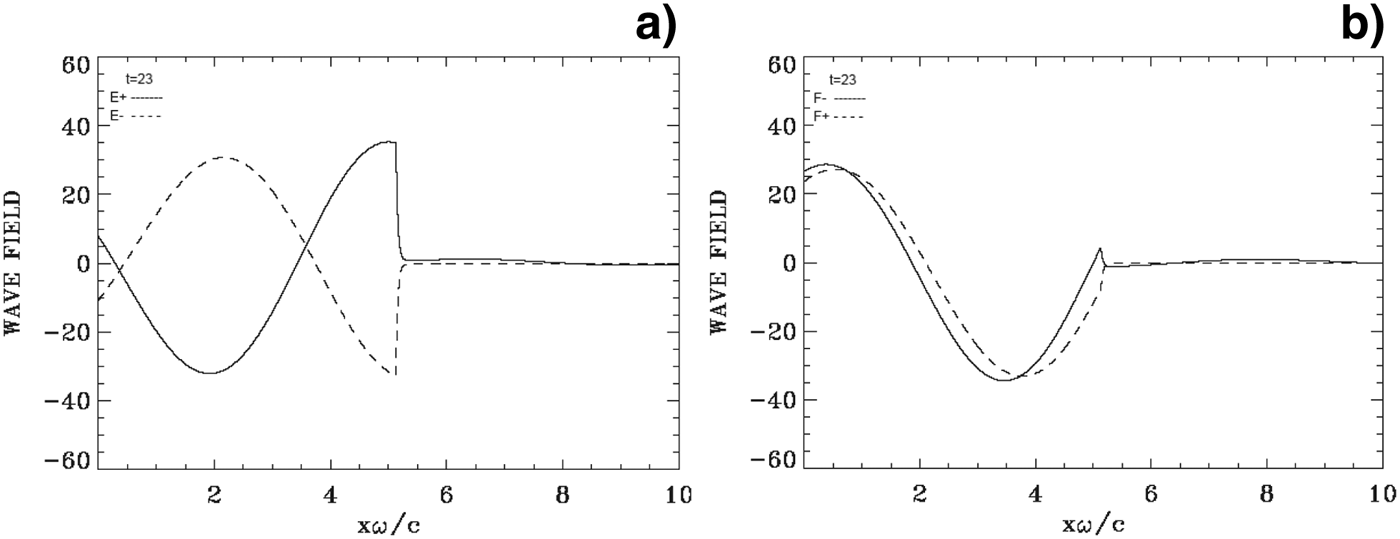
Incident waves E + and F − (full curves) and reflected waves E − and F + (dashed curves) at t = 23. Note the small transmission of the incident wave to the right across the target.
Figure 9 presents on the left the forward propagating wave E + (full curves) and the backward reflected wave E − (dashed curves), and on the right the corresponding results for the forward propagating wave F − (full curves), and the backward propagating wave F + (dashed curves). These curves are calculated at t = 23, at the time of the maximum of the incident wave E + and of the rapid acceleration of the ions at the target surface observed in Figure 6a.
In Figure 8c, we see that at t ≈ 23 the laser wave has approximately penetrated the thickness of the compressed slab. We note however a small component of the incident wave that is transmitted to the right in Figure 9, however the reflection (dashed curves) takes place at the target surface (there is no reflection from the right boundary). This is why we extended the domain further to the right of the target, compared to the simulation presented in the previous section. It is this penetration of the laser wave through the slab that is preventing the restoring force of the longitudinal electric field from bringing back the electron and ion peaks together, and rather leads to the formation of a double-layer as observed in Figures 6b and 6c.
3.3. The Case of a Plasma Slab with L p = 1.46c/ωpe
We use the same phase-space grid as in Section 3.2. In the present case, we have a vacuum region of length L vac = 4.78 on either side of the plasma slab. The steep ramp in density at the plasma edge on each side of the uniform flat top density of the slab target has a length L edge = 0.15. The length of the central plasma slab target, with a flat-top density of 1 (or 100n cr) is L p = 0.146 (in terms of c/ω), for a total length of the domain of 10 (the plasma slab target is centered in the domain). The initial plasma slab extends from 4.78 to 5.226 and the plateau is between 4.93 and 5.076. In our units the skin depth c/ωpe = (c/ω)(ω/ωpe) = 0.1c/ω, so the thickness of the plasma slab is L p ≈ 1.46 skin depths c/ωpe (we note the smaller value of L p compared to the previous sections).
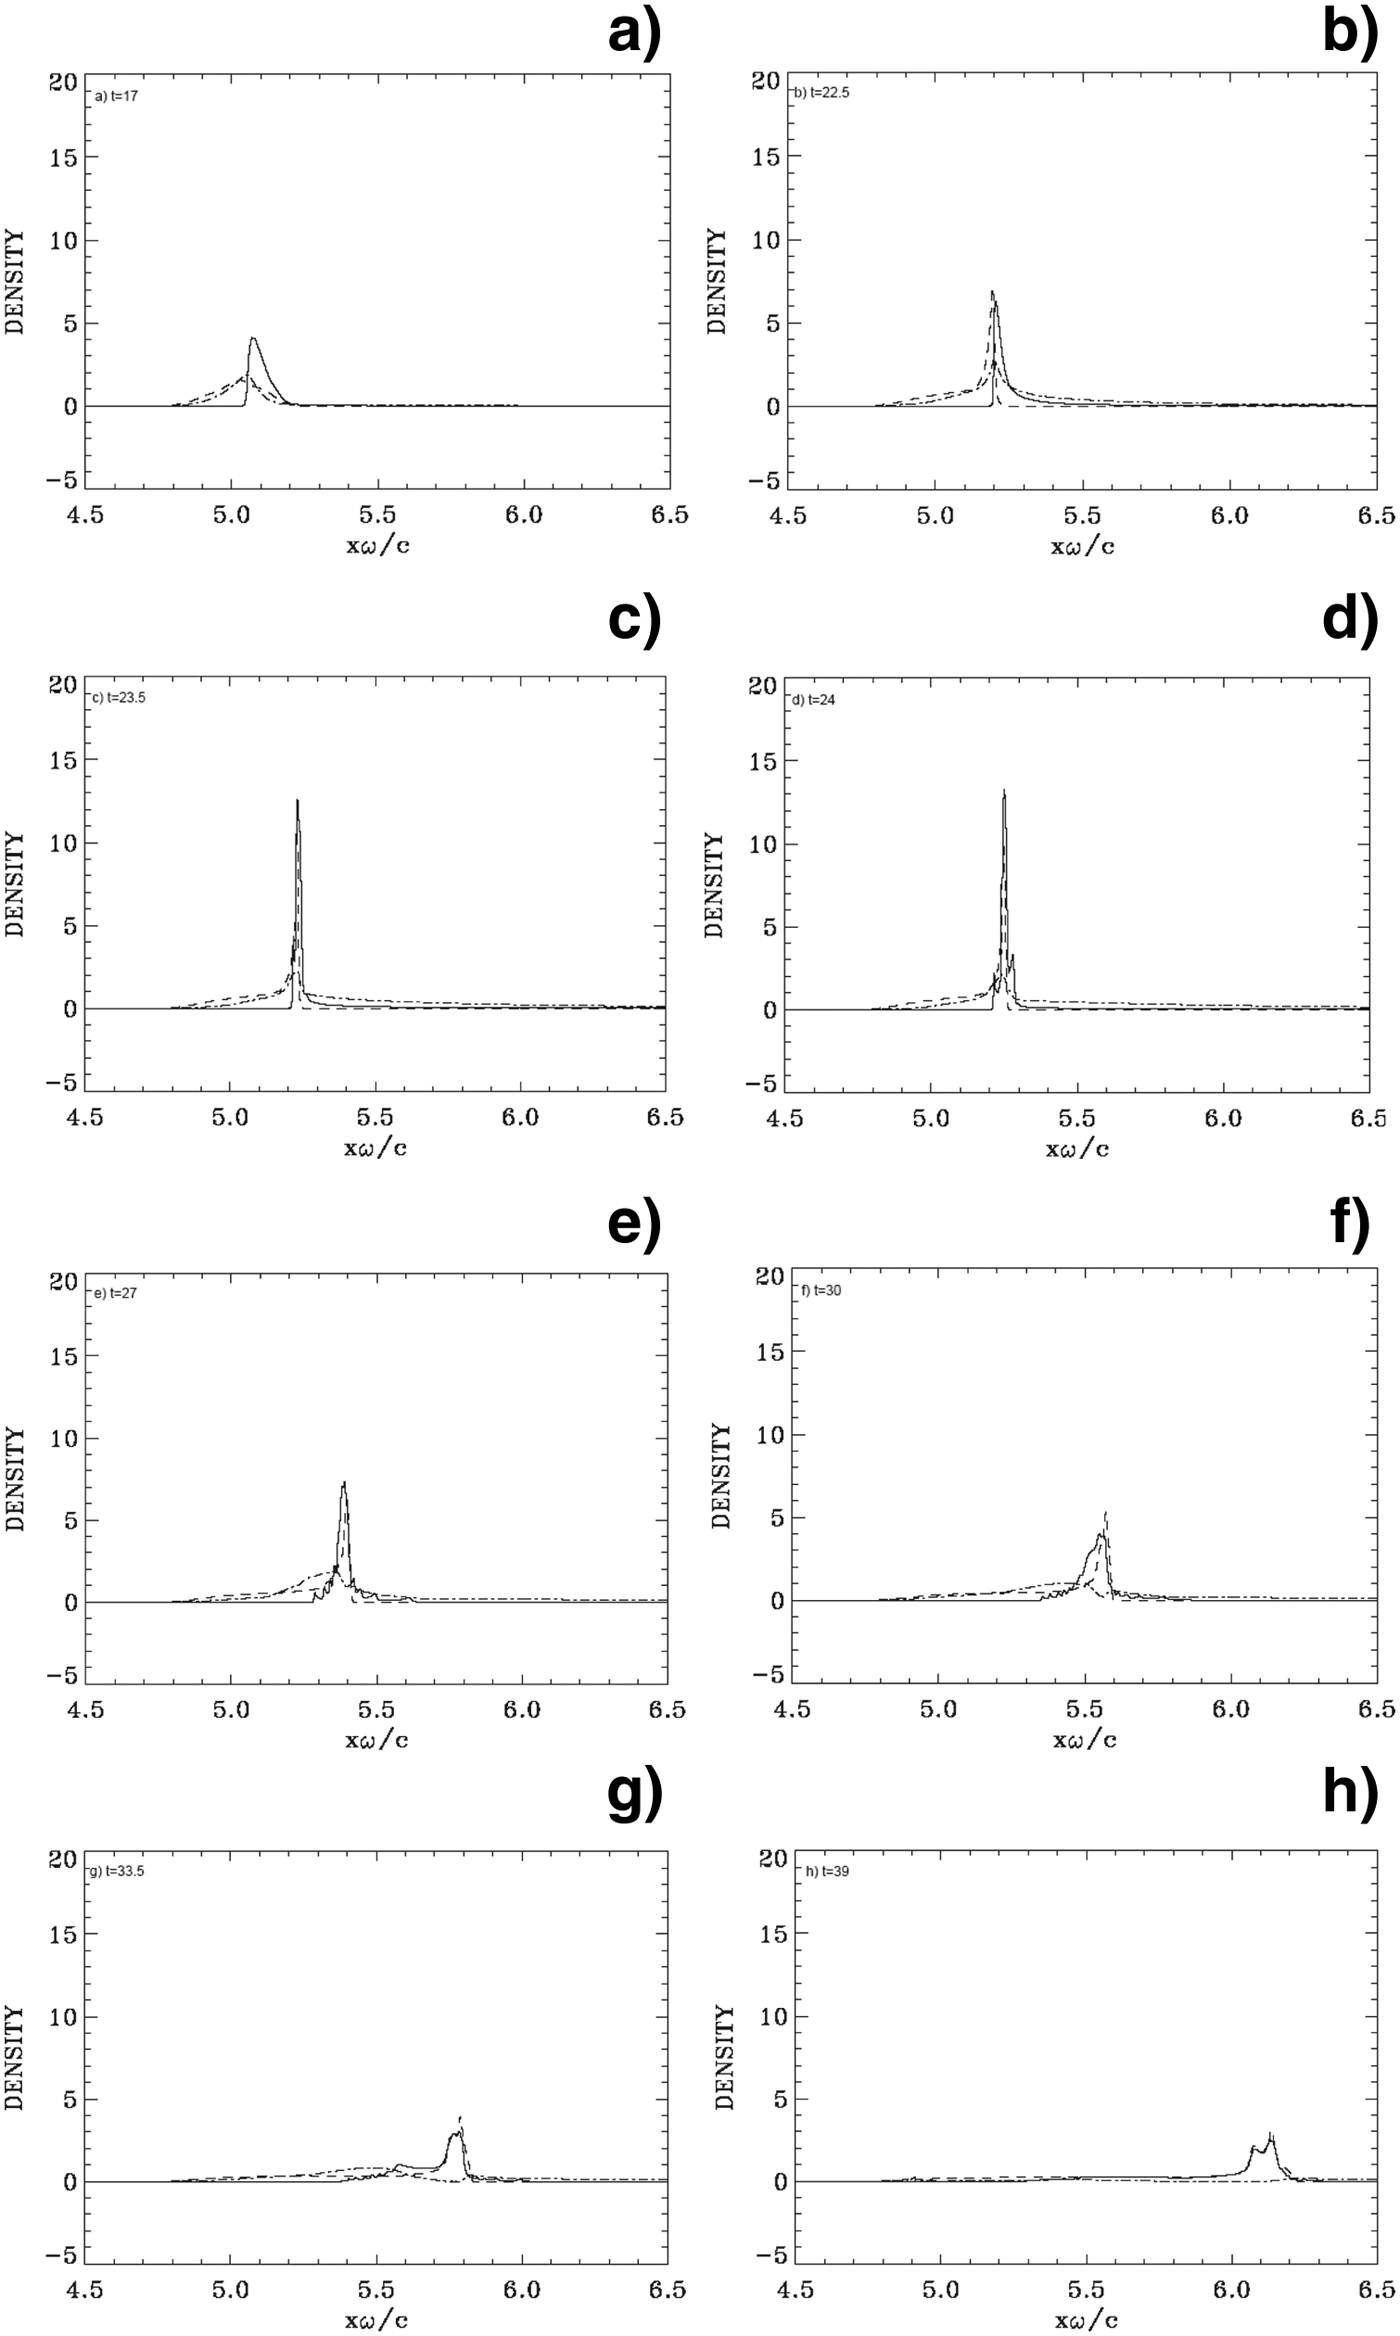
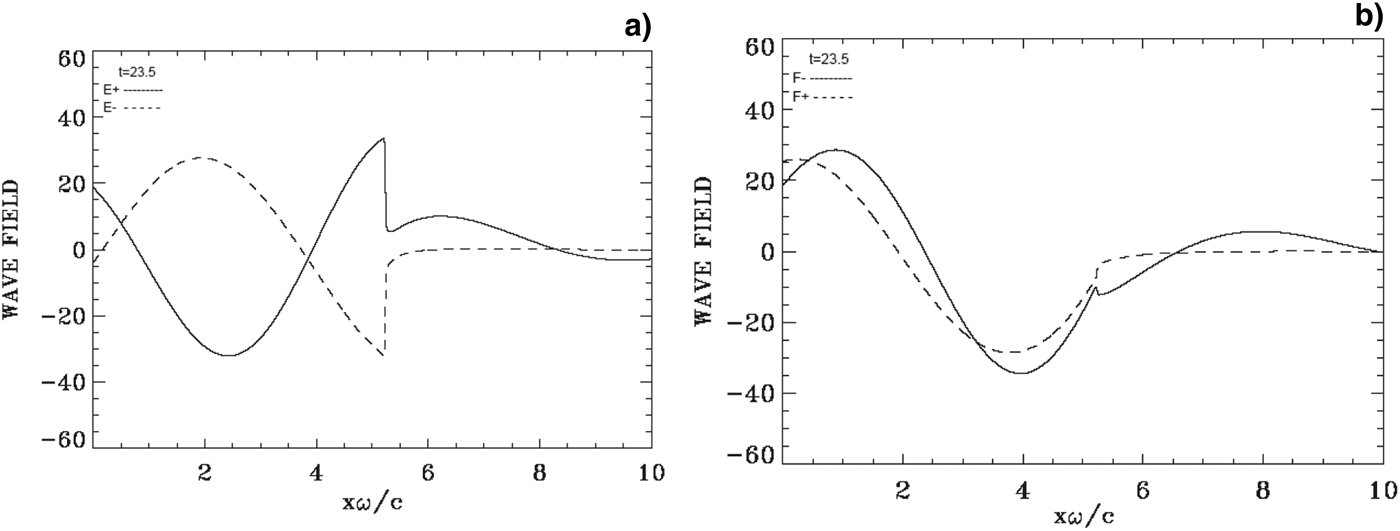
The initial mechanism of radiation pressure acceleration at the target surface is similar to what has been presented in the previous sections (see Fig. 10a). We present in Figure 10 some of the results obtained for the density profiles against distance, at times t= 17, 22.5, 23.5, 24, 27, 30, 33.5, and 39 (full curves for the electrons and dashed curves for the ions). The electric field (dashed-dotted curves) is also plotted (divided by a factor of 10). We see in Figure 10b an electron population accelerating or ejected into vacuum from the back of the target to the right, with a longitudinal electric field now appearing in the vacuum region at the back of the target. Figure 13 shows that an appreciable fraction of the incident wave is penetrating through the plasma and transmitted to the right. This regime has been called the “leaky light sail radiation pressure acceleration regime” in Qiao et al. (Reference Qiao, Geissler, Kar, Borghesi and Zepf2011). In Figure 10c, we see the electron and ion populations in what used to be the target forming a solitary-like structure. Note the difference with the previous section, there is no separation in the present case between the ion and the electron peaks, to form a double layer. The maximum laser intensity will reach the target surface at about t ≈ 23.2, i.e., about the time we observe the strong density peak at the target surface in Figure 10c. The ejection of the electrons from the back of the target is also seen in Figures 12a and 12b, for the electrons phase-space. These figures are close to what is presented in Figure 5 of Eliasson et al. (Reference Eliasson, Liu, Shao, Sagdeev and Shukla2009). However, in Eliasson et al. (Reference Eliasson, Liu, Shao, Sagdeev and Shukla2009), the simulation was stopped at this stage. There is, however, another important history that follows this stage, which will see the maximum ion momentum almost double with respect to the peak in Figure 11a. Indeed, in Figures 10d and 10e, we see sawteeth structures appearing around the peak following the electron ejection. Figure 12 (electron phase-space) shows that these sawteeth structures are due to electrons spiraling around the central structure in the phase-space due to the combined effects of the fields of the circularly polarized incident, reflected and transmitted waves, and of the longitudinal electric field that extends in both directions around the central structure. Figures 12d–12f shows the very rapid evolution of the system during the early phase of the formation of these spirals. In Figures 10f and 10g, we observe the electron population that seems to split, there is an excess population that is slowing down and accelerated backward, distancing itself from the ion peak (see also Figs. 12h and 12i), and there is an electron population that follows and neutralizes the ion peak. This is due to the fact that the radiation pressure of the wave is decreasing at the target surface, due to the decrease of the laser pulse amplitude. In Figure 10h, we see an electron peak coinciding with the ion peak, giving a neutral plasma solitary structure free streaming to the right, and leaving behind the other decoupled electron population, further accelerated backward to the left. The motion at the front edge of the decoupled electron population, which is the result of the balance between the radiation pressure of the decaying incident laser beam and the decaying positive restoring electric field, is maintaining the left edge of the decoupled electrons in very slow motion around the position x ≈ 5.5 (see Fig. 10h). This is also observed in the contour plot in Figure 12l at t = 39, where we see that the left peak has shifted down to an average velocity about zero, while the electrons in the solitary structure to the right are continuing their free-streaming trajectory with the average velocity of the neutral plasma jet. Thus, the neutral plasma structure we see in Figure 10h has an electron population with a velocity varying from about zero at the left, and increasing approximately linearly to the value of the velocity of the neutral solitary structure at the right.
Electron (full curves) and ions (dashed curves) density profiles (in units of 100 n cr). The electric field (dashed-dotted curves, divided by a factor of 10). Plots at: (a) t = 17, (b) t = 22.5, (c) t = 23.5, (d) t = 24, (e) t = 27, (f) t = 30, (g) t = 33.5, (h) t = 39. Note the sawteeth structures around the peak in figures (d) and (e).
(Color online) Phase-space plots of the ion distribution function. Plots at: (a) t = 24, (b) t = 27, (c) t = 39, (d) t = 39 (zoom).
(Color online) Phase-space plots of the electron distribution function. Plots at: (a) t = 20, (b) t = 21, (c) t = 22.5, (d) t = 23, (e) t = 24, (f) t = 25, (g) t = 27, (h) t = 30, (i) t = 33.5, (j) t = 36.5, (k) t = 39, (l) t = 39 (zoom). Note the ejection of the electrons to the right in figures (a)–(d), before the spiraling structure develops. This spiraling structure produces the sawteeth structures observed in Figure 10.
Incident waves E + and F − (full curves) and reflected waves E − and F + (dashed curves) at t = 23.5.
We present in Figure 11 the phase-space contour plots of the ion distribution function at t = 24, 27, and 39. In Figure 11d, we concentrate the plot on the peak of the accelerated ions, to zoom the region in Figure 11c at the peak momentum of the ions, which is reaching a peak in momentum of about 270 (higher than the values observed in the simulations with thicker targets in the previous sections). At this maximum momentum M iυ/M ec ≈ 270 or υ/c ≈ 270/(2 × 1836) = 0.075. The same value can be calculated following the edge of the shock-like structure of the neutral solitary plasma jet at the right in Figures 10g and 10h for instance. In Figure 10g, we see that the edge of the neutral plasma jet is at a position x ≈ 5.84 at the time t ≈ 33.5, and in Figure 10h at a position x ≈ 6.25 at the time t ≈ 39. This corresponds to an average velocity υ/c ≈ 0.074, in good agreement with what has been calculated above. This corresponds to an energy of the deuterium ions of M iυ2/2 = M ic 2 (υ/c)2/2 = 938 × 0.0039 = 5.26 MeV.
In Figure 12, we present the phase-space contour plots of the electron distribution function at t = 20, 21, 22.5, 23, 24, 25, 27, 30, 33.5, 36.5, and 39. The steep electron edge that is observed at the target surface in Figures 12a and 12b at t = 20 and 21, for instance, is due to the effect of the radiation pressure of the wave that is pushing the electrons at the target surface, as discussed in the previous sections. We also see in Figures 12a–12c that there is a population of electrons being ejected from the back of the target in the forward direction, long before the formation of the plasma jet. This population can also be seen in the density plot in Figure 10, at the right of the target, with the self-consistent longitudinal electric field. This is associated with a more important fraction of the laser beam being transmitted at the right of the target, as can be verified from Figure 13.
Figures 12d–12l shows a rapid evolution and how this ejected population behaves in the combined fields of the circularly polarized waves and the longitudinal wave. The electrons are spiraling under the effects of the circularly polarized waves and of the longitudinal electric field. In Figure 12h at t = 30, we note the beginning of the split of the electron population in the bulk of the distribution function into two populations. This split of the electron population was discussed in Figures 10f and 10g. In Figures 12i–12k, the peak at the right is for the electrons trapped by the ion beam and neutralizing it, and propagating in the neutral plasma jet moving away from the back of the target to the right. There is also an electron population that is slowing down toward the left in the backward direction, distancing itself from the main electron population that moves to the right with the ion peak. We see in Figure 12l that the electron population in the bulk is having an average velocity essentially equal to zero at the left, and evolving to the velocity of the plasma jet at the right, with a linear variation between these two positions. In Figure 12l, we zoom in on the result in Figure 12k, concentrating on the electron distribution to show more of the fine details of the structure of the electron phase-space. Note the initial heating of the electron distribution function, followed by a cooling, as time progresses (note also the variation of the vertical and horizontal scales in Figs. 12a–12d and in Figs. 12e–12k, to provide a good representation of the evolving electron distribution function).
Figure 13 presents on the left the forward propagating wave E + (full curves) and the backward reflected wave E − (dashed curves), and on the right the corresponding results for the forward propagating wave F − (full curves), and the backward propagating wave F + (dashed curves). In Figure 13, these curves are calculated at t = 23.5, around the time of the acceleration of the ions at the target surface observed in Figure 10c. The laser field does not completely decay within the target; there is an important transmitted field that we see in Figure 13 propagating to the right. However the reflection of the wave (dotted curves) takes place only at the target (there is no reflected wave coming from the right boundary). Note also that when E + is at a peak value, F − is zero and vice-versa.
4. CONCLUSIONS
We have used an Eulerian Vlasov code for the numerical solution of the 1D relativistic Vlasov-Maxwell equations to study the effect of the target thickness on the formation of a plasma jet during the interaction of a high-intensity circularly polarized laser beam normally incident on an over-dense plasma (the plasma density is n/n cr = 100, where n cr is the critical density). We have studied three cases where the thickness of the constant density flat-top plateau target is successively L p = 5.1c/ωpe, L p = 2.86c/ωpe, and L p = 1.46c/ωpe, with an amplitude of the vector potential of the laser kept constant and equal to  $a_0=25/\sqrt 2$. For all the cases considered, radiation pressure acceleration has the dominant role. The initial evolution of these systems is essentially the same. The electrons are pushed by the radiation pressure, and form a steep gradient at the target surface. This generates a charge separation and an electric field at the plasma edge which accelerates the ions. In the subsequent evolution of the system however, the target thickness is seen to play a key role in the physical processes involved in the evolution of the density profiles, and the subsequent formation of the plasma jet emitted from the rear side of the target.
The results presented for the first case in Figure 1 obtained for L p = 5.1c/ωpe show an evolution similar to what has been presented for thicker plasma targets (see for instance, Macchi et al., Reference Macchi, Cattani, Liseykina and Cornolti2005; Klimo et al., Reference Klimo, Psikal, Limpouch and Tikhonchuk2008; Liseikina & Macchi, Reference Liseikina and Macchi2007; Shoucri et al., Reference Shoucri, Afeyan and Charbonneau-Lefort2008; Reference Shoucri, Lavocat-Dubuis, Matte and Vidal2010; Reference Shoucri, Lavocat-Dubuis, Matte and Vidal2011; Shoucri & Afeyan, Reference Shoucri and Afeyan2010; Shoucri, Reference Shoucri and Shoucri2010; Reference Shoucri2012). In this case, the penetration of the laser beam in the target damps in a layer of thickness of the order of the skin depth c/ωpe (equal to 0.1 in our units) at the target surface. The evolution of the density profiles for the ions and the electrons in Figure 1 shows the ion and electron density peaks at the target surface traveling close to each other, with a neutral plasma jet continuously ejected from the back of the target. During the period of life of the pulse, the laser ponderomotive force is pushing the electrons in the forward direction, and the restoring force of the space charge electric field is keeping the ion and electron peaks close to each other. Ions are accelerated on the inner side of the target surface, to follow the expanding electrons to the right, forming the neutral plasma jet. We note good agreement between the results in Figures 1 and 2 with the results reported for a thick plasma target (several skin depths) in the references mentioned above in this paragraph.
In Section 3.2, the thickness of the target is reduced to L p = 2.86c/ωpe. The initial evolution of the density profiles is close to what is presented in the previous section. Subsequently the evolution of the density profiles in Figure 6 shows the electron density peak at the target surface trapping an ion population and slowly moving away from the ion density peak, forming a double layer. The laser ponderomotive force pushes the electron density peak forward, while the ion peak is slowly following behind. The restoring force of the space charge electric field does not reach the intensity where it can balance the ponderomotive force to keep the two peaks at a constant distance. In this case there is a small penetration of the laser wave through the initial target (see Figs. 8c and 9). With the decreasing radiation pressure due to the decaying laser pulse amplitude, a fraction of the electron peak is following the initially trapped ion population to form a neutral solitary plasma jet structure, which appears ejected from the back of the target, and the excess electrons are slowing down and accelerated in the backward direction. Note that although the whole thin foil has been transformed into a double layer structure, and the radiative pressure acceleration is acting on the double layer as a whole, it is the trapped ion population in the electron peak (which are distinct from the initial ion peak of the double layer), which contributes to the formation of the final neutral plasma jet. We note a similar behavior reported for n/n cr = 25 (see Fig. 7 in Shoucri, Reference Shoucri2012), where the separation of the ion and electron peaks in the double layer was more important, and showed a linear variation of the space charge electric field during the evolution of the double layer, close to what was presented in Yan et al. (Reference Yan, Lin, Sheng, Guo, Liu, Lu, Fang and Chen2008) and Tripathi et al. (Reference Tripathi, Liu, Shao, Eliasson and Sagdeev2009) for n/n cr = 10.
In Section 3.3, the thickness of the target is further reduced to L p = 1.46c/ωpe. This is the “leaky light sail” case. The laser beam penetrates through the target (see Fig. 13) and electrons are ejected from the back of the plasma, which leads to the formation of an electric field at the back of the target, in the forward direction. A figure similar to Figures 12a and 12b of our paper showing the ejected electrons was presented in Figure 5 in Eliasson et al. (Reference Eliasson, Liu, Shao, Sagdeev and Shukla2009). From the early stage of the simulation, a trapped population of ions and electrons forms a solitary structure which leads to the neutral solitary plasma jet (see Fig. 10b). We are able to follow, with our fine grid, the very rapid evolution of the electron distribution function showing the formation of a spiraling structure in the phase-space (see Fig. 12), in the fields on the incident, reflected and transmitted waves, and the space charge electric field. From the point in time where electrons are ejected from the back of the target, until the end of the simulation, the maximum ion momentum has doubled. At the end, with the decreasing radiation pressure of the laser pulse, the excess electrons in the solitary structure are slowing down and accelerated in the backward direction, and a neutral solitary plasma jet is free streaming in the forward direction.
In the simulations presented Sections 3.2 and 3.3, although we get in the final stage in both cases neutral solitary plasma jet, we see that the physical processes involved in the evolution leading to this final stage are different. The evolution in Section 3.2 is through the formation of a double layer, similar to what we observe in Figure 7 in Shoucri (Reference Shoucri2012) for the case with n/n cr = 25. We note also that for the case with n/n cr = 25 presented in Shoucri (Reference Shoucri2012), a further decrease in the target thickness produced results similar to the “leaky light sail” regime of Section 3.3.
Reducing the target thickness resulted in an increase of the maxima of the ions momenta, although in the present high-density cases (n/n cr = 100) this increase was more moderate than the one observed in Shoucri (Reference Shoucri2012) for instance, with the same laser intensity, but at lower density (n/n cr = 25). This seems to be in qualitative agreement with the recent experimental observations in Henig et al. (Reference Henig, Steinke, Schnürer, Sokollik, Hörlein, Kiefer, Jung, Schreiber, Hegelich, Yan, Meyer-terVehn, Tajima, Nickels, Sandner and Habs2009), Kar et al. (Reference Kar, Borghesi, Bulanov, Key, Liseykina, Macchi, Mackinnon, Patel, Romagnani, Schiavi and Willi2008), Prasad et al. (Reference Prasad, Andreev, Ter-Avetisyan, Doria, Quinn, Romagnani, Brenner, Carroll, Dover, Neely, Foster, Gallegos, Green, McKenna, Najmudin, Palmer, Schreiber, Streeter, Tresca, Zepf and Borghesi2011), Qiao et al. (Reference Qiao, Geissler, Kar, Borghesi and Zepf2011), who report an increase in velocity in the case of a thin target, and in Qiao et al. (Reference Qiao, Geissler, Kar, Borghesi and Zepf2011) who mentioned the key role played by thinner targets in the formation of plasma jets.
The laser intensity has been kept constant in the above simulations. However, when we repeated the simulation in Section 3.2 with a higher intensity ( $a_0=35/\sqrt 2$), the penetration of the laser beam through the target was more important and we recovered results similar to the “leaky light sail” regime presented in Section 3.3. Indeed, the penetration of the laser beam through the target depends on a 0 (Macchi et al., Reference Macchi, Cornolti, Pegoraro, Liseikina, Ruhl and Vshivkov2001).
It is difficult, with the limited number of cases treated, to draw a conclusion on an optimal target thickness, as suggested for instance in Yan et al. (Reference Yan, Lin, Sheng, Guo, Liu, Lu, Fang and Chen2008). It is obvious that the target thickness cannot be reduced indefinitely. However, for the present results, the qualitative dependence on the thickness of the slab seems to agree with what is reported in Henig et al. (Reference Henig, Steinke, Schnürer, Sokollik, Hörlein, Kiefer, Jung, Schreiber, Hegelich, Yan, Meyer-terVehn, Tajima, Nickels, Sandner and Habs2009), Kar et al. (Reference Kar, Borghesi, Bulanov, Key, Liseykina, Macchi, Mackinnon, Patel, Romagnani, Schiavi and Willi2008), Prasad et al. (Reference Prasad, Andreev, Ter-Avetisyan, Doria, Quinn, Romagnani, Brenner, Carroll, Dover, Neely, Foster, Gallegos, Green, McKenna, Najmudin, Palmer, Schreiber, Streeter, Tresca, Zepf and Borghesi2011), and Qiao et al. (Reference Qiao, Geissler, Kar, Borghesi and Zepf2011) for instance.
ACKNOWLEDGMENTS
M. Shoucri is grateful to Dr. Réjean Girard for his constant interest. The authors are grateful to the Centre de Calcul Scientifique de l'IREQ (CASIR) for the computer time used in the simulations presented in the present work.