Federalists have always called themselves the best blood—where there is presumed to be best, that there must be worst follows…. [M]echanics and farmers, of course, are the worst.
—William Duane (Reference Duane1807), Politics for American FarmersHow does economic and social position relate to the primary cleavages of electoral politics? Earlier political sociologists took it for granted that electoral politics was an extension of class struggle (Anderson and Davidson Reference Anderson and Davidson1943), treating class patterns in voting as the natural translation of divisions in society into lines of political contention (Lipset and Rokkan Reference Lipset, Rokkan, Lipset and Rokkan1967: 5). However, this consensus was called into question in the 1990s, when social scientists found evidence of a decline in class voting across advanced industrial economies (Clark et al. Reference Clark, Lipset and Rempel1993; Evans Reference Evans2000: 410; Franklin et al. Reference Franklin, Mackie and Valen1992; Nieuwbeerta and De Graaf Reference Nieuwbeerta, De Graaf and Evans1999; Weakliem and Heath Reference Weakliem, Heath and Evans1999). Given these developments, are there compelling empirical or theoretical reasons for social scientists to continue relying so heavily on the concept of class? While neo-Marxist (Wright Reference Wright2005) and neo-Weberian theorists (Breen Reference Breen and Wright2005) maintain that a parsimonious set of class categories can still satisfactorily explain political behaviors in modern democratic capitalist societies (Chan and Goldthorpe Reference Chan and Goldthorpe2007; Hout et al. Reference Hout, Brooks and Manza1995), other social scientists argue that the explanatory power of class has declined due to fundamental demographic shifts in the composition of the electorate. As the working class shrinks and incomes rise, cultural issues and identities—religious, nationalist, regionalist, gender-based, and so forth—have replaced or overwhelmed class identities (Brady et al. Reference Brady, Sosnaud and Frenk2009; Inglehart Reference Inglehart1990; Pakulski and Waters Reference Pakulski and Waters1996; Piven Reference Piven1992; Sosnaud et al. Reference Sosnaud, Brady and Frenk2013; Van der Waal et al. Reference Van der Waal, Achterberg and Houtman2007). Perhaps, then, sociological theorizing on class has been shaped by the historical coincidence that much of the sociological canon was written at the height of industrial class formation.
However, sociologists working in a neo-Durkheimian tradition aim to revitalize class analysis by discarding industrial classes as the ideal types of economic groupings in sociological theory. Grusky and Galescu (Reference Grusky, Galescu and Wright2005a: 62) argue that “from the long view, it becomes clear that true classwide organization emerged for only a brief historical moment and that postmodern forms are reverting back to localism and sectionalism.” Just as Durkheim saw occupations as the “center of moral life” (Reference Durkheim1958 [1893]: 7), actors in contemporary society are more likely to think in terms of occupations than classes. Occupations are more institutionalized—by trade unions, professional associations, training programs, and so forth—than are classes. Accordingly, they argue that the decline of class voting is an artifact of how broadly that concept is measured (Grusky and Sørensen Reference Grusky and Sørensen1998; Weeden and Grusky Reference Weeden and Grusky2005). Empirically they show that disaggregation of larger class categories into occupations (“micro-classes”) increases the observed strength of the statistical relationship between economic positions and party affiliation in the twentieth century. Such a disaggregation suggests that the site of production still reigns supreme as the basis of American politics, even though the structuring of the relationship between the site of production and political activity has dramatically altered.
The neo-Durkheimians thus direct attention away from the degree of class-party affiliation and toward variation in the mapping of specific economic positions to party affiliations. Similarly, this study examines variation in the social bases of partisan affiliations. However, while previous studies in this tradition have asked when class gives way to occupation as the most powerful way of describing this mapping, I ask how classes first came to dominate occupations in the political realm. To do so, I expand the framework developed by the neo-Durkheimians backward in time, making use of novel data that allow me to assess the social bases of political affiliations in nineteenth-century Massachusetts. I perform quantitative analysis of Massachusetts state legislators across four political epochs: the First Party System (1795–1824), the Second Party System (1835–54), the Civil War and Reconstruction (1855–77), and the Gilded Age (1878–93). To assess the extent to which classes, ethnicities, and occupations were associated with the major parties, I fit logistic regression models on a unique data set of almost 20,000 legislators. I then use the Bayesian Information Criterion (BIC) to analyze variation in best-fit models across these four periods. Synthesizing best-fit models with historiographical treatments of these periods allows me to historicize the social bases of party affiliation in a way that studies limited to late-twentieth-century parties cannot.
I find considerable variation in the mapping of economic positions to political affiliations across the nineteenth century. The First Party System (1795–1826) is best described as a complex system of occupational cleavages reflective of a more traditional civil society (Formisano Reference Formisano1983), whereas Massachusetts’ Second Party System (1835–54) shows that party affiliation began to reflect proto-class cleavages as industrialization progressed and class-spanning unions matured (Dawley Reference Dawley1976; Neem Reference Neem2008). The Civil War interrupted this process of class articulation by emphasizing the ethnic dimension of the party system. Irish Americans and African Americans lined up on opposite sides of the party system, an ethno-racial cleavage that would hold for the rest of the century. However, economic cleavages reasserted themselves in the late nineteenth century, which is the first period for which traditional industrial class models fit party membership better than more disaggregated measures of class. Taken together, these findings support the view that “true classwide organization emerged for only a brief historical moment” (Grusky and Galescu Reference Grusky, Galescu and Wright2005a: 62). In a number of surprising ways, the political environment of the twenty-first century parallels that of the early nineteenth century.
Sociological Accounts of Class and Political Behavior
Despite intense academic and popular interest in understanding the class basis of contemporary politics (e.g., Frank Reference Frank2004), much of the literature on class voting has pursued a primarily empirical agenda (Evans Reference Evans2000: 411–14). Studies aim foremost to prove or repudiate claims about the diminishing class basis of voting in contemporary society. However, as a whole these studies have not been able to adjudicate between the competing theoretical explanations for relationships between class and political behavior. One reason for this is that high-quality data on class and party affiliation are available for limited geographical areas and periods. Quantitative studies have therefore been constrained to study mature party systems in wealthy, industrialized nations after World War II. There simply has not been enough variation in underlying political and economic conditions to allow study of the fundamental processes driving the relationship between class and political behavior.
When social theorists do attempt to broaden their evidentiary base by incorporating nineteenth-century history into the debate, they are confronted with a vast and conflicting historiographical literature. The class basis of early American politics was championed by historians throughout the first half of the twentieth century (Beard Reference Beard1913, Reference Beard1915; Beard and Beard Reference Beard and Beard1921; Schlesinger Reference Schlesinger1945) before becoming unfashionable at mid-century as historians began to emphasize an underlying liberal consensus across American political life (Benson Reference Benson1961; Hartz Reference Hartz1955; Hofstadter Reference Hofstadter1948). Later historians would emphasize the primacy of ideology over economic explanations for major events in American history (Bailyn Reference Bailyn1967; McCoy Reference McCoy1980; Wood Reference Wood2009). Historians have reached conflicting conclusions on the importance of class in part because they have taken conflicting methodological approaches to gauging the class and ethnic basis of American politics. Most simply, some historians take the populist economic language of party rhetoric seriously (Schlesinger Reference Schlesinger1945). Other historians have counted the number of bankers and manufacturers in the highest echelons of leadership of both major parties. Finding equivalent numbers of economic elites at the tops of both parties, these historians dismiss the class basis of the parties (McCormick Reference McCormick1966; Pessen Reference Pessen1969). Quantitative historians have looked at bivariate correlations between the distribution of votes in counties and the demographic characteristics of those counties (Benson Reference Benson1961; Formisano Reference Formisano1983: 280–83; Sellers Reference Sellers1991). This latter approach remains influential, though it suffers from omitted variable bias and the ecological inference fallacy (Robinson Reference Robinson1950). Despite these serious methodological shortcomings, these pieces inform influential general histories of the era (e.g., Howe Reference Howe2007; Wilentz Reference Wilentz2005).
These historiographical traditions have also influenced sociologists’ understandings of the nineteenth century (e.g., Lipset and Marks Reference Lipset and Marks2000; Perrow Reference Perrow2002; Roy Reference Roy1997). Consider the parallels between trends in historiography and trends in social theory. Schlesinger’s (Reference Schlesinger1945) work represents the pinnacle of the class interpretation of the Age of Jackson among academic historians: Political parties represented distinct interests, and electoral processes mediated their influence in the policy process. During this period, pluralist models of politics were developed (Dahl Reference Dahl1961; Key Reference Key1949; Truman Reference Truman1951). However, from the 1960s onward historians worked to tear down the self-serving façade of Jacksonian rhetoric by arguing that Democratic voters and politicians were just as elite as those of the Whigs (Benson Reference Benson1961; Pessen Reference Pessen1969) and Republicans (Wiebe Reference Wiebe1967). These works influenced not only social scientific accounts of nineteenth-century America (e.g., Perrow Reference Perrow2002) but also the direction of social scientific understandings of party politics. Scholars moved toward models that depicted the Second Party System as electoral machines assembling coalitions more through the power of patronage than principle and policy (Aldrich Reference Aldrich2011). Despite significant methodological flaws, these historical studies have allowed sociologists to state that the era of class politics in the United States excludes the antebellum era (Clark et al. Reference Clark, Lipset and Rempel1993: 297; Grusky and Weeden Reference Grusky, Weeden, Lareau and Conley2008: 66; Pakulski and Waters Reference Pakulski and Waters1996: 676).
This too-neat splitting of American history is made possible by reliance on too-broad conceptualizations of class. Drawing on neo-Durkheimian arguments about the late twentieth century, I argue that theorists and historians alike have missed the profound role that narrower economic groupings played in structuring antebellum American politics. While early-nineteenth-century America and late-twentieth-century America obviously differ in profound ways, this discussion shows how in some regards the social structure of the preindustrial United States bears a closer resemblance to postindustrial social structures as discussed by Pakulski and Waters (Reference Pakulski and Waters1996) than either does to the quintessential industrial social structure. The point of this discussion is not to elide differences between modern and nineteenth-century societies. Rather, the discussion shows that reliance on macro-concepts like “preindustrial,” “industrial,” and “postindustrial” is of questionable value when it obscures careful consideration of the myriad social forces that are more proximate to citizens’ experiences and political behavior (Katznelson and Zolberg Reference Katznelson and Zolberg1986).
Factors Influencing the Social Bases of Nineteenth-Century Party Systems
When should we expect an occupational basis to political affiliations? Grusky and Galescu (Reference Grusky, Galescu, Alexander and Smith2005b: 226) note:
Durkheim is (famously) silent on the proximate mechanisms by which occupational associations will emerge, as he simply presumes, by functionalist fiat, that outcomes that putatively service systems ends will ultimately win out.
Fortunately, the sociological literature as a whole has produced a rich set of possible mechanisms that might give social reality to smaller economic groupings. The general thrust of my discussion leads to the prediction that a strong occupational basis for the First Party System (1795–1826) will gradually give way to a class basis for the Third Party System (1877–93). By “occupational basis,” I simply mean that occupations within a given class (e.g., carpenters and cordwainers) will differ in either the intensity of their affiliation with a political party or even affiliate with opposing parties. Why would this happen? Note that a complex occupational basis differs from the view of class formation as described by Goldthorpe et al. (Reference Goldthorpe, Llewellyn and Payne1980: 40), wherein spontaneous reactions by individuals to shared market and employment experiences unite broad segments of the population into a handful of class groupings such as “the upper service class” and “routine non-manual workers” (Breen Reference Breen and Wright2005). This may describe certain eras, but it does not describe the early nineteenth century, when workers who shared similar conditions of work—shoemakers and hatters, hardware store proprietors and grocers—differed in their political behavior. To explain variation in nineteenth-century political behavior, I look at variation in the following factors, which mediate how individuals experience markets and places of employment.
Intermediary Organizations
Kaufman (Reference Kaufman2002: 5) argues that people form associations because they “accept the challenge of intrasocial competition.” Accordingly, we would expect correspondence between organizational ecology and the major political cleavages in a nation. Weeden and Grusky (Reference Weeden and Grusky2005) explain the decline of traditional class categories through reference to changes in the intermediary organizations that constitute civil society. For example, they note that the late twentieth century was characterized by the weakening of unions and political parties, two intermediary organizations that tended to create class consciousness (ibid.; see also Feigenbaum et al. Reference Feigenbaum, Hertel-Fernandez and Williamson2018; Rosenfeld Reference Rosenfeld2014).
As unions declined through the close of the twentieth century, civil society was populated by intermediary organizations focusing on issues “orthogonal” to traditional class concerns (Weeden and Grusky Reference Weeden and Grusky2005: 1734). The most potent intermediary organizations are now those that mobilize citizens by their religious identity (Campbell Reference Campbell2004; Wilcox and Sigelman Reference Wilcox and Sigelman2001). Issue-focused voluntary organizations are generally more top heavy, and so do less to mobilize support and structure political contention than did older voluntary associations (Skocpol Reference Skocpol2003). At the same time, corporate employers have become more active in mobilizing employees to vote for industry-friendly candidates (Hertel-Fernandez Reference Hertel-Fernandez2018; Walker Reference Walker2014). In so doing, employees are encouraged not to identify broadly as “workers” but with their narrower economic—often industrial—position. In this diminished version of civil society, occupations rank among some of the most “institutionalized” identities, which accounts for the increase in within-class variation in political affiliation. In highlighting organizational intermediaries, Weeden and Grusky (Reference Weeden and Grusky2005) provide a plausible variable that could explain variation in occupation and party affiliation across countries, regions, and historical periods.
From the perspective of organizational intermediaries, the early nineteenth century is in many ways a mirror image of the late twentieth century. Both eras are characterized by weak parties and a nonunionized civil society. To the extent that workers did belong to economic voluntary associations in the early nineteenth century, these were occupation-specific associations rather than classwide unions. At their best, these associations enabled members of occupations to defend collective interests and to form shared identities (Polletta and Jasper Reference Polletta and Jasper2001) as they celebrated the values and traditions of their craft (Wilentz Reference Wilentz1984). These older associations tended to emphasize the shared contributions of masters, journeymen, and apprentices within their craft rather than their diverging interests as employers and employees (Dawley Reference Dawley1976: 42). However, some believed these shared interests were the result of a compulsion akin to that practiced by twenty-first-century employers (Hertel-Fernandez Reference Hertel-Fernandez2018). For example, the Republican Levi Lincoln accused the Federalist Party of winning the allegiance of humbler voters through the use of force:
By force, I mean an intolerant and oppressive violence towards laborers, tenants, mechanics, debtors, and other dependents…. Individuals have been threatened with a deprivation of employment, and an instant exaction of debt to the last farthing as a Consequence of withholding a federal vote. (quoted in Formisano Reference Formisano1983: 136)
The move away from occupation-based organizations began during the Second Party System. During this period, workers increasingly tried, with only partial and temporary success, to create class-spanning unions (Dawley Reference Dawley1976; Neem Reference Neem2008; Wilentz Reference Wilentz1984). Similarly, around mid-century the professions began organizing limited, local professional associations (Neem Reference Neem2008). This period also witnessed the emergence of new technologies for making class appeals during political campaigns (Formisano Reference Formisano1983: 245). These trends accelerated after the Civil War: The Third Party System was characterized by an even greater success in the establishment of class-spanning organizations like the Knights of Labor and the Farmers’ Alliances. Professional associations went national during this period, with the creation of the American Medical Association, the American Bar Association, and so on (Wiebe Reference Wiebe1967). Accordingly, the importance of intermediary organizations in civil society leads to:
Organizational Hypothesis 1: The First Party System is best described by a complex occupational structure.
Organizational Hypothesis 2: The Second and Third Party systems are best described by classlike structures.
Law and Regulation
Regulation is among the many factors identified by Pakulski and Waters (Pakulski and Waters Reference Pakulski and Waters1996: 285–86) for the “fragmentation of class” in the postindustrial era. State regulation creates protected groupings with interests that are narrower than those of class interests. Whether or not this accurately describes the twentieth century, it does have high plausibility for the First and Second Party systems. Local government was an active site of regulatory activity that created narrow interests, for example local laws distributing the right to sell certain goods in the market or establishing a monopoly on providing service along certain transportation routes (Handlin and Handlin Reference Handlin and Handlin1947; Novak Reference Novak1996). Furthermore, until mid-century the majority of corporations were formed by special acts of the legislature (Hurst Reference Hurst1970): Massachusetts did not pass a general incorporation law for industrial corporations until 1851, and it had no general corporation tax until 1864 (Bullock Reference Bullock1916: 14). The lack of such polices for most of the antebellum era meant that capitalists did not lobby the legislature as a class to achieve a more favorable legal environment; rather, they individually lobbied their friends in the legislature to acquire special privileges for their own special charters. Thus it was only in the second half of the century that corporate taxes and corporate law began to unite capitalists as a community of interest in relation to the state legislature.
What were the effects of personal taxes? Taxes politicize income levels, because voters with different income levels (and thus different tax burdens) tend to adopt different attitudes toward social spending and size of government (Brooks and Brady Reference Brooks and Brady1999).Footnote 1 Indeed, in recent years income has become more predictive of vote choice even as the effects of class have receded (Bartels Reference Bartels2016; Hout and Laurison Reference Hout, Laurison and Grusky2013).
Income levels, however, were less politicized during the antebellum era, when Massachusetts state taxes were “nominal” (Bullock Reference Bullock1916: 5) and federal taxes were based on tariffs and excises. Attitudes toward taxes before the Civil War, then, are likely to be driven more by sector and occupation than by income level. That is, the relevant question was whether the voter belonged to an occupation that benefitted from or was harmed by foreign trade. Accordingly, in the antebellum era I distinguish mariners and farmers from artisans and industrial workers. The former have much to gain from increased international trade (and thus low tariffs), while industrial and craft workers tended to lose from increased exposure to foreign markets. Again, we see a curious tendency for twenty-first-century political economy to hark back to that of the antebellum era. As international trade again becomes central to the political debate, individual interests and occupations (e.g., steelmakers) stand to win and lose—not classes or income groupings (Bown and Kolb Reference Bown and Kolb2019). Indeed, political leaders have even resorted to payoffs to keep farmers within their electoral coalition (Stein Reference Stein2018).
Meanwhile, the political dynamics of the late nineteenth century also bear some resemblance to those of the high-tax middle of the twentieth century. Like the New Deal before it, the Civil War drastically raised the federal government’s need for revenue, leading to the first federal income tax, and a dramatic increase in the burden of Massachusetts’ taxes. Bullock (Reference Bullock1916: 8) writes that in 1874 the “strain of such high rates was greater than the existing system could possibly endure, and therefore taxation immediately became a ‘problem’ in Massachusetts.” Tax policy, then, also leads to the expectation that a diffuse occupational basis for party affiliations will give way to class-based political mobilization beginning in the Third Party System. Thus:
Law and Regulation Hypothesis 1: The First and Second Party systems are best described by a complex occupational structure.
Law and Regulation Hypothesis 2: The Third Party System is best described by a classlike structure.
Property
Pakulski and Waters (Reference Pakulski and Waters1996: 285–86) argue that increased rates of small property ownership in the postindustrial era blur lines between propertied and nonpropertied categories. More recently, scholars have argued that the dichotomy of capital and labor has further been blurred in the twenty-first century by the “Uberization” of work, wherein an increasing number of workers are treated as self-employed contractors or entrepreneurs (Fleming Reference Fleming2017). Indeed, the self-employed are the most consistently Republican class in contemporary politics (Hout and Laurison Reference Hout, Laurison and Grusky2013: 1041). A similar state of affairs held in the early nineteenth century: Craft production still dominated American industry, and artisans occupied a liminal position between capital and labor (Lauritz Larson Reference Lauritz Larson2010). At this time, most artisans owned their tools and a workshop and could retire with a “competency” (Johnson Reference Johnson1978; Licht Reference Licht1995; Scranton Reference Scranton1983: 69–70; Wilentz Reference Wilentz1984). Furthermore, Republican ideology celebrated the nation’s large population of landowning yeoman farmers (McCoy Reference McCoy1980) and independent craftsmen (Shankman Reference Shankman2004). Republican ideology venerated the independence made possible by ownership of arable land, a workshop, or other productive property. Such values would have made artisans and yeoman identify all the more strongly with their occupations, as it was their identity as a bricklayer, a blacksmith, or a smallholder that gave them worth as independent men in a republican political system.
Property Hypothesis 1: The First Party System is best described by a complex occupational structure.
These republican identities were threatened by the concentration of wealth associated with the industrialization and incorporation of the economy. Master craftsmen who owned a small workshop and employed a handful of journeymen still spoke of themselves as “small capitalists” during the Jacksonian era. But the Market Revolution drove most of these master craftsmen to work for wages (Lauritz Larson Reference Lauritz Larson2010: 107), and those that did remain independent increasingly realized that they were not capitalists in the same sense as factory owners were. The concentration of economic power only increased with the advent of railroads and the rise of trusts and holding companies (Lindert and Williamson Reference Lindert and Williamson2016: 10–11; Perrow Reference Perrow2002; Roy Reference Roy1997). Furthermore, the flow of immigrants into Massachusetts during the mid- and late nineteenth century increased the proportion of propertyless residents (Handlin Reference Handlin1941).
Property Hypothesis 2: The Second and Third Party systems are best described by classlike structures.
Once again, we see the antebellum era and the modern era serving as curious bookends to the golden age of industrial capitalism. From the late nineteenth to the middle of the twentieth century, a critical mass of voters identified primarily as working-class wage earners. This is in contrast to the antebellum era of occupationally variegated craft and artisan consciousness. It is also in contrast to the twenty-first-century revitalization of republican producerism, which has led even low-income workers to identify with various strains of “entrepreneurialism” (Doody et al. Reference Doody, Chen and Goldstein2016; Peck Reference Peck2014).
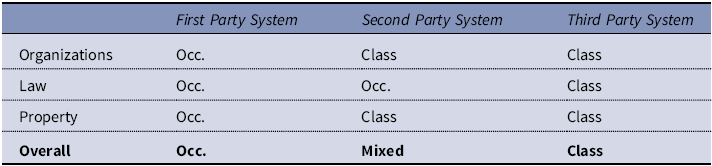
What happens when we consider the implications of these three intermediating factors at once? These hypotheses are summarized in table 1. The preceding discussion has generated an expectation for a complex occupational structure during the First Party System, an intermediate “proto-class structure” during the Second Party System, and a class-based structure during the Third Party System.
Summary of hypotheses

Data, Methods, and Analytical Approach
Class Voting Versus Class Representation
This article analyzes class representation, not class voting (Carnes Reference Carnes2013). Class and party affiliation among legislators is worth studying in its own right. These men were the party “activists” responsible for state legislation during a period when the most consequential legislation tended to occur at the state level, including corporate policy, banking policy, and bankruptcy law. State legislatures were also responsible for electing US Senators.
However, there is reason to believe that party affiliation among legislators tells us something about party affiliation among the electorate at large. Rational choice theories of legislatures often assume that legislators are a class of their own. Because their primary interest is reelection, their policy positions come to align with the interests of the median voter in their district (Aldrich Reference Aldrich2011). In such a world, the class background of legislators is less relevant than the class composition of the electorate. However, this analysis of legislators qua legislators does not apply here, because few legislators expected to be reelected and serve more than one or two single-year terms. Before 1861, 47.3 percent of Massachusetts’ legislators served only a single year, 23.8 percent served two years, and 10.0 percent served three years. Less than 10 percent of legislators served for six years or longer. Thus for the vast majority of these men, their policy preferences and material interests remained those of their primary occupation. Those men who served long enough to develop the interests of a politician generally identified their primary occupation as a politician or related occupation: lawyer, journalist, or government official. Those who identified as workers, artisans, and farmers were thus even less likely to lose touch with their primary interests qua workers, artisans, and farmers.
Rather than elect “professional” representatives whose interests were aligned with their constituents through electoral mechanisms, voters elected representatives who directly embodied their interests. For example, Massachusetts’ shoe industry elected owners of shoe firms to represent them in the state legislature, only coming to rely on professional representatives in the late nineteenth century (Davis Reference Davis1951). These men were “representative” in the older, literal sense of the term. The constant churn of legislators through the legislature (more than 20,000 men in 100 years) implies that the majority of these men were not political elites, such as those dozen or so party leaders whose biographies have been studied by historians like Pessen (Reference Pessen1969). Rather, state legislators are representative of the most organized constituencies in their respective communities. When a shoemaker appears as a Democratic legislator in these data, this conveys information about the political orientation of shoemakers in that electoral district. Unlike correlational studies based on vote counts aggregated at the county level, individual-level data allay concerns about the ecological fallacy (Robinson Reference Robinson1950). Unlike studies based on a dozen party leaders, the sample is large enough to allow statistical inference from multivariable models.
Measuring Fit Versus Measuring Change
Ever since Clark and Lipset’s (Reference Clark and Lipset1991) discovery of a downward trend in the Alford Index (Alford Reference Alford1963), the class and party literature has unfolded as a search for new models and alternative operationalizations of the class-party relationship (Hout et al. Reference Hout, Brooks and Manza1995; Weeden and Grusky Reference Weeden and Grusky2005). These models rest on significantly different theoretical assumptions, but the literature has not fully investigated these assumptions because these studies use data from a relatively short period. Accordingly, there is not enough variation in underlying political and economic characteristics to assess what factors make a given theory applicable to a period. By introducing data spanning the nineteenth century, I am able to observe much more dramatic shifts in the political environment than have occurred since the advent of high-quality survey data like those typically used in these studies.
A second reason for the neglect of the role of underlying conditions on class voting is that, spurred by the provocative claim of a “dying of class” (Clark and Lipset Reference Clark and Lipset1991; Pakulski and Waters Reference Pakulski and Waters1996), most studies have aimed at resolving the question of whether or not there are discernable trends in class-party affiliation. Of course, to measure change, one must use an unchanging measuring instrument (Smith Reference Smith2005: 1). This leads researchers to choose an operationalization of class, and then show the time trend for this operationalization. However, my aim here is not to measure change in the degree of class-party behavior, but rather change in kinds of class-party behavior. As such, I take a different approach to modeling than most other contributions to this literature. Here, I show how the best-fitting operationalization of the social bases of political affiliations changes across historical periods (Grusky and Weeden Reference Grusky, Weeden, Lareau and Conley2008: 65).
Data and Methods
I investigate variability in the bases of the Massachusetts party system through use of a unique data set containing more than 20,000 state legislators who served in Massachusetts between 1795 and 1893. The time span of these data allow me to observe the rise and fall of four party systems: the First Party System, or Federalists versus Republicans (1795–1824); the Second Party System, or Whigs versus Democrats (1835–54) and the Civil War/Reconstruction-era Democrats versus Republicans (1855–77); and finally, the Third Party System, again Democrats versus Republican (1877–93). For most of these observations, we know party identification, occupation(s), place of birth, year of birth, county of electoral district, and ethnicity (inferred from surnames). Biographical data on these legislators, which comes from the US Census and other historical sources, is maintained by the State Library of Massachusetts. Upon obtaining a raw spreadsheet from the State Library, I spent a considerable amount of time cleaning and recoding these data so as to make them usable in quantitative analyses. The most difficult tasks in constructing this data set (creating class/occupational groupings and inferring ethnic background) are described in the following text.
Class and Occupation
Detailed data on occupations allow me to classify legislators by the class and interest groups to which they belong: for example, financial, mercantile, manufacturing, artisan, agricultural. Class groupings are similar to those used in conventional neo-Marxist (Wright Reference Wright2005) and neo-Weberian (Breen Reference Breen and Wright2005; Erikson and Goldthorpe Reference Erikson and Goldthorpe1992; Goldthorpe et al. Reference Goldthorpe, Llewellyn and Payne1980) class analyses, except that changes have been made to accommodate the period. For example, farmers are represented as a single class group rather than by distinguishing between farm owners and farm laborers. It is difficult to make such distinctions in the raw data, though in any case it is unlikely that many farm laborers would have been elected to the state legislature in this period.
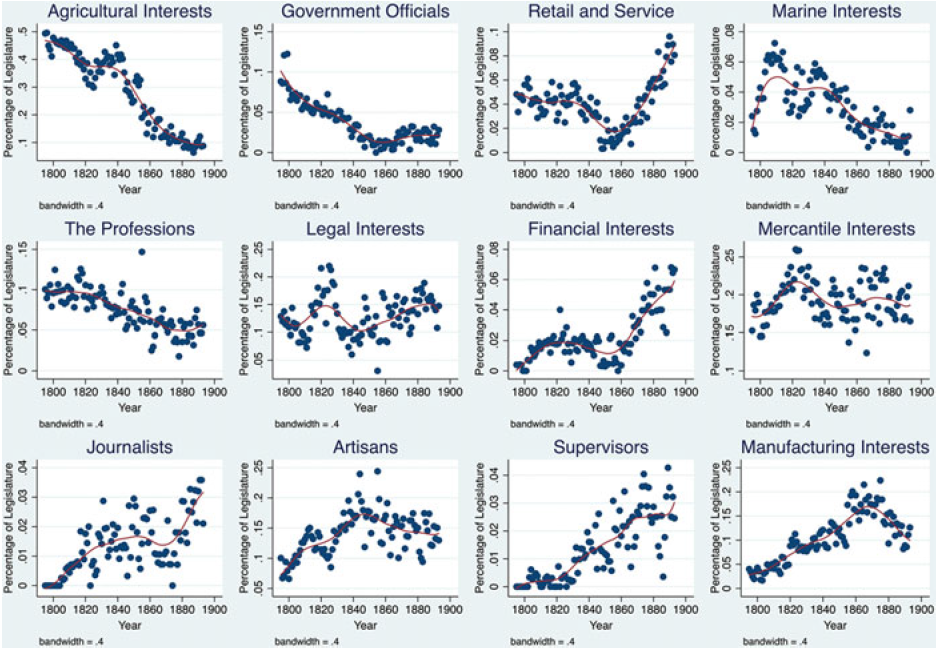
“Proto-class” sectoral interest groups are as follows: farmers, artisans (skilled and semiskilled workers), laborers (unskilled workers), mariners, financiers/bankers, merchants, manufacturers, retail and service proprietors, professionals, managerial/“upper” white-collar employees, clerical/“lower” white-collar employees, government employees, and government officials. Each of these interest groups is composed of occupational groups, which are too numerous to be listed separately here. Appendix tables A1–A3 breakout the occupations most commonly found within the larger interest groups. Figure 1 displays trends in the percentage of representatives coming from each proto-class interest group.
Occupational representation in Massachusetts State Legislature.

Noneconomic Identities
Nineteenth-century politics structurally excluded formal political participation of women, precluding gender-based electoral cleavages that are of increasing importance to the modern party system (Brady et al. Reference Brady, Sosnaud and Frenk2009; Pakulski and Waters Reference Pakulski and Waters1996: 680). This exclusion should strengthen the economic basis of party membership during this era. However, racial and ethno-religious identities were still able to challenge the primacy of class and occupational identities at times during the nineteenth century.
Irish Catholics were the most important ethnic minority group in nineteenth-century Massachusetts, and they demonstrated a marked affinity for the Democratic Party (Benson Reference Benson1961; Ignatiev Reference Ignatiev1995). The Irish Catholic cleavage is not expected to manifest itself in the legislature until the Third Party System—nor is the Irish Catholic cleavage expected to explain away the affiliation of artisans and labor with the Democrats. The Democratic Party of the Second Party System had been formed before the first great waves of Irish Catholic immigration to Massachusetts. While those Irish immigrants with the right to vote did gravitate toward the Democrats, they were not yet numerous enough able to establish themselves in the state legislature (Formisano Reference Formisano1983: 297). The Civil War was an upheaval of the political system significant enough to scramble existing coalitions, clearing room in the Democratic Party for the burgeoning Irish Catholic population to elevate their own to the state legislature. Because Irish Americans are expected to affiliate with Democrats in the Third Party System, it is important to account for Irish ethnicity in the formal models.
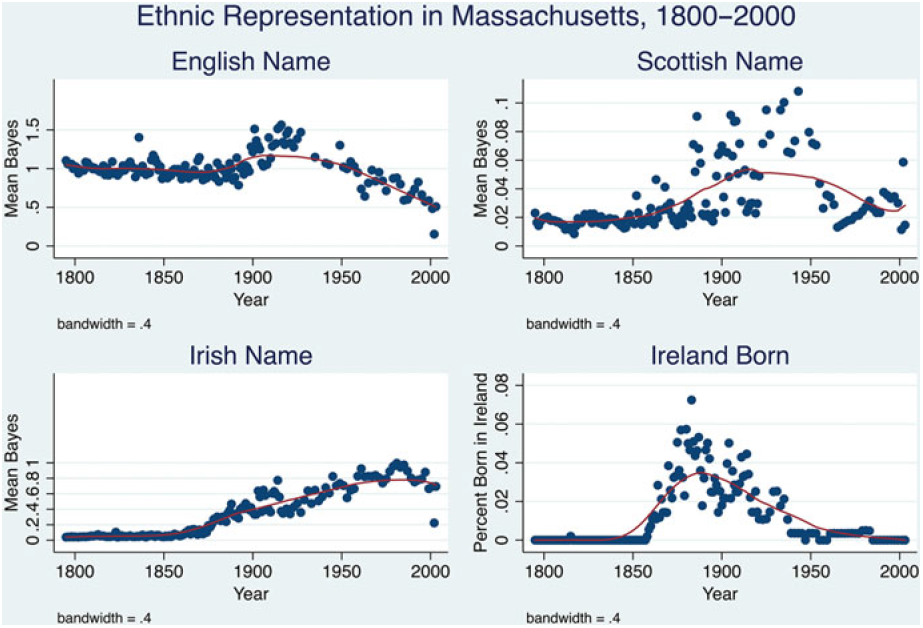
There are two sources of information on legislator ethnicity: surnames and reported place of birth. While place of birth is a more certain indicator of Irish ethnicity than is a surname, American-born citizens may nonetheless still identify (and be identified) with their Irish background. The sample may also contain Ireland-born Protestants who identify with their Scottish or English heritage. Accordingly, I control for birthplace and surname-based measures of ethnicity. Note that these two measures are very highly correlated until the late nineteenth century, when foreign-born Irish Americans begin to exit the legislature. Figure 2 displays trends in the presence of Irish legislators across the nineteenth and twentieth centuries.
Ethnic representation in the Massachusetts State Legislature.

To infer the ethnicity of legislators from surnames, I use Bayes’s Theorem. Bayes’s Theorem states that:
 $$\rm P(A|B) = P(B|A) * P(A) / P(B) $$
Bayes’s Theorem could therefore be used to infer the probability that a given legislator was of Irish heritage, by plugging the following quantities into Equation 1:
 $$\rm P(Irish|Surname) = P(Surname|Irish) * P(Irish) / P(Surname) $$
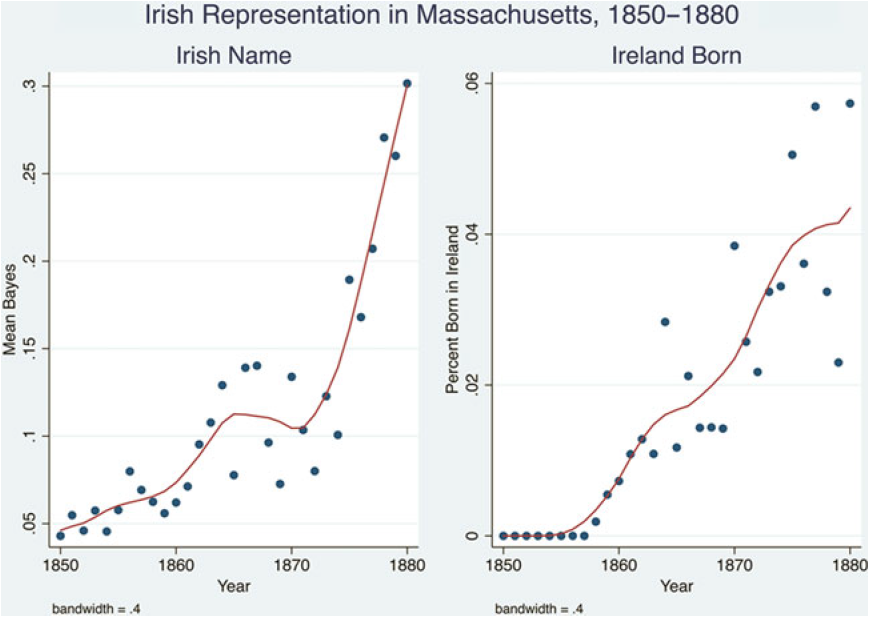
To obtain these quantities, I draw on the historical censuses of the United States and Ireland. The 1901 Irish Census tells me P(Surname|Irish), or the probability that a resident of Ireland had a given surname. The 1880 US Census tells me P(Surname), or the probability that a resident of the United States has a given surname. The 1870 US Census provides P(Irish), or the probability that a resident of a given county is Irish. Note that because of data limitations—Irish surname data is from a postmigration period, and the US Census did not collect information on ethnic background in many decades—this formula does not provide a measure neatly bounded by 0 and 1, as a probability should be. Nonetheless, the Bayes measure for Irish surnames increases steadily across the entire period, while the percentage of Ireland-born representatives begins to decrease just before 1900 and approaches 0 in 2000. This is exactly as we would expect, given overall trends in Irish immigration. Figure 3 zooms in on a period of high Irish immigration (1850–80), which shows a strong correlation between the Bayes measure and the proportion of Ireland-born legislators. This indicates the strong external validity of the Bayes measure as an indicator of Irish ethnicity. I standardize these variables so that they are not mistaken as probabilities.
Irish birth and Irish ethnicity, 1850–80.

Appendix table A4 lists the “most Irish” and “least Irish” surnames as measured by Bayes’s Theorem. For comparison, I calculated similar scores from the English and Scottish Censuses of 1881. Appendix table A4 also displays the most/least Scottish and English names in the sample too. Because of British colonialism, a surname that scores highly on “Irishness” may also score highly on “Scottishness” or “Englishness.” Thus in some models I control for Scottishness and Englishness along with the Irishness variable.
Aligned in political opposition to Irish Americans were old-stock Yankees and the relatively small black population. Fourteen African American men—all Republicans—served in the Massachusetts state legislature between 1867 and 1902 (after which no African Americans served until 1947). Given the civil rights records of the two parties during the nineteenth century, the affinity of African Americans for the Republican Party needs no explication.
Yankee affinity for Whigs and Republicans was strongest among those who belonged to the perfectionist sects that pursued abolition, prohibition, and other reform movements (Benson Reference Benson1961; Carpenter and Schneer Reference Carpenter and Schneer2015; Sellers Reference Sellers1991). Thus I control in models for “moralistic occupations” (religious figures and teachers), which are likely to affiliate with the reformist parties (Whigs and Republicans) that supported state intervention on moral issues.
At the same time, the Yankee reformist tradition alienated occupations associated with vice—innkeepers, grocers (Formisano Reference Formisano1983: 298), brewers, and tobacconists. The Democrats, by contrast, were much more tolerant of high living (Pessen Reference Pessen1969). This moralistic cleavage did not emerge during the First Party System because the respectable classes exerted social control through personal influence rather than through political action (Formisano Reference Formisano1983: 312; Johnson Reference Johnson1978). This paternalism was possible because patronage relationships were stronger, and servants and apprentices still lived and worked under the same roof as their masters. Thus, I also control for “vice-affiliated occupations,” which are expected to align themselves with the Democrats during the Second Party System.
Finally, because Baptists and Democrats both objected to mandatory tax support for established Congregationalist churches (Formisano Reference Formisano1983: 280–300), Baptist ministers are not expected to affiliate with Federalists like other Protestant religious figures; instead, they are expected to affiliate with Democrats during the First Party System.
Other Controls
The most important set of controls are indicator variables for each Massachusetts’ county.Footnote 2 Politics were—and remain—highly correlated with place. This is not just because of concentration of particular industries into places, but also due to rivalries between central and peripheral towns (Benson Reference Benson1961; Formisano Reference Formisano1983; Merton Reference Merton1957).
Birth cohort allows for me to test claims that the National Republican/Whig Party was seen by ambitious young men as a good place to get a start without being in the shadow of older, established Federalists (Perrow Reference Perrow2002). However, note that in a political system without income taxes there may be less of an expectation for citizens to become more conservative with age. The inclusion of dummy variables for each year controls for changes affecting all legislators, allowing the model to detect trends in occupational alignments with parties net of overall popularity of parties (Brooks et al. Reference Brooks, Nieuwbeerta and Manza2006: 95). Year fixed effects help to account for shifts in party representation due to panics, wars, and national elections.
To analyze these data, I use multivariable logistic regression. Analyses of class voting that use indices such as the Alford Index or that use OLS regression have been found to be biased by changes in the relative size of classes or the absolute popularity of parties (Evans Reference Evans2000: 407; Thomsen Reference Thomsen1987). To assess conservatively which level of disaggregation of class groupings best fits each period, I use the BIC (Raftery Reference Raftery1995). BIC has a well-known tendency to prefer parsimony, and so suggestions by BIC to disaggregate classes into interest groups (and interest groups into occupations) are taken as serious indications of the complexity of the economic basis of the party system. I begin with models that regress party affiliation on the 13 “proto-class” interest groups discussed in the preceding text. I then systematically disaggregate the big interest groups to determine whether BIC prefers finer occupational details: for example, government employees are disaggregated into police/military and clerical government positions. Police/military can further be disaggregated into (obviously) police and military. For other interest groups like manufacturers, the disaggregation process is driven by data availability that reflects the prominence of industrial sectors in the Massachusetts economy. For example, Massachusetts had a booming shoe and boot industry, allowing for the easy disaggregation of shoe and boot manufacturers. However, Massachusetts lagged as a site for quarrying and mining, and so the few instances of these “manufacturers” remain coded as a “Manufacturing, Remainder” group for even the most disaggregated of models. Finally, I also use BIC to compare conventional “big class” models with models based on the 13 “proto-class” interest groups.
Findings
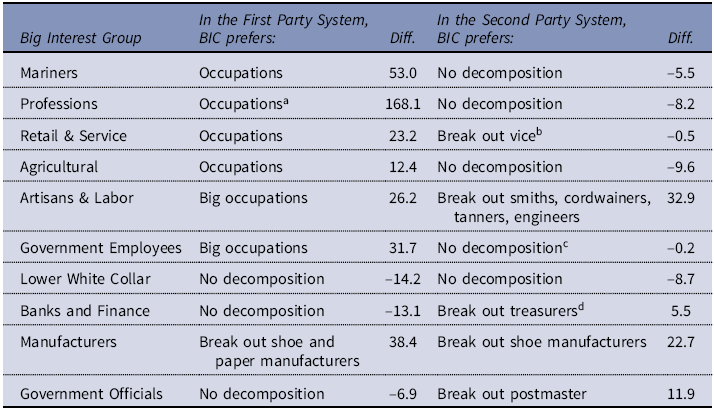
Table 2 displays outcomes for model selection driven by the BIC. For the First and Second Party systems, I first ran a baseline model that contained controls for proto-class interest groups: mariners, the professions, retail and service, agriculture, artisans and labor, government employees, lower white-collar employees, banks and finance, manufacturers, and government officials. In a number of instances, goodness-of-fit statistics indicated these interest groups were unnecessarily broad. For example, consider manufacturers. The single largest concentration of manufacturers in Massachusetts was the 24 percent of manufacturers who reported involvement in boot and shoe making (see table A2). I therefore compared the BIC of a model controlling for “manufacturing interest” with a model controlling for “boot and shoe manufacturers” and “manufacturing interest other than boot and shoe manufacturers.” BIC preferred this added control for both the First and Second Party systems. I then tried breaking out additional types of manufacturers. BIC did not prefer additional detail for the Second Party System, but did indicate that paper manufacturers should be broken out for the First Party System.
Decomposition of big interest groups in best-fit models

Notes: BIC for the undecomposed model is 11151.9 for the First Party System and 8227.7 for the Second Party System. If “Diff.” is negative, this represents the amount (in terms of BIC) by which the simplest decomposition made model fit worse.
a Break out occupations, but collapse scholars, educators, and artists.
b BIC slightly prefers no decomposition, but I have divided occupations by their involvement in vice (alcohol and tobacco). This only reduces BIC’s assessment by a negligible half-point, but is strongly preferred by AIC. It also makes theoretical sense.
c BIC slightly prefers no decomposition, but AIC suggests breaking out regulators.
d BIC preferred breaking out treasurers in comparison to the undecomposed baseline model. However, BIC strongly preferred a single “banks and finance” category in a model that already contained occupational variables for artisans, manufacturers, and government officials. Therefore, treasurers are not broken out in the best-fit model displayed in table 4.
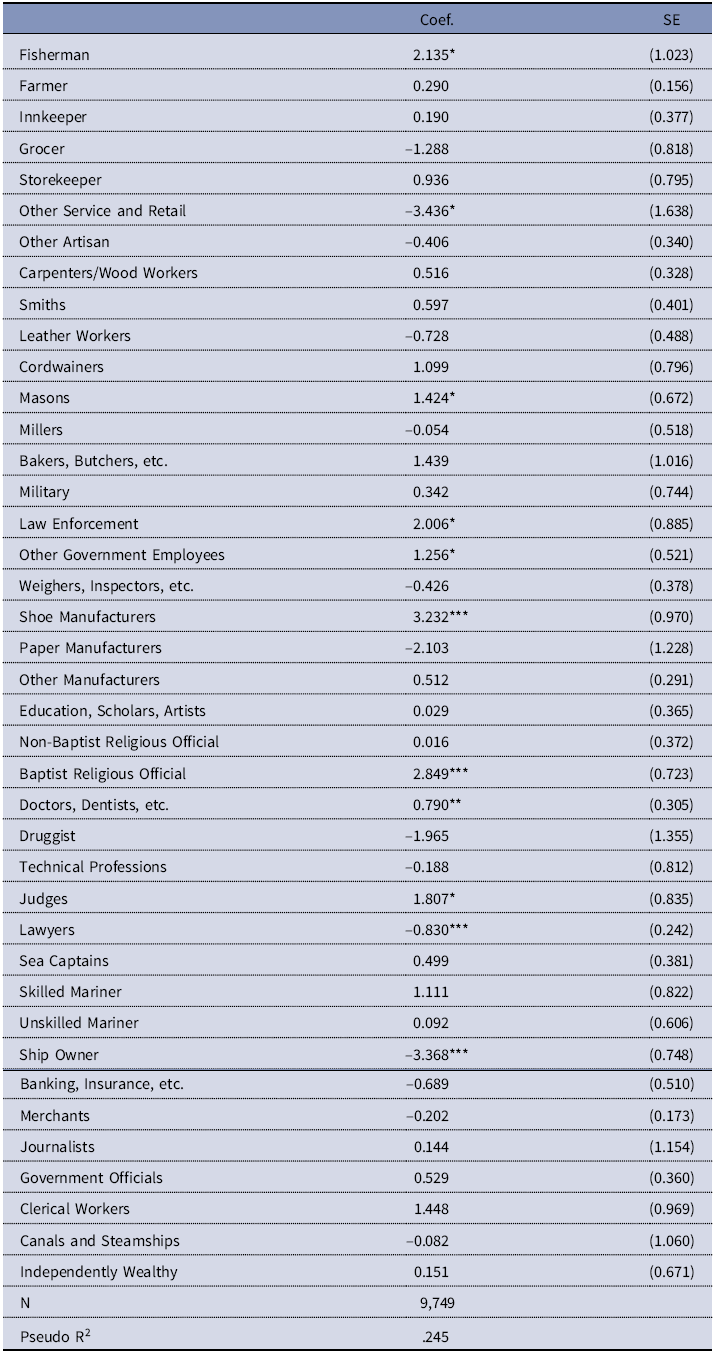
For the First Party System, the best-fit model did not involve any decomposition of lower white-collar workers, those who work in banks and finance, nor for government officials. As already noted, very little decomposition was wanted for manufacturers. However, extreme decomposition to the occupational level was preferred for artisans and laborers, mariners, the professions, those working in retail and services, agricultural workers, and low-level government employees.
Table 3 displays findings from this best-fit model for the First Party System. This table reveals the messy occupational structure underlying the First Party System. This messiness is consistent with the hypotheses summarized in table 1: During the First Party System, occupations with similar conditions of work could easily find themselves affiliating with different parties. Still, there are some intuitive findings here. Lawyers—that is, gentlemen—show a marked disposition for the more elitist Federalist Party. We can also discern the importance of law and regulation in the fact that shipowners—who would have suffered from Jeffersonian embargoes and restrictions on trade—also affiliate with the Federalists. It is interesting to note that “other service and retail” is significantly associated with the Federalists, but that this relationship only emerges after innkeepers (whose living relies on vice) are removed from the larger category. It is also worth noting that in models where proto-class interest groups are not decomposed to the extent that BIC prefers, bankers and merchants are significantly associated with the Federalist Party.
Best-fit logistic regression model for First Party System (Jeffersonian = 1)

Notes: Standard errors are clustered on 2,634 legislators. Controls for house, birth year, foreign born, year, and county not shown.
*p < .05; **p < .01; ***p < .001 (two–tailed).
The occupations that are significantly associated with Jeffersonian Republicans are, in some cases, harder to explain. Fishermen align with Jeffersonian Republicans, which may be explicable through the tendency of these humble producers to live in “peripheral” towns that are resentful of the wealth and power concentrated in Boston. Lee Benson (Reference Benson1961), an eminent historian of Jacksonian America, even cites Robert Merton (Reference Merton1957) on reference group theory to make this point. Likewise, the affiliation of Baptist religious officials with Republicans is expected, as reform churches were resentful of the Congregationalist establishment that, at this point, was still being upheld by the Federalist Party. The affiliation of judges, law enforcement, other government employees, and shoe manufacturers are surprising. Ad hoc explanations consistent with historiography could be hazarded, but the larger point to emphasize here is that in a period of occupational-specific organizations and legal structures, and in a period of widely distributed productive property, we observe an occupational basis for the First Party System.
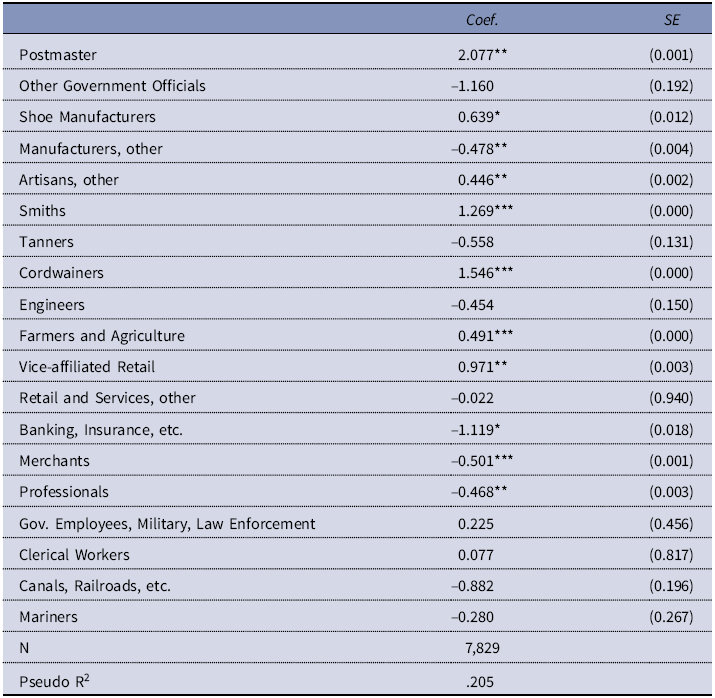
Moving on to the Second Party System, table 4 shows that the occupational structure underlying state politics has simplified by the 1830s. While BIC prefers a detailed occupational structure for First Party System, it prefers simplification to proto-classes for the Second Party System. Most intuitively, artisans support the Jacksonian Democrats. While BIC preferred that smiths and cordwainers be entered into the model separately, this is only because they favor Democrats even more so than the average artisan. Farmers also lean heavily toward the Democrats, while merchants, bankers, and professionals favor the National Republicans/Whigs. Again, the broader economic basis of party affiliation in this era is consistent with an account that highlights growing inequality and the increased span of economic organizations in civil society (Pakulski and Waters Reference Pakulski and Waters1996: 285–86).
Best-fit logistic regression model for Second Party System (Democrat = 1)

Notes: Standard errors are clustered on 4,551 legislators. Controls for house, birth year, foreign born, year, and county not shown. Neither Irish birth nor Irish ethnicity were significant, but including the latter forces dropping many observations. Therefore they are excluded from the displayed model.
*p < .05; **p < .01; ***p < .001 (two–tailed).
Table 4 also shows that manufacturers have moved toward their “natural” home in the Whig Party. As the majority of artisans fell into the ranks of wage labor (Lauritz Larson Reference Lauritz Larson2010), those who managed to expand their production began to affiliate with other representatives of capital like merchants and bankers. However, we once again see that shoe manufacturers favor Democrats. This relationship is perhaps explicable by the relatively small scale of shoe manufacturing during this period, such that it is hard to differentiate between a “manufacturer” and a “master craftsmen.” Dawley (Reference Dawley1976: 47) stresses that shoemaking was concentrated in agricultural villages because it was a premier “putting-out” industry. So it is possible that master shoemakers retained emotional connections to their republican roots in agriculture and craft production more so than other industries did.
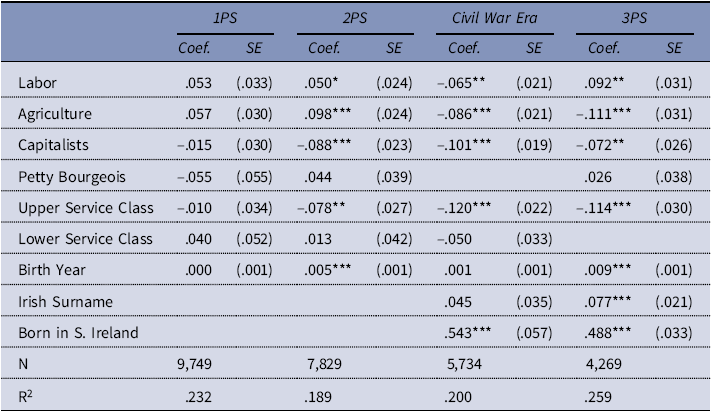
For the First and Second Party systems, BIC-driven model selection indicated a preference for models that were more disaggregated than the baseline “big class” model described in table 2. However, for the Third Party System (Civil War Era/Reconstruction and the Gilded Age) BIC indicated a preference for even more parsimonious models based on conventional large industrial classes. These models are displayed in table 5, where I fit models based on a six-class scheme for all four political eras. We see that the industrial class or “big class” model has no predictive power for First Party System. It is not the preferred model for the Second Party System, though it does generate some intuitive results: Labor and agriculture go to the Democrats, while capitalists and upper service class go to the Whigs.
OLS regression models using “large classes” for First to Third Party systems and Civil War/Reconstruction Era (Jeffersonian Republican/Democrat = 1)

Notes: OLS coefficients are displayed for ease of interpretation, but significance levels do not change significantly if a logistic regression model is used. Reference groups for class variables in the models are “unclassified” (1PS, 2PS), petty bourgeois (Civil War Era), and lower service class (3PS). In all cases, reference groups are reasonably close to parity in terms of party affiliation. All models include indicator variables for county and year, as well as controls for whether the term was for the House or Senate. 1PS and 2PS models control for being foreign born, but there are not enough cases to allow for analysis by country of birth. Standard errors are clustered on legislators.
*p < .05; **p < .01; ***p < .001 (two–tailed).
The traditional industrial class model finally becomes the preferred model for the Civil War Era. However, the most notable finding here is that the Irish born were 54 percentage points more likely to support the Democrats than the Republicans. (Note that from roughly 1850 to 1880, Irish birth and Irish ethnicity went hand in hand. See figure 3 for more details.) In fact, the big class model does not score that much better than an “Irish Only” model in terms of BIC. That said, the big class model does contain several statistically significant coefficients for class groups. National politics rendered Massachusetts a Republican stronghold during this era: labor, agriculture, capitalists, and the upper service class were all significantly more Republican than the petty bourgeois (used as a reference category) and the lower service class, both of which split relatively evenly between Democrats and Republicans.
Finally, what of the postbellum Gilded Age? After the end of reconstruction, BIC indicates a clear preference for the large industrial-class models. Labor goes strongly toward Democrats, while agriculture, capitalists, and the upper service class remain affiliated with Republicans. The petty bourgeois and the lower service class (used as a reference category) remain split between Republicans and Democrats. These groups did not fit as neatly into the overarching narrative of this era of unionization and employers’ associations (Wiebe Reference Wiebe1967), when legal and street battles were waged between capital and labor (Horwitz Reference Horwitz1992).
Discussion
The amount of variance explained by my models and the magnitude of the class effects is remarkably similar to those found by studies of contemporary democracies (Brooks et al. Reference Brooks, Nieuwbeerta and Manza2006). These analyses have found that if twentieth-century politics were driven heavily by class cleavages, then so were the Second and Third Party systems. While the First Party System was not primarily organized by class cleavages, it did have a definite occupational basis similar to that Weeden and Grusky (Reference Weeden and Grusky2005) have found for the late twentieth and early twenty-first century. The empirics, then, leave us with a similar image to that of the theoretical discussion: occupation-based party systems served as bookends to an era of industrial classes that lasted from the late nineteenth to the mid-twentieth century.
How should we explain such temporal variation in the economic basis of party systems? These findings complicate existing explanations for the patterning of political behavior by scholars like Wright (Reference Wright2005) and Erikson and Goldthorpe (Reference Erikson and Goldthorpe1992). If it were true that classes emerged from individuals’ similar reactions to shared experiences with markets and employment (Breen Reference Breen and Wright2005), then it is difficult to explain why the best-fit models for political behavior contain such rich occupational schema. Masons and cordwainers did not differ from leather workers in their work environment in any way that would predict conflicting party affiliations. The variability of occupation-party alignments through the nineteenth century, then, suggests that the rise of big classes proceeded apace with the intensification of the three factors discussed in the preceding text: the liberalization of economic regulation, the concentration of productive property, and the rise of class-spanning intermediary organizations. However, to what extent are each of these three factors responsible for the emergence of class politics?
This study cannot provide a definitive answer on its own. Indeed, the theoretical power of this study would be greatly increased if this analytical approach were to be applied to the party systems of other nineteenth-century states. Nonetheless, Massachusetts is a useful state to study because it was not so much unique among American states as it was precocious. For example, one economic historian writes:
The transformation and growth of the manufacturing sector in Massachusetts during the antebellum period has always exercised a particular fascination for economic historians perhaps because developments in the state prefigured in many respects the changes which took place in the economic structure of the country as a whole after the Civil War. (Field Reference Field1978: 146)
Massachusetts was a leader in many aspects of development that are relevant to this study: industrialization (Licht Reference Licht1995), the use of corporate charters (Kaufman Reference Kaufman2008; Sylla and Wright Reference Sylla and Wright2013), banking (Bodenhorn Reference Bodenhorn2003; Hammond Reference Hammond1957), unionization (Neem Reference Neem2008), strong political parties (McCormick Reference McCormick1966), and immigration (Handlin Reference Handlin1941).
That said, other states would serve as valuable comparison cases to the extent that they exhibit useful variation on potential explanatory factors. For example, it is well known that artisan-production and small-scale “proprietor” capitalism had a longer life in the Mid-Atlantic than in New England (Licht Reference Licht1995; Scranton Reference Scranton1983). This raises the question of whether “big class formation” was delayed there relative to the timing we see in this study. Meanwhile, the severely delayed industrialization of the South meant that wealthy planters were the elite reference group for voters, not industrialists. In fact, many artisans (including enslaved artisans) worked on plantations rather than in workshops, factories, or artisan communities as in the North. Future research could also link officeholders to tax and property records, which would facilitate estimates of how wealth and income related to political behavior during this period. Finally, an organizational census would be necessary to stringently assess the importance of organizations.
Until such complementary works can be done, it is perhaps better to think in terms of how organizational, property, and legal factors interact with one another rather than think of them as competing hypotheses. For example, even if we were to grant primacy to property relations in shaping party systems, this would not suggest that class analysts could afford to ignore intermediary organizations and the legal order. Property relations were likely fundamental to the strengthening of class politics during the nineteenth century, yet this is not to say that class politics strengthened “naturally” or effortlessly. Concerted work was done to build the intermediary organizations that directed certain kinds of individuals to particular parties. Such work, as performed both by party and nonparty actors, was central to the articulation of the class structure (de Leon et al. Reference de Leon, Desai and Tuğal2009, Reference de Leon, Desai, Tuğal, de Leon, Desai and Tuğal2015; Eidlin Reference Eidlin2018). Property relations and legal conditions may establish general constraints on which political coalitions are possible, but organizational factors determine which of the possible coalitions come into being. Those coalitions then alter policy, which feeds back into coalition-formation by affecting the concentration of productive property, by defining new categories of legal subjects, and by privileging some sorts of organizations over others (Campbell Reference Campbell2012). Organizations, then, overcome determinism and represent the entry point for political agency into this system. Politics could have been—and still can be—different.
Indeed, even rival identities to class have an organizational basis, including the ethno-racial cleavages of the Third Party System: Organized labor played a significant role in creating an economic caste system that relegated Black workers to low-skilled occupations while reserving occupations in the rapidly-expanding industrial sector to white workers (Dawley Reference Dawley1976: 132; Saxton Reference Saxton1990; Ignatiev Reference Ignatiev1995). The situation is no different today: Racialized policies continue to reinforce the salience of noneconomic identities, while organizational intermediaries compete with other organizations to peel away party supporters by emphasizing rival economic, ethno-religious, and nationalist identities (de Leon et al. Reference de Leon, Desai and Tuğal2009). In liberal democratic nations, then, the relationship between a citizen’s market position and political affiliation is ultimately inexplicable without reference to law, property relations, and the variegated organizations that constitute civil society. The final picture is one that is more Madisonian than Tocquevillian (Kaufman Reference Kaufman2002): Civil society is not merely integrative. Citizens organize in civil society in such a way that structures and accentuates political conflict.
Acknowledgments
I thank the following colleagues for their helpful comments on this article: Jason Beckfield, Daniel Carpenter, Frank Dobbin, Seth Gershenson, Carly Knight, Kim Pernell-Gallagher, Benjamin Snyder, and Benjamin Sosnaud.
Supplementary material
To view supplementary material for this article, please visit https://doi.org/10.1017/ssh.2020.26