

Resumen: El efecto relativo de la ubicación espacial y el ambiente sobre el mantenimiento de la alta diversidad beta de los bosques tropicales en gradientes altitudinales no es bien entendido. La composición florística y su relación con el suelo, el clima, la elevación y la distancia geográfica fue determinada en un paisaje de 1114 km2 en el Pacífico sur de Costa Rica, a lo largo de un gradiente altitudinal (0–1500 msnm). En 37 parcelas de 0.25-ha, > 200 especies de árboles (≥ 30 cm dap) y palmas de dosel (≥ 10 cm dap) fueron encontradas. Análisis de ordenación mostraron fuertes patrones de composición de especies relacionados a la altitud; las coordenadas de las parcelas sobre los principales ejes mostraron correlaciones negativas con la abundancia de Iriartea deltoidea (r = −0.54) y Brosimum utile (r = −0.65) ambas especies de bosques de bajura, y correlaciones positivas con especies de mayores altitudes como Alchornea glandulosa (r = 0.63), Quercus sp. (r = 0.50) y Ocotea sp. 2 (r = 0.48). Correlaciones de Mantel, correlogramas y análisis de partición de la varianza de las relaciones entre la composición florística y factores espaciales y ambientales indicaron que la ubicación espacial de las parcelas – potencialmente limitación en la dispersión – fue el determinante más importante (R2adj = 0.149) de la diversidad beta, pero que la heterogeneidad ambiental también juega un rol importante. En particular, el recambio de las especies de palmas estuvo fuertemente relacionado a las propiedades químicas del suelo. Los efectos de la limitación en la dispersión sobre el ensamblaje florístico podría determinar la distribución futura de las comunidades vegetales como resultado del cambio climático.
INTRODUCTION
The theories of niche assembly and dispersal assembly provide a valuable framework for interpreting the relationships between species composition and environmental and spatial heterogeneity, leading to a better understanding of the high species turnover and diversity of Neotropical rain forests (Condit et al. Reference CONDIT, PITMAN, LEIGH, CHAVE, TERBORGH, FOSTER, NÚÑEZ, AGUILAR, VALENCIA, VILLA, MULLER-LANDAU, LOSOS and HUBBELL2002, Potts et al. Reference POTTS, ASHTON, KAUFMAN and PLOTKIN2002). Niche assembly theory states that vegetation abundance and species composition patterns are determined by local environmental conditions and competition (de Blois et al. Reference DE BLOIS, DOMON and BOUCHARD2002, Jones et al. Reference JONES, TUOMISTO, CLARK and OLIVAS2006). Under dispersal assembly theory, in contrast, community composition depends on the composition of the surrounding communities and species dispersal capacity, and floristic similarity among sites is predicted to decrease with increasing geographical distance (higher spatial isolation) because of spatially limited dispersal, independent of any environmental difference (Hubbell Reference HUBBELL2001).
There is no consensus regarding the relative importance of niche and dispersal assembly in tropical forests. Several authors (Costa et al. Reference COSTA, GUILLAUMET, LIMA and PEREIRA2009, Duque et al. Reference DUQUE, SÁNCHEZ, CAVELIER and DUIVENVOORDEN2002, Jones et al. Reference JONES, TUOMISTO, CLARK and OLIVAS2006, Reference JONES, TUOMISTO, BORCARD, LEGENDRE, CLARK and OLIVAS2008; Phillips et al. Reference PHILLIPS, NÚÑEZ-VARGAS, MONTEAGUDO, PEÑA-CRUZ, CHUSPEZANS, GALIANO-SÁNCHEZ, YLI-HALLA and ROSE2003, Pyke et al. Reference PYKE, CONDIT, AGUILAR and LAO2001, Ruokolainen et al. Reference RUOKOLAINEN, TUOMISTO, MACÍA, HIGGINS and YLI-HALLA2007, Sesnie et al. Reference SESNIE, FINEGAN, GESSLER and RAMOS2009, Tuomisto et al. Reference TUOMISTO, RUOKOLAINEN and YLI-HALLA2003a, Reference TUOMISTO, RUOKOLAINEN, AGUILAR and SARMIENTO2003b) suggest that environmental variables are the most important determinants of beta diversity. Others indicate a predominant role for dispersal limitation (Bohlman et al. Reference BOHLMAN, LAURANCE, LAURANCE, , NASCIMENTO, FEARNSIDE and ANDRADE2008, Chust et al. Reference CHUST, CHAVE, CONDIT, AGUILAR, LAO and PÉREZ2006, Duque et al. Reference DUQUE, PHILLIPS, VON HILDEBRAND, POSADA, PRIETO, RUDAS, SUESCÚN and STEVENSON2009, Normand et al. Reference NORMAND, VORMISTO, SVENNING, GRÁNDEZ and BALSLEV2006, Vormisto et al. Reference VORMISTO, SVENNING, HALL and BALSLEV2004). Contrasting results seem likely to be due partly to differences in the plant groups studied (Sesnie et al. Reference SESNIE, FINEGAN, GESSLER and RAMOS2009), the environmental variables measured (Jones et al. Reference JONES, TUOMISTO, BORCARD, LEGENDRE, CLARK and OLIVAS2008), the spatial scale of observation and the associated degree of environmental heterogeneity in the landscapes (Condit et al. Reference CONDIT, PITMAN, LEIGH, CHAVE, TERBORGH, FOSTER, NÚÑEZ, AGUILAR, VALENCIA, VILLA, MULLER-LANDAU, LOSOS and HUBBELL2002, Costa et al. Reference COSTA, GUILLAUMET, LIMA and PEREIRA2009, Honorio Coronado et al. Reference HONORIO CORONADO, BAKER, PHILLIPS, PITMAN, PENNINGTON, VÁSQUEZ MARTÍNEZ, MONTEAGUDO, MOGOLLÓN, DÁVILA CARDOZO, RÍOS, GARCÍA-VILLACORTA, VALDERRAMA, AHUITE, HUAMANTUPA, NEILL, LAURANCE, NASCIMENTO, SOARES DE ALMEIDA, KILLEEN, ARROYO, NÚÑEZ and FREITAS ALVARADO2009, Jones et al. Reference JONES, TUOMISTO, CLARK and OLIVAS2006, Sesnie et al. Reference SESNIE, FINEGAN, GESSLER and RAMOS2009). Bohlman et al. (Reference BOHLMAN, LAURANCE, LAURANCE, , NASCIMENTO, FEARNSIDE and ANDRADE2008), Condit et al. (Reference CONDIT, PITMAN, LEIGH, CHAVE, TERBORGH, FOSTER, NÚÑEZ, AGUILAR, VALENCIA, VILLA, MULLER-LANDAU, LOSOS and HUBBELL2002), Duque et al. (Reference DUQUE, SÁNCHEZ, CAVELIER and DUIVENVOORDEN2002, Reference DUQUE, PHILLIPS, VON HILDEBRAND, POSADA, PRIETO, RUDAS, SUESCÚN and STEVENSON2009) and Tuomisto et al. (Reference TUOMISTO, RUOKOLAINEN and YLI-HALLA2003a) report that environmental control of compositional similarities is stronger at regional scales and geographical control at finer scales. Across the Amazon basin, on the other hand, Honorio Coronado et al. (Reference HONORIO CORONADO, BAKER, PHILLIPS, PITMAN, PENNINGTON, VÁSQUEZ MARTÍNEZ, MONTEAGUDO, MOGOLLÓN, DÁVILA CARDOZO, RÍOS, GARCÍA-VILLACORTA, VALDERRAMA, AHUITE, HUAMANTUPA, NEILL, LAURANCE, NASCIMENTO, SOARES DE ALMEIDA, KILLEEN, ARROYO, NÚÑEZ and FREITAS ALVARADO2009) report that geographical distance is more important in explaining species turnover, while soil fertility plays a more important role at smaller scales.
The lack of attention to altitudinal gradients in these studies is notable. Variation in tropical forest structure and floristics with altitude is marked (Homeier et al. Reference HOMEIER, BRECKLE, GÜNTER, ROLLENBECK and LEUSCHNER2010, Lieberman et al. Reference LIEBERMAN, LIEBERMAN, PERALTA and HARTSHORN1996, Macía et al. Reference MACÍA, RUOKOLAINEN, TUOMISTO, QUISBERT and CALA2007, Martin et al. Reference MARTIN, FAHEY and SHERMAN2011) making a major contribution to high biodiversity in global hotspots (Malhi et al. Reference MALHI, SILMAN, SALINAS, BUSH, MEIR and SAATCHI2011), and its underlying causes are complex (Grubb Reference GRUBB1977). In all these studies, niche assembly is the implicit underlying model of species turnover. The potential roles of spatial location and dispersal limitation remain largely untested.
Working in terra firme forest sites along an altitudinal gradient in a fragmented landscape of south Pacific Costa Rica, we therefore sought to (1) characterize forest sites according to their floristic composition, (2) quantify floristic and environmental differences among forest sites, (3) determine the spatial structure of floristic and environmental characteristics, and (4) assess relationships between species composition and environment, altitude and geographical distance. Two alternative general hypotheses are proposed: (1) species composition is determined by environmental variability, with spatial autocorrelation of species composition related to the existence of environmental gradients, even when geographical distance is controlled (niche assembly); and (2) species composition is determined by dispersal limitation, thus floristic similarity decreases as geographical distance increases, even when environment is controlled (dispersal assembly). Because palms represent an a priori functional group (Chazdon et al. Reference CHAZDON, FINEGAN, CAPERS, SALGADO-NEGRET, CASANOVES, BOUKILI and NORDEN2010) and show a well-defined response to environmental variation (Clark et al. Reference CLARK, CLARK, SANDOVAL and CASTRO1995, Costa et al. Reference COSTA, GUILLAUMET, LIMA and PEREIRA2009, Poulsen et al. Reference POULSEN, TOUMISTO and BALSLEV2006, Sesnie et al. Reference SESNIE, FINEGAN, GESSLER and RAMOS2009) we determined their response separately from that of dicot trees.
METHODS
Study site
The study was carried out in a landscape that links La Amistad International Park, in the Cordillera de Talamanca, and the protected areas of the Osa Peninsula, in the south Pacific region of Costa Rica (Figure 1). The 1114-km2 landscape encompasses an altitudinal gradient from sea level to more than 1500 m asl. From south-west to north-east, terrain rises abruptly from the coast to 1500 m asl in the south coastal range (Fila Costeña del Sur), which functions as a geographical barrier 18–20 km from the coast. It is a fragmented landscape where remnant forest patches are surrounded by coffee plantations on higher ground in the north and oil palm in the lowlands to the south (Céspedes et al. Reference CÉSPEDES, FINEGAN, HERRERA, DELGADO, VELÁSQUEZ and CAMPOS2008). Three large forest patches (> 1000 ha) exist within areas containing a low probability of land-use change, in addition to an important number of smaller forest patches (Céspedes et al. Reference CÉSPEDES, FINEGAN, HERRERA, DELGADO, VELÁSQUEZ and CAMPOS2008).
Location of the studied landscape at the south Pacific region of Costa Rica. Remnant forest patches, protected areas and locations of sample plots are observed.

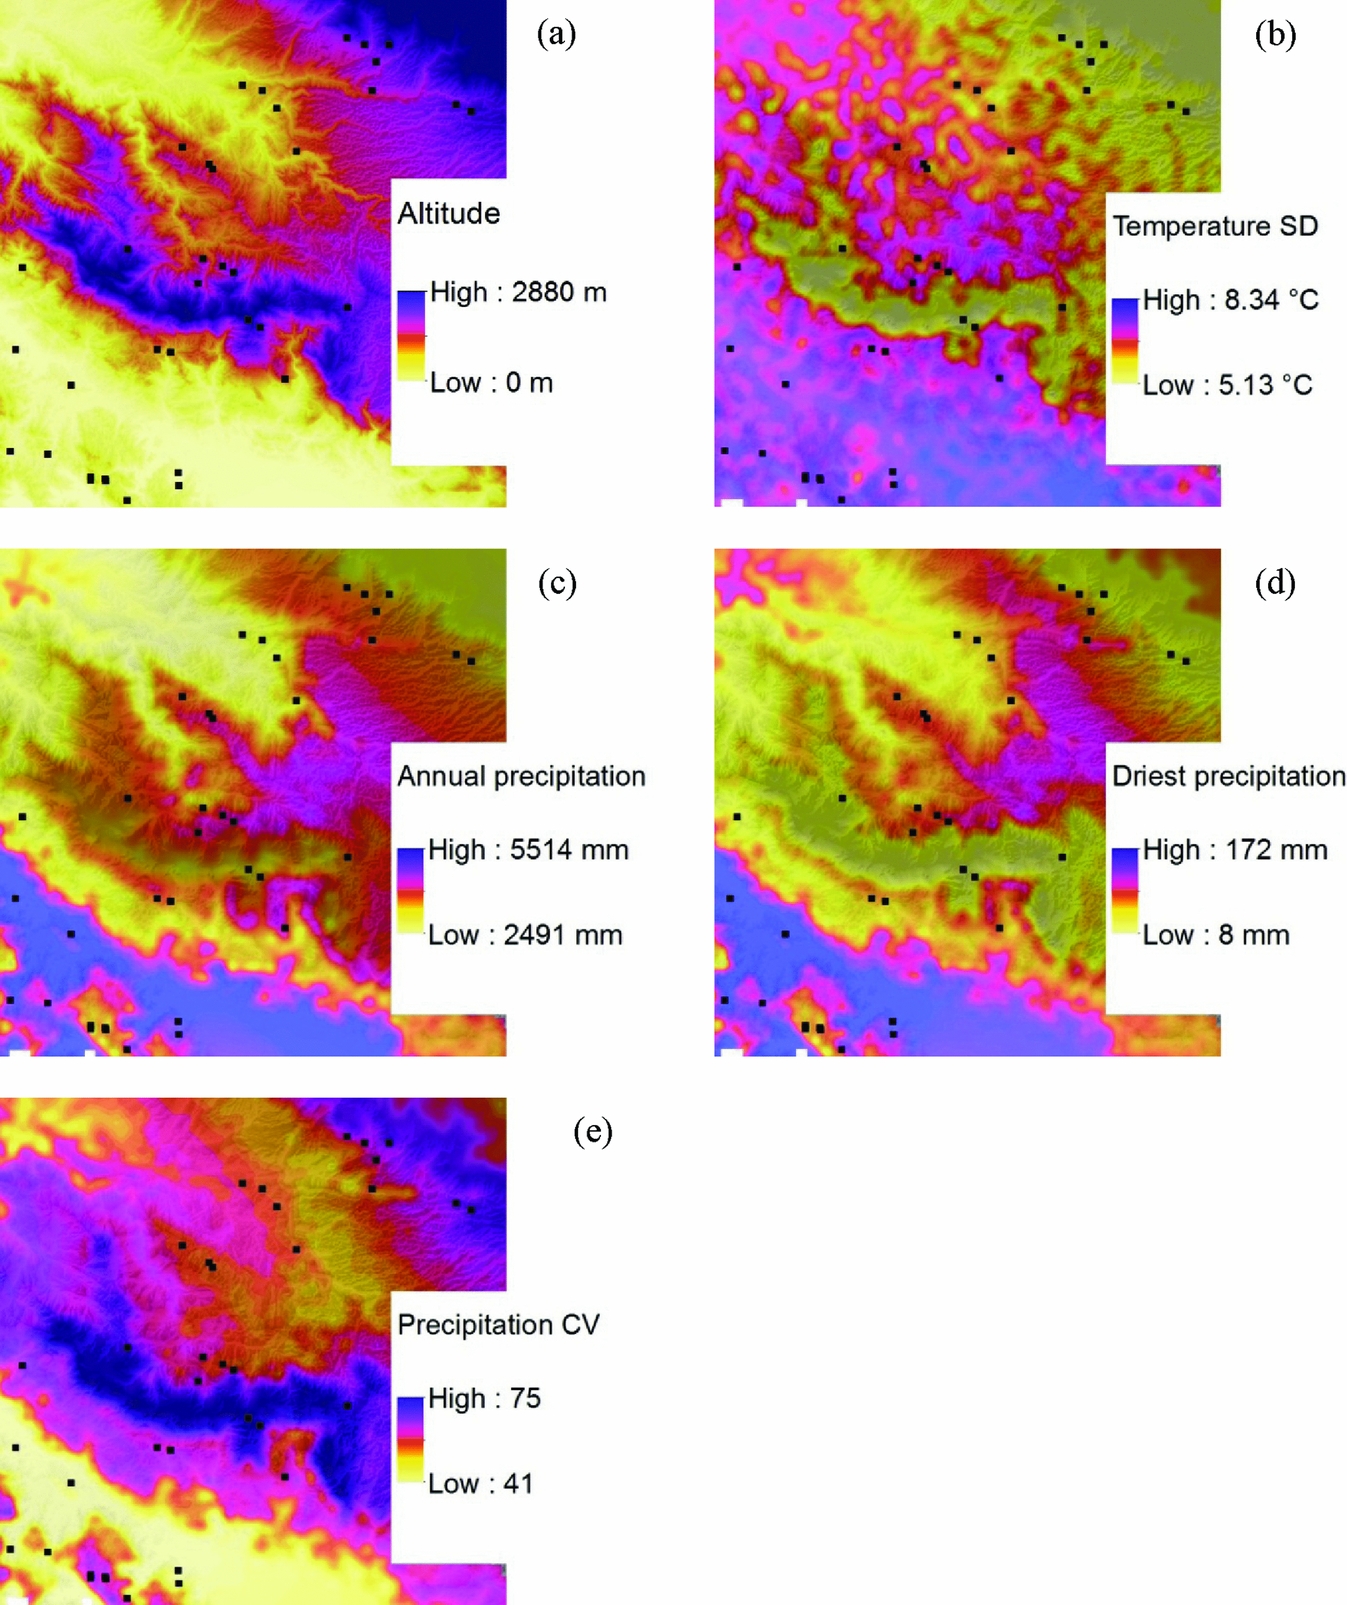
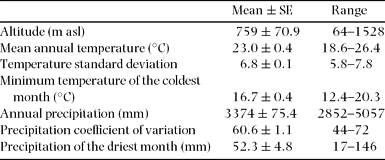
Predominant soil types are poorly developed entisols and acid, infertile utisols, and moderately fertile inceptisols (Fassbender & Bornemisza Reference FASSBENDER and BORNEMISZA1987, ITCR 2004, Sánchez Reference SÁNCHEZ1981). Annual rainfall ranges from 3000 to 5500 mm (ITCR 2004). Two seasons are recognized, a drier one from December to April, with the lowest rainfall in February, and a wetter season the rest of the year where October is the wettest month (IMN, http://www.imn.ac.cr/educacion/climacr/pacifico_sur.html). Mean annual temperature at the lowest point in in our sampling corresponded to c. 26 °C and c. 19 °C at the highest point (Figure 2; Table 1).
Illustration of climate gradients in the studied landscape. Sampled vegetation plots are indicated by black squares. Altitude (a), temperature seasonality given by temperature standard deviation (b), annual precipitation (c), and seasonal precipitation regimes given by precipitation of the driest month (d) and precipitation coefficient of variation (e), are shown.

Climatic and altitude attributes of the 37 (0.25 ha) vegetation plots sampled in the studied landscape.

Field sampling and measurements
We adopted the sampling protocol developed by Ramos & Finegan (Reference RAMOS and FINEGAN2006) and Sesnie et al. (Reference SESNIE, FINEGAN, GESSLER and RAMOS2009) and shown by the latter authors to be effective for testing hypotheses like ours. A total of thirty-seven 0.25-ha plots (50 m × 50 m) were established between the altitudes of 64 m and 1528 m asl in forest patches with a minimum area of 5 ha (Figure 1). Sites with manageable access were selected and extreme conditions of flooded or disturbed areas were avoided, identifying only terra firme environments. Plots were positioned at random points at a minimum distance of 150 m from the forest edge and at least 300 m from the nearest neighbouring plot. On large forest patches we often established more than one plot. All plots were geo-referenced using a GPS (Garmin GPSMAP®60CSx), and altitude was recorded using a calibrated altimeter. On each plot, the stem diameter at breast height (dbh, 1.3 m) of all dicot trees ≥ 30 cm dbh and palms ≥ 10 cm dbh was measured. Species were identified on site by a parataxonomist and when necessary, herbarium samples were taken and identified by Nelson Zamora, curator of botany at Costa Rica's National Institute for Biodiversity (INBio) (Bouroncle & Finegan Reference BOURONCLE and FINEGAN2011, Finegan & Delgado Reference FINEGAN and DELGADO2000, Sesnie et al. Reference SESNIE, FINEGAN, GESSLER and RAMOS2009).
We collected a homogenized soil sample compiled from five subsamples up to 30 cm depth in each sample plot. Soil depth was determined using a 1.10-m-long metal rod. Soil was analysed at the soils laboratory of the Centro Agronómico Tropical de Investigación y Enseñanza (CATIE), in Turrialba, Costa Rica, where samples were air-dried and soil chemical and physical analysis conducted. Soil texture (per cent of sand, silt and clay) was determined by the Bouyoucos method. Extractable K and P were measured using Modified Olsen extractions with a 0.5 M sodium bicarbonate (NaHCO3) solution at a pH of 8.5. Soil pH in water was measured, and extractable Ca, Mg, and total acidity extractions were done in a 1N suspension of potassium chloride (KCl).
Temperature and precipitation data were taken for each sample plot from Worldclim (http://www.worldclim.org/) digital data layers. Worldclim data represent average global climate grids from the years 1950–2000, with a resolution of c. 1 km2 (30 arc-second). Worldclim data have been previously used to map and spatially model species distributions using geographical information systems (Hijmans et al. Reference HIJMANS, CAMERON, PARRA, JONES and JARVIS2005). We used mean annual temperature (Ann Temp) and two measures of seasonal temperature variation, minimum temperature of the coldest month (Min Temp) and temperature standard deviation (Temp SD). Annual precipitation (Ann prec) and rainfall seasonality from precipitation coefficient of variation (Prec CV) and pre-cipitation of the driest month (Prec Driest) were also taken for further statistical comparison with floristic data.
Data analyses
To visualize relationships between plots and the most important species contained within them we performed a Non-metric Multidimensional Scaling (NMS) ordination analysis in PC-ORD v. 4.25 (PC-ORD. Multivariate analysis of ecological data, Version 4.25, MjM Software Design, Gleneden Beach, Oregon, USA), using the autopilot option and the Sørensen similarity coefficient. Ordination was carried out using the importance value index (IVI) of each species. Forty runs with real data and 50 runs with randomized data were used to evaluate the stability of the final ordination. Only species recorded in two or more plots were taken into account for this analysis (Greig-Smith Reference GREIG-SMITH1983).
Pearson correlations to determine whether significant relationships (P < 0.05) existed among soil, climate, and altitude variables were performed using the InfoStat statistical package (InfoStat 2010, Grupo InfoStat, Universidad Nacional de Córdoba, Córdoba, Argentina).
Relationships between floristic, environmental, altitude and geographical distances were assessed through Mantel correlation tests. Bray–Curtis distance matrices were computed for abundances of all species and for palm abundance separately. Euclidean distance matrices were obtained for soil, climate and altitude variables, as well for geographical distance (from plots coordinates) which were transformed to natural logarithms (Hubbell Reference HUBBELL2001). Combined Euclidean environmental matrices were obtained for all climate variables (Climate), all soil variables (Soil), all soil texture variables (Soil T), and all soil chemical variables (Soil Q); when necessary the variables were standardized before computing the combined matrices. The statistical significance of simple rM was estimated by 999 permutations (Legendre & Legendre Reference LEGENDRE and LEGENDRE1998). Since multiple tests are done simultaneously we compared probabilities P to a Bonferroni-corrected probability level of α’ = α/k, where α = 0.05 and k is the total number of tests performed (Legendre & Legendre Reference LEGENDRE and LEGENDRE1998).
When multiple factors are correlated with floristic composition, the assessment of spatial autocorrelation allows spatial patterns to be identified among environmental variables, providing a better understanding of the relationship between environmental variables and floristic composition and distribution. Using the PASSaGE v.2 software (Rosenberg & Anderson Reference ROSENBERG and ANDERSON2011), the degree of spatial autocorrelation between floristic composition and environmental variables was evaluated using Mantel correlograms, where Mantel correlation coefficients (rM) are compared between distance classes to determine the level of spatial autocorrelation among variables through increasing interplot distances. Distance classes ranged from 0.3–48 km, according to minimum and maximum distance between plot pairs, spaced initially in 0.3-km intervals and then at 3-km intervals. The statistical significance of rM in the correlogram was estimated by 999 permutations, and P values were adjusted using a progressive Bonferroni correction following Legendre & Legendre (1998).
In addition to the frequently used Mantel correlation-based approach to test hypotheses like ours, we performed a variation partitioning analysis (Borcard et al. Reference BORCARD, LEGENDRE and DRAPEAU1992, Legendre Reference LEGENDRE2008) to partition the variation of species composition into the contributions of soil, climate, altitude and space mechanisms that are correlated to dicot tree and palm species in the landscape. Following Legendre & Gallagher (Reference LEGENDRE and GALLAGHER2001) and Jones et al. (Reference JONES, TUOMISTO, BORCARD, LEGENDRE, CLARK and OLIVAS2008), prior to the analysis we transformed the species abundances using a Hellinger transformation to downweight the most abundant species in the analysis. The decostand function in the vegan library (vegan: Community Ecology Package, R package version 2.1–14/r2120, http://R-Forge.R-project.org/projects/vegan/) of R statistical software (R: A Language and Environment for Statistical Computing, R Development Core Team, http://www.R-project.org) was used.
The spatial structure was represented by positive eigenvalues generated by a principal coordinates of neighbour matrices (PCNM) analysis. PCNMs are constructed from a matrix of geographical distance among samples and used as spatial predictors that can be easily incorporated as explanatory variables into regression models or canonical analysis (Borcard & Legendre Reference BORCARD and LEGENDRE2002, Dray et al. Reference DRAY, LEGENDRE and PERES-NETO2006). PCNMs were generated using the PCNM library in R (PCNM: PCNM spatial eigenfunction and principal coordinate analyses, R package version 2.1/r82, http://R-Forge.R-project.org/projects/sedar/).
Following Jones et al. (Reference JONES, TUOMISTO, BORCARD, LEGENDRE, CLARK and OLIVAS2008) and Legendre et al. (Reference LEGENDRE, MI, REN, MA, YU, SUN and HE2009), a two-step forward selection (Blanchet et al. Reference BLANCHET, LEGENDRE and BORCARD2008) was run on each set of environmental (climate or soil variables significantly related to species composition according to previous Mantel tests) and spatial (PCNMs) explanatory variables separately in order to select those with a significant (P < 0.05, 999 random permutations) contribution to explaining variation in floristic composition. The function forward.sel in packfor R library (packfor: Forward Selection with permutation (Canoco p.46), R package version 0.0–8/r100, http://R-Forge.R-project.org/projects/sedar/) was used, and only the selected variables were used in subsequent analyses. The forward selection procedure is based on permutation procedure using residuals from the reduced model in a redundancy analysis.
The variation of the dicot tree and palm community composition data and palm community separately was partitioned between soil, climate, altitude and PCNMs explanatory variables using redundancy analysis (Borcard et al. Reference BORCARD, LEGENDRE and DRAPEAU1992, Legendre et al. Reference LEGENDRE, MI, REN, MA, YU, SUN and HE2009). This analysis partitions the variation of response table Y with respect to two, three, or four explanatory tables, without the requirement of removing collinear variables prior to partitioning (Borcard et al. Reference BORCARD, LEGENDRE and DRAPEAU1992). Adjusted R2 values (Radj2) indicating the proportion of variation explained by each set of explanatory variables were reported (Peres-Neto et al. Reference PERES-NETO, LEGENDRE, DRAY and BORCARD2006). The significance of these fractions was tested by permutation tests (P < 0.05, 999 permutations). These analyses were computed using the functions varpart, rda and anova in the vegan library of R.
The use of canonical analysis on raw data offers more powerful tests of significance than regression on distance matrices (Gilbert & Bennett Reference GILBERT and BENNETT2010, Legendre et al. Reference LEGENDRE, BORCARD and PERES-NETO2005). However, the use of Mantel tests in our analysis permits comparison with previous studies testing hypothesis about the origin of beta diversity (Bohlman et al. Reference BOHLMAN, LAURANCE, LAURANCE, , NASCIMENTO, FEARNSIDE and ANDRADE2008, Duque et al. Reference DUQUE, PHILLIPS, VON HILDEBRAND, POSADA, PRIETO, RUDAS, SUESCÚN and STEVENSON2009, Honorio Coronado et al. Reference HONORIO CORONADO, BAKER, PHILLIPS, PITMAN, PENNINGTON, VÁSQUEZ MARTÍNEZ, MONTEAGUDO, MOGOLLÓN, DÁVILA CARDOZO, RÍOS, GARCÍA-VILLACORTA, VALDERRAMA, AHUITE, HUAMANTUPA, NEILL, LAURANCE, NASCIMENTO, SOARES DE ALMEIDA, KILLEEN, ARROYO, NÚÑEZ and FREITAS ALVARADO2009, Macía et al. Reference MACÍA, RUOKOLAINEN, TUOMISTO, QUISBERT and CALA2007, Sesnie et al. Reference SESNIE, FINEGAN, GESSLER and RAMOS2009).
RESULTS
Floristics
A total of 1365 individuals (391 palms and 974 dicot trees) from 237 species (eight species of palm and 229 of tree), 149 genera and 54 families were recorded (Appendix 1). More than 80% of individuals were identified to the species level; grouping individuals with similar morphological characteristics the rest were assigned either to genus (14%) or unknown morphospecies (3%) level.
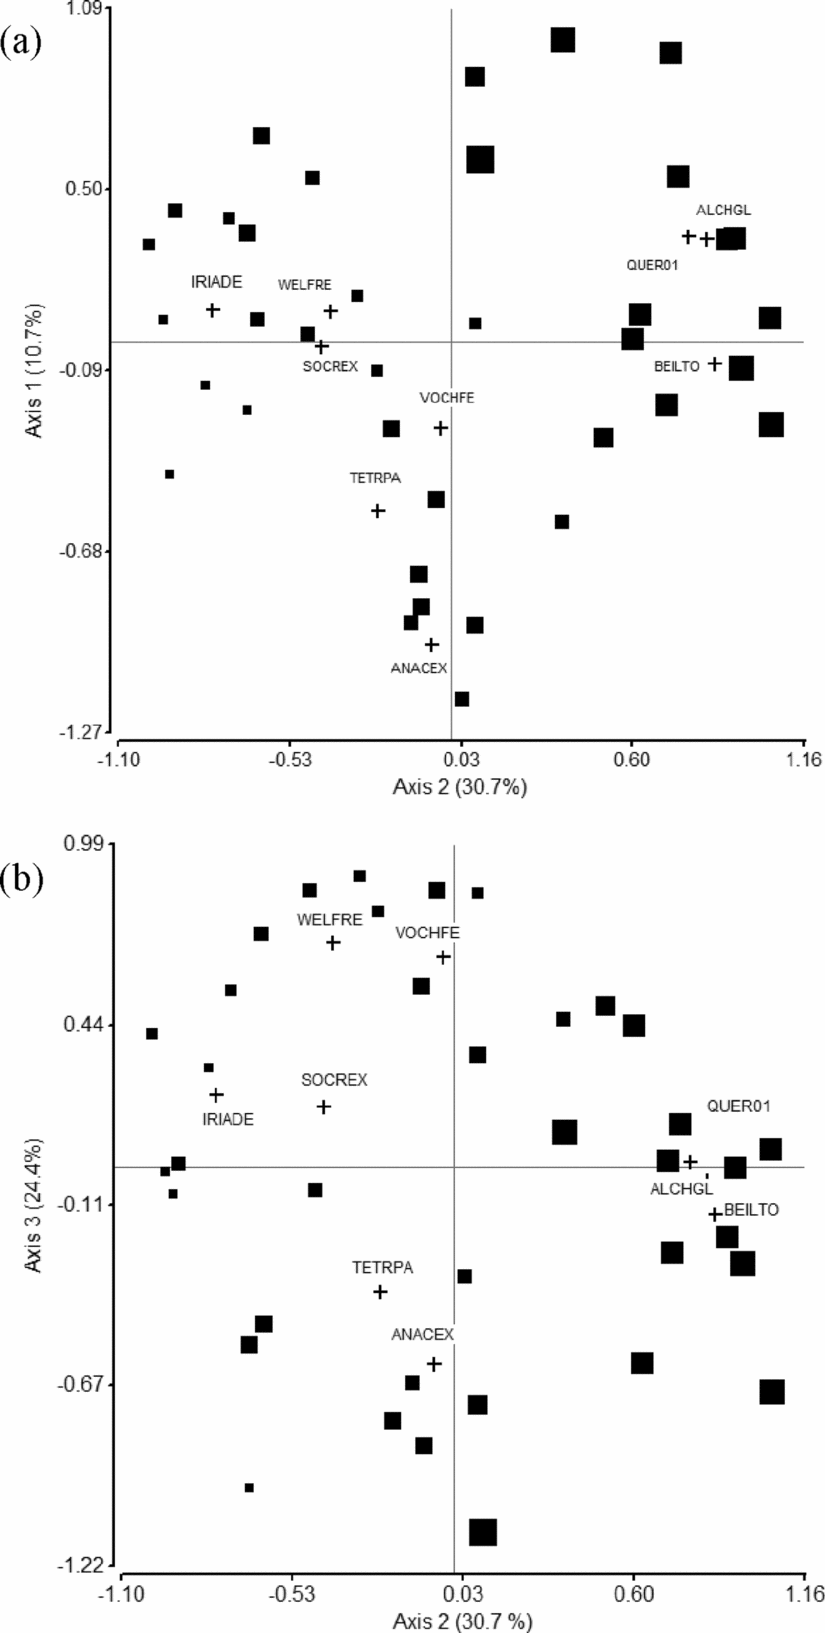
A three-dimensional solution was obtained from the NMS analysis (Figure 3), performed with information of 131 species recorded in two or more plots (106 species recorded in only one plot were not taken into account), with a final stress index of 18.0 that was significantly lower than 95% of the runs from Monte Carlo randomizations (P < 0.05). Axes 1, 2 and 3 respectively explained 10.7%, 30.7% and 24.4% of floristic variation among plots, for a total of 65.9% of explained variation.
Ordination of vegetation plots along NMS axes two and one (a), and two and three (b). Plot's symbol size represents plot altitude, so bigger squares are equal to higher altitudes. Species better correlated to these two main axes of variation are shown (cross symbol): Vochysia ferruginea (VOCHFE), Welfia regia (WELFRE) and Socratea exorrhiza (SOCREX), Tetragastris panamensis (TETRPA), Iriartea deltoidea (IRIADE) and Anacardium excelsum (ANACEX) characteristic of lowland forests; and Beilschmiedia tovarensis (BEILTO), Alchornea glandulosa (ALCHGL) and Quercus sp. (QUERSP) characteristic of higher altitude forests.

Axis 2 represented an altitudinal gradient. It showed strong negative correlations with two palm species, Iriartea deltoidea (r = −0.54) and Socratea exorrhiza (r = −0.39), and dicot tree species such as Brosimum utile (r = −0.65), Brosimum lactescens (r = −0.44), Inga sp. (r = −0.44), and Carapa guianensis (r = −0.41), which dominate lowland forests; and strong positive correlations with Alchornea glandulosa (r = 0.63), Beilschmiedia tovarensis (r = 0.56), Pseudolmedia mollis (r = 0.54), Dacryodes sp. (r = 0.50), Quercus sp. (r = 0.50) and Ocotea sp. 2 (r = 0.48), dicot tree species characteristic of higher-altitude sites. Compositional differences between lowland sites were brought out by Axis 3 and were determined by variation in the abundance of the palms Welfia regia (r = 0.54) and Euterpe precatoria (r = 0.47), and dicot tree species of the genus Vochysia (V. ferruginea, V. allenii, r = 0.68 and r = 0.39, respectively), as well as other species such as Hirtella triandra (r = 0.49), Aspidosperma megalocarpon (r = 0.43) and Calophyllum longifolium (r = 0.39), all positively correlated with Axis 3. Anacardium excelsum (r = −0.54) and Tetragastris panamensis (r = −0.46), negatively correlated with Axis 1, also played an important role in the differentiation of the lowland sites.
Altitude, climate and soil gradients
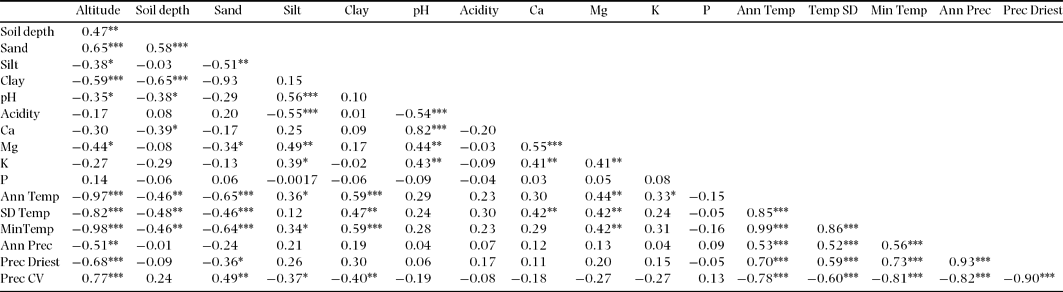
The more than 20-fold variation in altitude was the most evident gradient in the landscape (Table 1; Figure 2). Altitude was correlated negatively with all temperature variables, annual and precipitation of the driest month values, and positively correlated with precipitation coefficient of variation (so that higher-altitude sites, as well as being cooler, tend to have lower and more seasonal rainfall; Table 2). Mean annual and minimum temperature of the coldest month showed considerable variation across the landscape, with temperature being moderately cooler in plots of higher altitudes. Annual precipitation and precipitation of driest month also varied widely (Table 1, Figure 2).
Correlation matrix and coefficients from simple Pearson correlation tests between soil, climate and altitude values from forest plots. Significant correlation are shown as ***P < 0.001, **P < 0.01, *P < 0.05. See text for those variables with abbreviations.

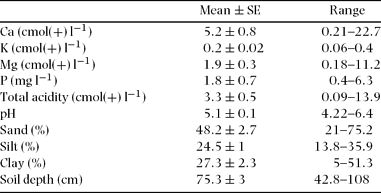
Chemical and physical soil properties also showed a high degree of variation (Table 3). Cations (Ca, Mg, K) were positively correlated among themselves and with pH, in turn negatively correlated with acidity (Table 2). Soils with a high percentage of silt were positively associated with Mg and K presence (Table 2). Extractable phosphorus (P) did not correlate with any soil or climate variables. Soil trends with altitude were increasing depth and sand content, and decreasing pH, silt and clay content and Mg. No significant relationship between other soil cations and altitude was found (Table 2).
Summarized soil chemical and physical properties of all sampled forest plots across the fragmented landscape in south Pacific Costa Rica.

Spatial autocorrelation among variables
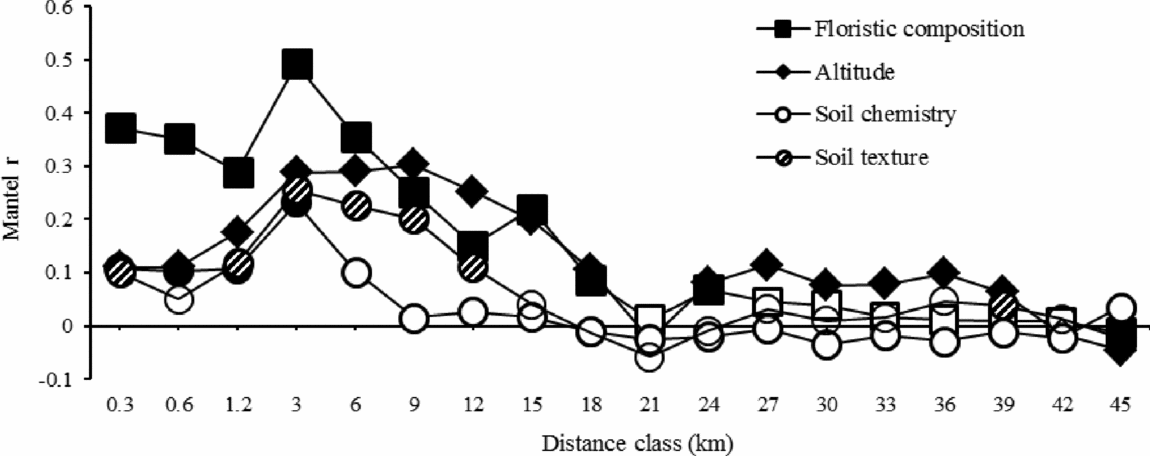
Multivariate Mantel correlograms (Figure 4) indicated that patterns of both environmental and compositional similarity occurred with respect to distance across the landscape. Floristic and environmental (soil and climate) similarity increased rapidly up to the 1.2–3-km class, from which both presented a steep decay. Floristic, climatic and altitudinal correlations among plots continued to decline until loss of significance between 18 and 21 km; after this distance, positive significant autocorrelation was observed, but always with lower correlation coefficients. Soil chemical properties were significantly spatially autocorrelated until the 3–6-km class, and physical properties up to the 12–15-km class, as well as in some larger distance classes, albeit with very low correlation coefficients. Last class contained information based on very few plot comparisons and was taken out from the correlograms.
Mantel correlograms. Spatial autocorrelation coefficients of forest plot pairs for 18 geographical distance classes. Mantel correlations from distance matrices of floristic composition, altitude, climate (all temperature and precipitation variables combined), soil texture (sand, clay and silt per cent combined) and soil chemical properties (pH, Ca, K, Mg, and P combined). Filled or hatched symbols denote progressive Bonferroni corrected significant correlations (P < 0.05), and unfilled symbols non-significant correlations. The x-axis shows the maximum value in each distance class.

Correlation between floristic composition and climate, soil, altitude and space
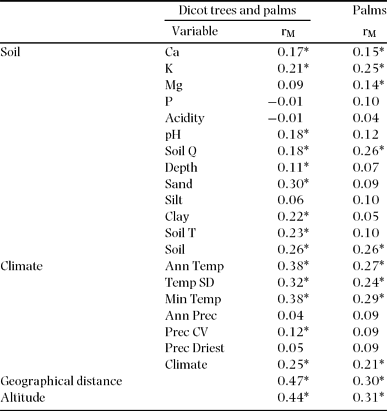
Significant correlations (P < 0.05) were found between species composition and soil texture and chemical properties (Table 4). Soil depth was correlated only with overall species composition (dicot trees and palms). Sand, clay and all texture factors combined were correlated with the overall species composition, but not with palm species composition alone. All chemical soil properties combined and K and Ca separately were correlated with both overall species composition and palm species composition. Mg was only correlated with palm community and pH with overall floristic composition. All temperature variables were correlated with dicot tree and palm communities, but only precipitation coefficient of variation with overall species composition. Combined climatic variables were correlated with both the overall species composition and palm species separately. Finally, both altitude and geographical distance were highly correlated with overall composition and palm composition separately, showing the highest Mantel r values in comparison with soil and climate variables (Table 4).
Simple Mantel correlation (rM) tests between floristic composition and climate, soil, altitude and geographical distance. Tests were performed for the overall canopy community (dicot trees and palms) and palms separately. Significant correlations denoted by an asterisk (*) were determined from 999 permutations and further Bonferroni-corrected (αʹ = 0.05/22). See text for those variables with abbreviations.

We also performed Mantel tests to assess the relationship between the dicot tree community alone and all environmental and space variables. Association patterns were similar to those observed for tree and palm combined, so in subsequent sections we only present analysis for the overall community of canopy species.
Variation partitioning of dicot tree and palm species composition
The forward selection procedure retained five principal coordinates of neighbour matrices (PCNMs) for modelling the overall species composition variation and two PCNMs for modelling palm species separately. The final soil component related to the overall species composition included clay, Ca and K, and Ca and Mg for palms separately. The climate component included minimum temperature of the coldest minth for dicot trees and palms combined, and temperature standard deviation for palms separately.
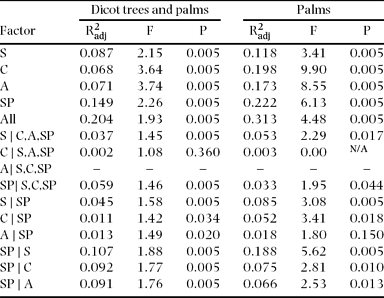
Soil, climate, altitude and space were related to 20.4% of variation of the overall species composition, while 79.6% remained unexplained (Figure 5). PNCMs were more strongly correlated with variation of species composition (R2adj = 0.15%), in comparison with soil, climate and altitude components (R2adj of 0.09, 0.07 and 0.07 respectively, Figure 5). These results indicated that a relatively high proportion of the variation in species composition is spatially structured, which is corroborated by the percentage of species composition variation related to soil, climate and altitude components that could not be separated from space (48.0%, 83.3% and 81.3% respectively, calculated from Table 5), i.e. a high percentage of these components is spatialized (Figure 5). In turn, 28.2% of the total variation related to PCNMs was associated to the soil component and 38.6% to the altitude and 38.2% to climate. Furthermore, when observing the proportion related to the pure effect of each one of the four measured components, i.e. while controlling the three other components, climate and altitude were not significant or null fractions and the space and soil components were best related to variation in species composition (Table 5).
Total explained variation by all and each one of the four measured components (soil, climate, altitude and space) for both the overall plant community and palm community separately. The amount of variance that could not be separated from space is indicated by the diagonally hatched section of each bar.

Variation partitioning results for dicot tree and palm communities sampled in 37 0.25-ha plots in the studied landscape. Adjusted R2 statistics (R2adj) and F statistics are presented for all measured factors, S: soil, C: climate, A: altitude, SP: space. The effect of factors controlling for any combinations of other factors is denoted by symbol |. Negative or null fractions are denoted with a dash.

Thirty-one per cent of variation of palm species composition was related to soil, climate, altitude and space factors. As in the case of overall species composition, the results indicated that variation of palm floristic composition was spatially structured. PCNMs were also better related to palm variation among sites (R2adj = 0.22), followed by the climate component (R2adj = 0.20), altitude (R2adj = 0.17) and soil (0.12.1%; Figure 5). The amount of palm community variance related to the intersection of altitude, climate and PCNMs (R2adj = 0.13), that represents a considerable proportion of the variance related to each one of this factors separately (77.1%, 67.4% and 60.2% in the above given order), suggest that is difficult to separate the effect of these three factors on palm species distribution. In fact 74% and 89.7% of the variation of palm community related to climate and altitude was spatialized, and 66.2% and 70.1% of variation related to space could not be separated from climate and altitude processes respectively. Again the pure effects of climate and altitude were non-significant, and altitude was not significantly related to palm species composition when space was controlled for. Moreover, the pure contribution of soil and space was higher than any of the other components (Table 5) and, in contrast to results obtained for the overall species composition, the effect of soil on palm composition was less spatialized, suggesting the importance of edaphic properties in the determination of variation in palm composition across the landscape.
DISCUSSION
Recognized plant communities
Multivariate analysis of vegetation, carried out with data from dicot canopy trees ≥ 30 cm dbh and palms ≥ 10 cm dbh, allowed us to identify a clear pattern of floristic differences among vegetation plots in the study landscape. Previous studies conducted with both understorey and canopy plant species have not found important differences between these groups in their relationship with the environment (Duque et al. Reference DUQUE, SÁNCHEZ, CAVELIER and DUIVENVOORDEN2002, Reference DUQUE, PHILLIPS, VON HILDEBRAND, POSADA, PRIETO, RUDAS, SUESCÚN and STEVENSON2009; Macía et al. Reference MACÍA, RUOKOLAINEN, TUOMISTO, QUISBERT and CALA2007), allowing us to conclude that recognized floristic patterns for trees ≥ 30 cm dbh and palms ≥ 10 cm dbh are probably representative of the forest as a whole. This assessment of forest compositional variation was a baseline for subsequent assessment of relationships between forest floristic composition and environmental factors.
Altitude, environment and floristic gradients
Species composition turnover displayed an evident spatial pattern associated with environmental variables and geographical distance, as observed in the correlograms. As in other studies in Central America (Condit et al. Reference CONDIT, PITMAN, LEIGH, CHAVE, TERBORGH, FOSTER, NÚÑEZ, AGUILAR, VALENCIA, VILLA, MULLER-LANDAU, LOSOS and HUBBELL2002, Sesnie et al. Reference SESNIE, FINEGAN, GESSLER and RAMOS2009), environmental and floristic similarity in this study showed first a steep decline and then a persistent decline to a point where significance was lost (between 40 km and 50 km very low floristic correlation was found). Sesnie et al. (Reference SESNIE, FINEGAN, GESSLER and RAMOS2009) evaluated these trends on an altitudinal gradient to 1200 m asl although Condit et al. (Reference CONDIT, PITMAN, LEIGH, CHAVE, TERBORGH, FOSTER, NÚÑEZ, AGUILAR, VALENCIA, VILLA, MULLER-LANDAU, LOSOS and HUBBELL2002) make no reference to the altitude of their lowland plots; in both studies, maximum interplot distances were very similar.
The complex topography of Costa Rica results in great climate variability over short distances. Similar trends are seen in soils, whose variables of structure, composition and fertility are determined in part by climatic and topographic factors (Grayum et al. Reference GRAYUM, HAMMEL, ZAMORA, Hammel, Grayum, Herrera and Zamora2004, Grubb Reference GRUBB1977). In our study, floristic and environmental similarity both respond to altitude changes, both interestingly decreasing to the lowest point at the same distance where the coastal range rises up (18–20 km from the coast). Increasing geographical distance is associated with changes in altitude and correlated changes in soils and climate. In this way, geographical distance and especially altitude represent indirect environmental gradients along which floristic composition varies (Gentry Reference GENTRY1988, Givnish Reference GIVNISH1999, Homeier et al. Reference HOMEIER, BRECKLE, GÜNTER, ROLLENBECK and LEUSCHNER2010, Macía et al. Reference MACÍA, RUOKOLAINEN, TUOMISTO, QUISBERT and CALA2007, Sesnie et al. Reference SESNIE, FINEGAN, GESSLER and RAMOS2009). Altitude not only closely covaried with temperature and precipitation variables, but was also correlated with edaphic factors indicating a decrease in soil nutrient and fertility as altitude rises (Homeier et al. Reference HOMEIER, BRECKLE, GÜNTER, ROLLENBECK and LEUSCHNER2010). In the absence of dispersal limitation, this terrain-related environmental heterogeneity is bound to generate differential species responses, in accordance to the niche assembly rule. The key question is, what evidence is there for dispersal limitation?
Determinants of dicot tree and palm floristic patterns
When examining the relationships between plant species composition and soil, climate, altitude and geographical distance, it is clear that all these factors are intercorrelated and that the understanding of their relative importance in determining floristic composition is not an easy task. However, from our distance matrix and variation partitioning analyses we found general trends showing that environmental and floristic patterns evidence a spatial structure across the landscape and that differences exist among factors related to overall and palm species composition individually.
In spite of the very marked environmental heterogeneity in our study landscape, Mantel correlations and variation partitioning analyses show that geographical distance was the single most important factor in the determination of variation in the overall composition of dicot tree and palm species. Complete support for the dispersal limitation hypothesis is not expected in such a variable environment, but in our landscape environmental control was correlated to less variation in species composition than space. Some authors (Chust et al. Reference CHUST, CHAVE, CONDIT, AGUILAR, LAO and PÉREZ2006, Condit et al. Reference CONDIT, PITMAN, LEIGH, CHAVE, TERBORGH, FOSTER, NÚÑEZ, AGUILAR, VALENCIA, VILLA, MULLER-LANDAU, LOSOS and HUBBELL2002, Ruokolainen et al. Reference RUOKOLAINEN, TUOMISTO, MACÍA, HIGGINS and YLI-HALLA2007, Vormisto et al. Reference VORMISTO, SVENNING, HALL and BALSLEV2004) have pointed out that such a predominance of dispersal limitation over environmental filtering (Chust et al. Reference CHUST, CHAVE, CONDIT, AGUILAR, LAO and PÉREZ2006, Condit et al. Reference CONDIT, PITMAN, LEIGH, CHAVE, TERBORGH, FOSTER, NÚÑEZ, AGUILAR, VALENCIA, VILLA, MULLER-LANDAU, LOSOS and HUBBELL2002, Duque et al. Reference DUQUE, PHILLIPS, VON HILDEBRAND, POSADA, PRIETO, RUDAS, SUESCÚN and STEVENSON2009, Normand et al. Reference NORMAND, VORMISTO, SVENNING, GRÁNDEZ and BALSLEV2006) might be attributed to inadequate representation of key environmental variables such as soil physical and chemical properties; however, in the present study, a range of such variables were measured in each plot.
Altitude is an important correlate of variation in plant species composition, due to both environmental and spatial changes associated with it. Macía et al. (Reference MACÍA, RUOKOLAINEN, TUOMISTO, QUISBERT and CALA2007) also found that altitude and geographical distance explained species composition patterns in Bolivian Amazonia, but their results and those of Sesnie et al. (Reference SESNIE, FINEGAN, GESSLER and RAMOS2009) in northern Costa Rica more strongly supported edaphic control on plant species composition. These studies had a shorter altitudinal gradient than ours and Macía et al. (Reference MACÍA, RUOKOLAINEN, TUOMISTO, QUISBERT and CALA2007) did not include climatic variables in their analysis. Even though the construction of the climate model we used is strongly dependent on altitude (Hijmans et al. Reference HIJMANS, CAMERON, PARRA, JONES and JARVIS2005), our results suggest that altitude is not merely a climate surrogate, but also a component of geographical distance in the terrain. In fact, the variation partitioning approach pointed out that there is no variation in species composition that can be correlated to the pure effect of climate and altitude, demonstrating that even when altitude and temperature show strong correlation coefficients with species composition they are not separable from influences of the environmental and spatial position components.
Soil factors showed significant correlation coefficients with plant patterns, contributing to explain dicot tree and palm floristic patterns in the landscape. Ca, K and clay content were correlated with overall species composition, in agreement with other studies that indicate a contribution of environmental control to the determination of floristic patterns (Costa et al. Reference COSTA, GUILLAUMET, LIMA and PEREIRA2009, Duque et al. Reference DUQUE, SÁNCHEZ, CAVELIER and DUIVENVOORDEN2002, Jones et al. Reference JONES, TUOMISTO, CLARK and OLIVAS2006, Macía et al. Reference MACÍA, RUOKOLAINEN, TUOMISTO, QUISBERT and CALA2007, Phillips et al. Reference PHILLIPS, NÚÑEZ-VARGAS, MONTEAGUDO, PEÑA-CRUZ, CHUSPEZANS, GALIANO-SÁNCHEZ, YLI-HALLA and ROSE2003, Pyke et al. Reference PYKE, CONDIT, AGUILAR and LAO2001, Rukolainen et al. 2007, Sesnie et al. Reference SESNIE, FINEGAN, GESSLER and RAMOS2009, Tuomisto et al. Reference TUOMISTO, RUOKOLAINEN and YLI-HALLA2003a, Reference TUOMISTO, RUOKOLAINEN, AGUILAR and SARMIENTO2003b). Values of these chemical properties have been shown to be correlated with tropical plant diversity (Gentry Reference GENTRY1988, Honorio Coronado et al. Reference HONORIO CORONADO, BAKER, PHILLIPS, PITMAN, PENNINGTON, VÁSQUEZ MARTÍNEZ, MONTEAGUDO, MOGOLLÓN, DÁVILA CARDOZO, RÍOS, GARCÍA-VILLACORTA, VALDERRAMA, AHUITE, HUAMANTUPA, NEILL, LAURANCE, NASCIMENTO, SOARES DE ALMEIDA, KILLEEN, ARROYO, NÚÑEZ and FREITAS ALVARADO2009, Macía et al. Reference MACÍA, RUOKOLAINEN, TUOMISTO, QUISBERT and CALA2007) and variation in tree species composition (Phillips et al. Reference PHILLIPS, NÚÑEZ-VARGAS, MONTEAGUDO, PEÑA-CRUZ, CHUSPEZANS, GALIANO-SÁNCHEZ, YLI-HALLA and ROSE2003, Potts et al. Reference POTTS, ASHTON, KAUFMAN and PLOTKIN2002, Ruokolainen et al. Reference RUOKOLAINEN, TUOMISTO, MACÍA, HIGGINS and YLI-HALLA2007, Tuomisto et al. Reference TUOMISTO, POULSEN, RUOKOLAINEN, MORAN, QUINTANA, CELI and CAÑAS2003c).
In the variation partitioning analysis, the soil components related to the overall species composition included clay, Ca and K; however, a high percentage of the soil explanation was spatialized. This was not the case for the palm species variation, in which a smaller faction of the soil component related to palm composition was spatialized. This suggests that palm species have stronger response than dicot canopy trees to chemical soil gradients which may not be spatially structured at the studied scale (see also Clark et al. Reference CLARK, CLARK, SANDOVAL and CASTRO1995, Costa et al. Reference COSTA, GUILLAUMET, LIMA and PEREIRA2009, John et al. Reference JOHN, DALLING, HARMS, YAVITT, STALLARD, MIRABELLO, HUBBELL, VALENCIA, NAVARRETE, VALLEJO and FOSTER2007, Sesnie et al. Reference SESNIE, FINEGAN, GESSLER and RAMOS2009). It was also observed that the abundance of W. regia declined substantially in sandy soils at altitudes up to c. 500 m asl, while I. deltoidea and E. precatoria were distributed in a much wider area in a longer altitudinal (up to c. 1000 m asl) and edaphic gradient, as found by Lieberman et al. (Reference LIEBERMAN, LIEBERMAN, PERALTA and HARTSHORN1996) and Sesnie et al. (Reference SESNIE, FINEGAN, GESSLER and RAMOS2009).
Our results support space as the major individual factor influencing beta diversity of dicot trees and palms even in this environmentally variable altitudinal gradient, but also show that neutral forces are complementary with, not exclusive from, environmental control. Dicot tree and palm species turnover in these Neotropical terra firme forests, 64–1528 m asl appear to be better explained by a coupled effect of both dispersal limitation and environmental filtering as suggested by several studies in lowland environments (Chust et al. Reference CHUST, CHAVE, CONDIT, AGUILAR, LAO and PÉREZ2006, Condit et al. Reference CONDIT, PITMAN, LEIGH, CHAVE, TERBORGH, FOSTER, NÚÑEZ, AGUILAR, VALENCIA, VILLA, MULLER-LANDAU, LOSOS and HUBBELL2002, Duivenvoorden et al. Reference DUIVENVOORDEN, SVENNING and WRIGHT2002, Duque et al. Reference DUQUE, PHILLIPS, VON HILDEBRAND, POSADA, PRIETO, RUDAS, SUESCÚN and STEVENSON2009, Normand et al. Reference NORMAND, VORMISTO, SVENNING, GRÁNDEZ and BALSLEV2006, Valencia et al. Reference VALENCIA, FOSTER, VILLA, CONDIT, SVENNING, HERNÁNDEZ, ROMOLEROUX, LOSOS, MAGÅRD and BALSLEV2004, Vormisto et al. Reference VORMISTO, SVENNING, HALL and BALSLEV2004).
A relatively high proportion of community variation in the landscape could not be related to neither climate, soil, altitude and spatial data, which can be attributed to other random dispersal and mortality mechanisms, or variation caused by unmeasured environmental or biological (e.g. species traits) variables (Legendre et al. Reference LEGENDRE, MI, REN, MA, YU, SUN and HE2009). Land-use configuration, another variable not taken into account in the analysis, could also have an effect on the plant species composition (Marini et al. Reference MARINI, BONA, KUNIN and GASTON2011). Our sampling protocol is designed to minimize edge effects on forest characteristics (Sesnie et al. Reference SESNIE, FINEGAN, GESSLER and RAMOS2009), but the possible influence of the fragmentation of the landscape remains unknown. Other processes underlying the influence of geographical location on the species composition of these forests may be those acting at larger scales. Boundaries of climatically defined forest types may have shifted by up to 700 m during the last glaciation (Islebe et al. Reference ISLEBE, HOOGHIEMSTRA and VAN DER BORG1995), so that the current distributions of species are partly the result of their capacity to disperse in relation to natural climate change. They may also be related to species radiations from different centres of origin especially in this region of the Central American isthmus where species from the Amazonian region and the North American region coincide (Gentry Reference GENTRY1992). Finally, we need to consider factors related to study design and statistical power. A higher number of plots and replicates at particular points on the altitudinal gradient may have allowed the explanation of a higher amount of variance in species composition turnover.
Implications for conservation on tropical altitudinal gradients
This is one of the first studies to determine the relative roles of niche and dispersal in determining forest compositional turnover on tropical mountains, which has traditionally been interpreted as a result of niche assembly. We thus contribute to a more comprehensive understanding of spatial patterns of tree species diversity (Lomolino Reference LOMOLINO2001, Malhi et al. Reference MALHI, SILMAN, SALINAS, BUSH, MEIR and SAATCHI2011). This is particularly important to conservation and sustainable use of biodiversity in regions like Central America where the wide range of altitudes and high topographic complexity gives rise to high landscape diversity (Enquist Reference ENQUIST2002), and where vulnerability to rising temperatures and changing rainfall patterns is high (Imbach et al. Reference IMBACH, MOLINA, LOCATELLI, ROUPSARD, MAHÉ, NEILSON, CORRALES, SCHOLZE and CIAIS2012).
The finding that geographical position may greatly influence forest composition on a tropical altitudinal gradient is important for several reasons. First, if species distributions determined in a landscape relatively free of human disturbance – as detected by our sampling protocol (Sesnie et al. Reference SESNIE, FINEGAN, GESSLER and RAMOS2009) – partly reflect dispersal limitation, then species adaptation to climate change taking place over a few decades (Imbach et al. Reference IMBACH, MOLINA, LOCATELLI, ROUPSARD, MAHÉ, NEILSON, CORRALES, SCHOLZE and CIAIS2012) could be more strongly limited by their dispersal capacities (Pearson & Dawson Reference PEARSON and DAWSON2005) than by their capacity to adapt to new environmental conditions. This point emphasizes once more the need to take into account the connectivity and size of forest patches when protecting plant species from extinction (Duque et al. Reference DUQUE, PHILLIPS, VON HILDEBRAND, POSADA, PRIETO, RUDAS, SUESCÚN and STEVENSON2009, Pearson & Dawson Reference PEARSON and DAWSON2005). On the other hand, if environmental tolerances of species are wider than their current distributions indicate, then their capacity to tolerate change in situ might be greater than thought. Second, the contingent nature of communities emphasized in neutral theory (Hubbell Reference HUBBELL2001) suggests that ecosystem-based conservation planning continues to be valid as an approach to ‘keeping common species common’ (Caicco et al. Reference CAICCO, SCOTT, BUTTERFIELD and CSUTI1995) but that treating ecosystems as equivalent to species as conservation objects as proposed by Rodríguez et al. (Reference RODRÍGUEZ, RODRÍGUEZ-CLARK, BAILLIE, ASH, BENSON, BOUCHER, BROWN, BURGESS, COLLEN, JENNINGS, KEITH, NICHOLSON, REVENGA, REYERS, ROUGET, SMITH, SPALDING, TABER, WALPOLE, ZAGER and ZAMIN2011) is illusory. Finally, if species distributions partially reflect dispersal limitation, then the limitations of bioclimatic envelope models in the prediction of climate change impacts (Pearson & Dawson Reference PEARSON and DAWSON2003) are further emphasized.
ACKNOWLEDGEMENTS
This research was supported by The Nature Conservancy to perform field work, and Consejo Nacional de Ciencia y Tecnología (CONACyT), México, which supported the first author with a complete scholarship during her master studies. We especially thank Vicente Herra, Leonel Coto, Octavio Palacio, Bernardo Hernández, Álvaro Ávila, Agustín Zúñiga and Astrid Pulido for their assistance during fieldwork; Hugo Brenes for assistance with database management; Diego Delgado for his assistance with field work logistics; Nelson Zamora who identified leaf specimens that allowed us to carry out the analysis; and Lee Vierling for his insightful comments on the manuscript.
Species list. The family and scientific name of all tree and palm species recorded in 37 vegetation plots (0.25 ha) are given, followed by their altitudinal range and number of plots in which they were present. A single altitude value is given for those species recorded in one plot only. Species nomenclature conforms to that of the flora of Costa Rica as listed by the National Institute of Biodiversity (INBio) (http://atta.inbio.ac.cr/).