

For a so-called natural disaster, Hurricane Katrina proved to be unusually rich in purely social lessons, especially ones that could be represented by journalists and broadcasters as simple, pleasing homilies. To date, the “costs of cronyism” story has proven to have real staying power and has arguably emerged as the dominant post-Katrina homily, but it bears recalling that there was also much journalistic intoning in the immediate post-Katrina period about how the disaster forced the public to rediscover poverty, how it unmasked the human cost of poverty, and how it unleashed a newfound commitment among the public to take on issues of poverty and inequality. The purpose of our essay is to ask whether any of this intoning was indeed on the mark. Did Katrina increase the awareness of poverty or inequality in any important way? Did it bring about a new appreciation of the seriousness of the problem? Did it generate a renewed commitment to addressing the problems of poverty and inequality?
We have become so accustomed to journalists and broadcasters telling us how we are feeling, responding, or thinking that sometimes we must remind ourselves that in the end they may only be telling us (a) how they are feeling, responding, or thinking; (b) how their colleagues and acquaintances are feeling, responding, or thinking; or (c) how they have understood and reacted to the coverage of other journalists and broadcasters. These sources of evidence, all potentially flawed, are the main foundation of deadline-driven journalistic efforts to represent the public's views as well as possible changes in those views in the aftermath of Katrina.2
We are referring here to everyday journalism and broadcasting in which the deadline is imminent. When journalists and broadcasters have the luxury of time, they can and often do carry out more formal research that draws on all manner of rigorous evidence, including polls and surveys, research reports, and more extended interviews with experts.
Throughout this essay, we interpret any observed changes in poverty attitudes between 2004 and 2005 as evidence of a “Katrina effect,” although obviously other forces were also at work during this time period and may account for some of the observed change. The presumption that Katrina is a main cause behind observed changes is plausible because (a) there is much evidence, some of it cited here, establishing that Katrina was one of the most closely watched events in broadcasting history; and (b) there is also much evidence that trends in poverty attitudes prior to Katrina changed at only a glacial pace (e.g., Pew 2005b). If we find substantial changes in attitudes after Katrina, it is at least reasonable to suppose that Katrina was the main cause.
In the abstract, the foregoing argument might well seem obvious and banal, as of course journalists were forced, given the constraints of time and space, to simplify the effects of Katrina. We are not averse to understanding our present effort as little more than the usual scholarly mopping up that occurs after deadline-stressed journalists and broadcasters do the best they can (see, e.g., Pew Research Center 2005a, 2005b). It might nonetheless be noted that much mopping-up appears to be in order.
We are greatly assisted in this effort by the partly fortuitous timing of the 2004 and 2005 Maxwell Polls on Civic Engagement and Inequality (Roberts 2004, 2005). These two surveys, which include an extraordinary battery of items on poverty and inequality, were administered in October 2004 and again in October 2005 (using mainly identical items), thus allowing us to assess how each of the ideologies within our typology has evolved over that period, presumably in response to the shock of Katrina. This approach makes it possible to identify the ideologies that won and those that lost as the effects of Katrina played out.
THE COVERAGE OF KATRINA
There is at least one point on which we agree with journalists and broadcasters. Because the television and print coverage of Katrina was so widely consumed, it is likely that it had a nontrivial effect on how poverty and inequality are understood in the United States, just as journalists and broadcasters have suggested. According to a Pew Research Center poll (2005a), 70% of the U.S. adult population claims to have paid “very close attention” to news about Katrina, making it the fifth most closely followed story in the last twenty years, lagging only behind such dramatic events as the Challenger disaster (to which 80% paid “very close attention”) and the 9/11 terrorist attacks (to which 74% paid “very close attention”).4
The Pew surveys provided respondents with a list of the most prominent news stories of the preceding month and asked them how closely they watched them. In 1986, Pew respondents were asked to rank news stories covered over the entire preceding year, not just the prior month. This discrepant format in 1986 may explain, at least in part, why the Challenger disaster (which occurred in 1986) appears to have been more closely watched than all other stories.
What about the content of this coverage? Obviously, many themes were broached, but a common one was that Katrina cast fresh light on the depth and extent of poverty in the United States. The following sampling of post-Katrina headlines reveals this theme: “The Disaster Behind Disaster: Poverty” (New York Times 2005a); “Katrina Returns the Poor of Inner City to Forefront” (Boston Globe 2005); “Catastrophe Shows Us Two Americas” (San Francisco Chronicle 2005); “Disaster Brings Race, Class to Forefront” (Baltimore Sun 2005a); “Hurricane Exposes Issues of Class, Race” (USA Today 2005); and “Katrina Crisis Renews Focus on U.S. Poverty” (Sacramento Bee 2005). These and other articles develop the argument that poverty in the United States had been “long ignored” (Baltimore Sun 2005b), kept “out of sight” (Milwaukee Journal Sentinel 2005), and was accordingly a “dirty little secret” that only Katrina exposed (San Diego Union-Tribune 2005). This theme is summarized in a Newsday (2005) quote of a poverty expert:
There has been a pulling back of the veil that hides poverty in America…. All of a sudden, people are saying, “Do we really have that level of poverty here? Are there people really trying to hold families together with substandard education, living in substandard housing and with no financial resources to fall back on?”
The “dirty little secret” (DLS) hypothesis was sometimes represented as a more subtle claim about how Katrina served to make poverty tangible and visible. Under this formulation, the argument was not that we were oblivious to poverty prior to Katrina, but just that our knowledge was excessively abstract and hence unlikely to motivate much support for antipoverty initiatives. The Los Angeles Times (2005), for example, suggested that Katrina might “prove a watershed in the debate over poverty, largely because it provided a window into the life of the poor that was more visceral and intimate than most Americans ever witness.” It was this visceral image, moreover, that many commentators thought might reenergize the war on poverty, compelling us to “realize that there are people living in these conditions right under our noses and … we collectively have to band together to do something about it” (Denver Post 2005). How might this new war on poverty be waged? Here, the commentary often becomes vague, with some journalists suggesting that antipoverty efforts might take the form of new government programs and others referring to “renewed interest among younger Americans in [charitable] organizations that are working to meet the needs of the poor” (New York Times 2005b).
It bears reiterating that all of this coverage involves journalists or experts attempting to imagine how Katrina may have affected our understanding of poverty (cf. Pew Research Center 2005b). In extreme cases, the imagined sentiment was concretized by inventing hypothetical observers to express it: “In the aftermath of Hurricane Katrina, people watching images of poverty along the Gulf Coast may have wondered, ‘How many poor places like this are there in the country?’” (New York Times 2005a). The latter formulation at least owns up that a hypothesis is involved, whereas other journalists baldly repackaged raw speculation as fact. The Baltimore Sun (2005a) thus writes that “the nation was horrified at what they saw and how [the poor] were treated.” Even more insidiously, a hypothesis was sometimes converted into fact by claiming, incontrovertibly, that it applied to “many” Americans: “The stark pictures of families trapped amid the rising waters have made the persistence of poverty tangible to many Americans” (Los Angeles Times 2005, emphasis added). Clearly, this is nothing more than an ambitious hypothesis taking cover under a nominal truth, as it is always possible in a country of 300 million to find “many Americans” who would agree with most anything, including the claim that Katrina “made the persistence of poverty tangible.” In yet other cases, the journalist's own reactions were simply elided with those attributed to others, leading to such circumlocutions as: “Can it be that nothing has changed since President Lyndon Baines Johnson famously declared ‘unconditional war on poverty in America’ four decades ago? That depressing thought comes from the brutal and tragic images we all saw in the wake of Hurricane Katrina” (Business Week Online 2005).
This is not of course to suggest that deadline-stressed journalists should somehow be obliged to carry out systematic research. Rather, our point is simply that the coverage of Katrina was rife with speculative claims, many of them masquerading as fact. This practice would perhaps be excusable were the speculative claims mere platitudes that were truly obvious. Although the DLS hypothesis is so well rehearsed as to take on the appearance of a platitude, we think it worthwhile to ask whether it is not just frequently repeated but true as well. We will therefore attempt to provide fresh empirical evidence on each of the three classes of questions implied by the DLS hypothesis:
- Was there much awareness of poverty and inequality in the pre-Katrina period? Did awareness increase in the aftermath of Katrina?
- Was the public more likely to regard poverty and inequality as social problems after Katrina? Were some sectors of the population immune to the “lessons” of Katrina?
- Was there increased support in the aftermath of Katrina for government programs intended to reduce poverty or inequality? Or were new top-down solutions treated with skepticism?
So far as we know, the first two questions have gone entirely unaddressed, whereas the third has been partly addressed through a brief discussion of recent Pew Research Center polls (2005a, 2005b).
It is not altogether surprising that the DLS hypothesis has gone largely unexamined. The core of the DLS hypothesis is the claim that Katrina ratcheted up public awareness of poverty and inequality (i.e., question (1) above), yet scholars of inequality and public opinion have never been much interested in documenting mere awareness. Until quite recently, most scholars simply assumed that social inequality is a manifestly “salient feature of the social world” (Kluegel and Smith, 1986, p. 21), although some also argued that the recent takeoff in inequality has not been sufficiently publicized to “capture the public's imagination” (Bowman 2000, p. 31). In the last five years, a new body of research on public knowledge about poverty and inequality has emerged, but many fundamental questions remain (e.g., McCall 2003; McCall and Brash, 2004; Draut 2002). The impetus for this new literature was the surprising combination of the spectacular takeoff in income inequality over the last thirty years and a seemingly muted public response to that takeoff. Might this apparent disinterest be attributable to a lack of knowledge about the takeoff? In taking on this question, McCall (2003) adroitly mines the available data, examining a time series of polls asking whether the “rich get richer and the poor get poorer” as well as more indirect measures of knowledge. Although her results are complicated and not easily summarized, she ends by concluding that media reports of rising inequality, spiraling CEO salaries, and conspicuous displays of wealth generated “widespread awareness that inequality had increased to intolerable levels” (p. 24).
A TYPOLOGY OF ATTITUDES
In our analysis, we will likewise explore whether knowledge about poverty and inequality has increased, but for us the possible trigger event is Katrina rather than media coverage of rising inequality in the 1990s. The main point that we would like to press is that all such trigger events are likely to be processed in quite different ways depending on a person's antecedent ideology. That is, rather than viewing trigger events as simple inputs that are straightforwardly and identically incorporated by all, we suggest instead that they are processed in potentially diverse ways that reflect the equally diverse ideologies or frames through which new information is viewed. In the language of communication theory, we are thus focusing not so much on how journalists or broadcasters organized, framed, or packaged their coverage of Katrina, but rather on how individuals interpreted that coverage in terms of their own presuppositions about the structure of inequality (e.g., Scheufele 1999; Gamson 1992; Iyengar 1991; Gitlin 1980). We will thus proceed by introducing a typology of attitude classes and then considering how the incumbents of these classes might incorporate new information of the sort that Katrina entailed.
The typology upon which we will base our analyses is presented in Table 1. As shown here, individuals may be cross classified into one of eight attitude classes, each defined by different scores on variables measuring awareness, legitimation, and activation. These three variables may be understood as representing the stages through which people progress to become activists on matters of poverty and inequality. We are assuming that true activists will (a) appreciate that there is much poverty and inequality (awareness), (b) regard such poverty and inequality as a social problem (delegitimation), and (c) view the state as appropriately involved in poverty or inequality reduction (activation). This account bears of course some resemblance to old neo-Marxian models of the stages through which workers must progress to become class-conscious or to engage in class action (e.g., Mann 1973; Lukács 1923 [1967]). We have updated such approaches here by shedding the old concern with whether poverty and inequality are best understood in strictly class terms, asking instead whether poverty and inequality are appreciated in any terms at all, class based or otherwise.
Typology of Attitude Classes

It is notable that only some of the classes within our typology directly map onto simple left-right ideological formulas. When a constellation of responses is inconsistent with a left-right ideological formula, it may be entirely disorganized and incoherent (e.g., Almond 1950; Lippman 1922 [1991]), or it may follow some other political or cultural ideology that is less prominent than the left-right formula (e.g., Wagner 1990). The classes of Table 1 encompass both types of organization as well as rank disorganization. Finally, we should note that some of our coherent classes embody much ignorance about the facts of poverty and inequality, an ignorance that might be understood as rational insofar as the benefits of acquiring such information are likely minor (e.g., Schiff 1994). We do not conflate such ignorance with disorganization. Indeed, just as journalists have long recognized that facts can “get in the way of a good story,” so, too, can one readily build a coherent ideology about poverty on a foundation of ignorance.
The resulting typology, which we hope to be quite uncontroversial, is reviewed below. We first discuss the structure of the classes themselves, and we then ask whether those classes were likely to become bigger or smaller as Katrina played out.
Activist
We begin with the activist class (see Panel A, Table 1). As already noted, activists pass through all three of the above-described stages (i.e., awareness, delegitimation, activation), and they are accordingly strong supporters of state intervention to reduce poverty or inequality. We don't wish to suggest that activists necessarily move in lockstep fashion through each of these stages, first recognizing that there is much poverty and inequality, then coming to view poverty and inequality as important social problems, and finally recognizing that the state should be involved in amelioration. Rather, one might understand an activist ideology in more organic terms, with adherents often and perhaps typically adopting the package in toto as part of a larger social democratic world view (Feagin 1975; Kluegel and Smith, 1986; Bullock et al., 2003). The activist class, unlike some of our others, may therefore be understood as straightforwardly mapping onto a single political ideology, a social democratic one.
Realist
The realist breaks with the activist on the matter of whether the state has a responsibility to reduce poverty or inequality. Although the skepticism of the realist may be traced to many sources, it typically proceeds from the premise that state-organized redistribution is coercive, inefficient, and hence less desirable than voluntary forms of charity funded through personal generosity. For a realist, poverty relief in the form of a coercive act enforced from on high is poor policy, not just because of its liberty-depriving implications, but also because centralized state directives are invariably inefficient and rife with unintended consequences (Esping-Andersen 2001, p. 840). This position resonates quite well, then, with that of classical liberalism, although some classical liberals might also have moralist tendencies (see below).
Moralist
The moralist breaks with the realist on the matter of whether poverty and inequality are important social problems. To be sure, a moralist may share the realist's distrust of state intervention, but this distrust is largely beside the point, because poverty and inequality aren't, for the moralist, problems that require amelioration. Because the poor are regarded as undeserving (e.g., lazy), or because inequality and poverty are regarded as incentives that ratchet up effort, motivation, and total output (i.e., the functionalist account), the moralist does not characterize poverty and inequality as important social problems (Bartels 2005; Alesina et al., 2001; Alesina et al., 2002; Samuelson 2001; Kelley and Evans, 2001; Ladd and Bowman, 1998; Kluegel and Smith, 1986; Hochschild 1981). The classical liberal, obsessed as always with bringing incentives into alignment with collective ends, might therefore be attracted to this position as much as to that of realism.5
Although we could have labeled this category as functionalist, we opted instead for moralist because our side analyses revealed that the majority of respondents falling into this category do not take functionalist positions on the relevant attitude items in the Maxwell Poll. We have therefore presumed that a moralist rationale is preferred by these respondents.
Denier
The denier, by contrast, alleges that present-day poverty and inequality are neither substantial nor growing, that they are not important social problems, and that the state hasn't a legitimate role to play in amelioration. When taken literally, these responses together form a coherent package, all flowing quite straightforwardly from the premise that poverty and inequality are much overrated, the trumped-up cause of social democratic do-gooders. Indeed, even the relatively moderate conservative David Brooks has talked himself on occasion into denier sentiments, having recently noted that Democrats often exaggerate the amount of poverty and are too prone to “gloomy articles about downsizing, outsourcing, and wage stagnation” (Brooks 2006, p. 23). For many deniers, the very act of downplaying poverty and inequality is likely to be as much political as empirical, a metaphorical slap in the face to those Democratic pollsters who seek to seduce them into soft do-gooder sentiments. By this logic, the decision to recognize poverty is tantamount to labeling it as a problem, and deniers will accordingly resist that decision.
Disengaged Ideologies
We turn next to the two disengaged ideologies (see Panel B, Table 1). As indicated in Line B5, uninformed activists view poverty and inequality as problems that the state should take on, but this simple social democratic position is then combined with the view that poverty is not prevalent and inequality is not increasing. This isn't necessarily an inconsistent constellation of views. Rather, uninformed activists are just not avid consumers of the types of books, magazine articles, or radio and television programs that might expose them to information on inequality trends, a form of disengagement that surely doesn't preclude them from adopting most any political ideology, including a social democratic one. Likewise, the uninformed realist is a good realist in all respects, save for an apparent lack of knowledge about how much poverty and inequality there is (see Line B6). The categories of Panel B may therefore be understood as natural homes for rationally ignorant individuals who find it too costly, given the seemingly minor benefits, to seek out information on poverty or inequality (see, e.g., Schiff 1994; Downs 1957).
Incoherent Response Sets
The final two attitude classes are more plausibly tagged as incoherent (Panel C). Most notably, one would be hard pressed to specify a coherent ideology that concludes that, even though poverty is not a problem, the state should nonetheless commit itself to antipoverty initiatives (see Line C7). Although we could perhaps dream up some ideology that embodies this combination of positions, it strikes us as more likely that such a combination reflects, as Converse noted long ago (1964), the simple absence of any coherent, organizing ideology about poverty or inequality. The respondent who is operating without such an ideology is, in effect, undertaking a random walk through the survey items, responding to seemingly extraneous cues and generating combinations of responses that simply don't add up.6
In our statistical model, we will measure each of the three underlying variables with two items, thus allowing us to purge some of the measurement error that might otherwise inflate the size of incoherent classes.
Although our typology is formally exhaustive (representing all possible responses to the three underlying variables), we are not of course prepared to argue that it represents adequately all the nuances of opinion about poverty and inequality. However inadequate it may be, the typology does at least provide some leverage over the diversity of public opinion on poverty and inequality, hopefully enough leverage to capture some of the effects of Katrina on public opinion.
THE EFFECT OF KATRINA
We consider next how members of each of these attitude classes may have reacted to Katrina. As noted above, Katrina was one of the most closely watched media events of the last twenty years, raising the possibility that it brought about real attitudinal changes of the sort represented by the DLS hypothesis. The virtue of our typology is that it suggests that preexisting attitudes and ideologies may have affected how Katrina was incorporated and the extent to which it raised awareness, delegitimated poverty and inequality, and increased support for state action. The DLS effect is likely, in other words, to play out in some classes but not in others.
For example, we suspect that members of the denier class remained largely unaffected by Katrina, even though their denial of poverty might suggest a vulnerability to broadcasting and journalism that “exposed an abiding truth about poverty in America” (News Tribune 2005). The denier class is protected, we suspect, because its repudiation of poverty is part of an encompassing conservative ideology rather than some genuine empirical claim that could be disconfirmed by the new information that Katrina purportedly provided. For deniers, poverty is best regarded as a lifestyle choice predicated on a strong taste for leisure, thus making the very concept of poverty a misleading one. Far from being poor, the “poverty-stricken” are regarded as rich in the very leisure they have chosen, and their total utility, so it might be argued, is not necessarily any lower than the total utility of those who earn much more. This conservative ideology is likely to be an article of faith within the denier class and not much affected, as a result, by the coverage of Katrina. Within the confines of this class, a simple DLS story thus strikes us as off the mark, even though deniers would be coded on any typical poverty awareness item as “ignorant” and hence receptive to the lessons of Katrina.
The two disengaged classes are, by contrast, the home ground of DLS processes because their members can accommodate new knowledge about the extent of poverty without effecting any major changes in their politics. In the aftermath of Katrina, uninformed activists may have become more likely to acknowledge the persistence of poverty, but they probably found nothing in the Katrina coverage that would induce them to change their ideology in any more profound way. The upshot is that, given that uninformed activists viewed pre-Katrina poverty as a problem that governments should address, they are likely to continue to view post-Katrina poverty as a problem that governments should address. Similarly, we suspect that uninformed realists became more informed about poverty after Katrina, but otherwise they should have found ample room in the Katrina coverage to maintain their realist view that government initiatives are ineffectual. We are presuming, then, that the coverage of Katrina was either variable enough in its content (e.g., CNN, FOX) or ambiguous enough in its implications to allow different classes to take from it different lessons. Whereas activists likely drew the lesson that the state must ratchet up its engagement, realists probably drew the lesson that top-down intervention is all about ineptitude, inefficiency, and unintended consequences. By this logic, the realist and activist classes are both likely to be big winners, each growing at the expense of the disengaged classes.
Which of these two classes is likely to grow more quickly? Although both the realist and activist classes should draw from the formerly disengaged, it is of course possible that one of these classes recruited especially successfully. It is also possible that the realist and activist classes directly recruited from one another with differential success. The fate of the realist and activist classes in the post-Katrina period will depend on whether the “ineffectual government” lesson proves more compelling than the “call for action” lesson. If the former lesson emerges as dominant, then the realist class will benefit from a net mobility flow out of the activist and uninformed activist classes and perhaps emerge as the biggest winner in the post-Katrina period (Pew Research Center 2005a). This strikes us as a likely outcome because the “ineffectual government” message always plays well in a classically liberal regime and because even Democrats have favored a particular version of that message (via the “costs of cronyism” line).7
Obviously, the intention behind this message is to suggest that the Republican Party is all about cronyism whereas the Democratic Party is not, implying that renewed state intervention with Democrats at the helm would be unproblematic. We are merely noting here the risk that such a message will be reinterpreted by the public as implying that, no matter which party is in power, any state-run program will inevitably be rife with cronyism and ineptitude.
Finally, one might consider the post-Katrina fate of the two incoherent classes, both of which are best understood, we have argued, as comprising individuals who are operating without a well-developed poverty ideology and therefore engage in a random walk through the items. If Katrina indeed raised the visibility of poverty and reopened a discussion about it, at least some of the random walkers may have responded by beginning to develop a real poverty ideology, however inchoate. What type of ideology are such individuals likely to choose? As we have argued throughout, the lessons of Katrina map most directly onto activist and realist ideologies, so presumably either one might appeal to those who are moving toward more organized positions.
USING THE MAXWELL POLL
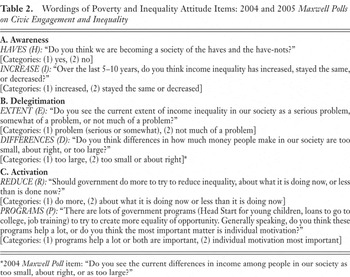
We have proceeded by analyzing the 2004 and 2005 Maxwell Polls on Civic Engagement and Inequality (Roberts 2004, 2005). Although the convenient timing of the Maxwell Polls makes them an extraordinary resource, we obviously do not wish to suggest that the relevant items, as listed in Table 2, were tailor-made for our particular research interests. The main complication is that some of the items make reference to inequality rather than poverty, while others appear to make reference to both concepts simultaneously. This is problematic because (a) some respondents may hold poverty ideologies that differ somewhat from their inequality ideologies, and (b) Katrina presumably affected the former more than the latter. The item labeled HAVES (see Panel A, Table 2) is perhaps our most direct assessment of poverty awareness, yet even here one might quibble as to whether the term have-nots will be regarded by respondents as a colloquialism for poverty-stricken. That is, when respondents claim that we are becoming a “society of the haves and the have-nots,” it is possible that they are just asserting that the income distribution is becoming polarized and that a growing proportion of the population is accordingly found at the two extremes of that distribution. This expansion at the bottom of the income distribution might then be understood as occurring at some point above the poverty line and not entailing any growth in the poverty-stricken population per se.8
It is also potentially troubling that one of our activation items, PROGRAMS, refers to government programs oriented toward equality of opportunity rather than poverty amelioration per se (see Panel C, Table 2).
Wordings of Poverty and Inequality Attitude Items: 2004 and 2005 Maxwell Polls on Civic Engagement and Inequality

The second main class of problems is that objective trends in poverty and inequality do not allow for an entirely unambiguous response to the two awareness items. With respect to income inequality, there is of course rather little ambiguity, although the committed scholar of income inequality might know that recent increases have not been as stark as those of the 1980s (Card and DiNardo, 2002). The more important ambiguity arises with respect to trends in poverty. In this case, the latter half of the 1990s was a period of steady decrease in poverty rates, whereas the period from 2000 to the present day was one of steady increase in poverty rates (U.S. Bureau of the Census 2005). Presumably, respondents who are extremely well schooled in poverty research would opt to respond to HAVES in terms of recent trends in poverty, while less-informed respondents may not be aware of recent trends and could conceivably respond in terms of the results of the 1990s. The latter respondents would be coded in our analysis as low in awareness, but it is quite possible that they are more knowledgeable than the vast majority of respondents who haven't any formal knowledge of trends and are attempting to respond solely on the basis of rough-and-ready understandings of poverty. This caveat rests, of course, on the assumption that HAVES is interpreted as referencing trends in poverty rather than income inequality. If respondents instead take it as referencing trends in inequality, then the ambiguity in the poverty time series becomes altogether irrelevant.
This is merely to suggest that our analyses will be fraught with the usual ambiguities in interpretation that characterize virtually all research on attitudes. Because any particular indicator will likely capture the core concept of interest as well as residual and unwanted meanings, our approach will be (a) to insist on multiple measurements of each underlying concept (i.e., awareness, delegitimation, activation); and (b) to assume that the common association among these measurements pertains to the concept of interest. The latter assumption is admittedly heroic, but it is surely less so than the more common assumption that any single indicator is precisely identical to the concept it putatively represents.
EVIDENCE ON THE DIRTY LITTLE SECRET HYPOTHESIS
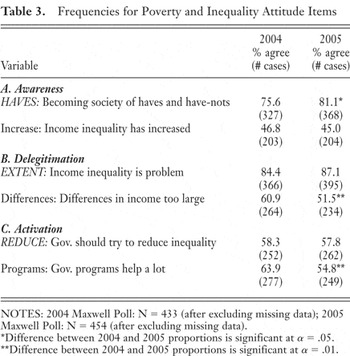
We begin by presenting frequencies on the six items for each of the two years (see Table 3). Here and throughout, we have restricted the analysis to respondents having nonmissing data on all six of the attitude items, yielding a sample of 433 cases in 2004 and 454 cases in 2005.9
We have also eliminated the small number of respondents who had “no opinion” on the items. Before these selections, the 2004 Maxwell Poll had 603 cases, and the 2005 Maxwell Poll had 609 cases. The reader should bear in mind that samples of this relatively small size will have low statistical power. The results reported throughout the paper are weighted to correct for underrepresentation of men, younger adults, African Americans, and Hispanics.
This item yields rather more positive responses than similarly worded items that ask whether American society is “divided into haves and have-nots” (Pew Research Center 2005b). Although we can only speculate as to the source of the discrepancy, we suspect that it arises because our item, unlike the more conventional variant, pertains explicitly to trend. This interpretation is consistent with the high proportion of respondents who agree when asked whether “the rich get richer and the poor get poorer” (McCall 2003, Table 1). The latter item, like HAVES, makes explicit reference to trends in inequality and poverty, a reference that again appears to induce much agreement.
Frequencies for Poverty and Inequality Attitude Items

The next two items, EXTENT and DIFFERENCES, speak to whether inequality is regarded as a social problem. In this case, the DLS hypothesis appears not to be supported, as the change in EXTENT is not significant and the change in DIFFERENCES is both significant and downward. We are struck by the substantial decline in DIFFERENCES: The percentage of the population that is troubled by “differences in how much money people make” decreased from 60.9% in 2004 to 51.5% in 2005. Why doesn't EXTENT similarly decline? Here again, the wording of EXTENT may subtly cue respondents to think about poverty as much as income inequality, and the legitimacy of poverty may be changing according to a slightly different dynamic than the legitimacy of income inequality.11
Although EXTENT does explicitly refer to inequality, we nonetheless think it cues respondents to think about poverty because it makes reference to the “problems” that inequality entails, the most obvious of which is arguably poverty.
When respondents who regard income inequality as a “serious problem” are distinguished from those who regard it as “somewhat of a problem,” it is possible to tease out a nontrivial increase in the serious designation, a result suggesting that EXTENT is revealing a Katrina effect consistent with the DLS hypothesis.
The final two items, REDUCE and PROGRAMS, are more straightforwardly inconsistent with a Katrina effect of the sort predicted by the DLS hypothesis. The decline in REDUCE is not significant, but the decline in PROGRAMS is both significant and substantial. There is simply no evidence, then, of an increase in support for government programming, and in fact the trend in PROGRAMS suggests, if anything, that Katrina precipitated an antiprogramming backlash. The latent-class analyses, to which we turn now, will again cast light on why the state-programming version of the DLS hypothesis fails so spectacularly here.
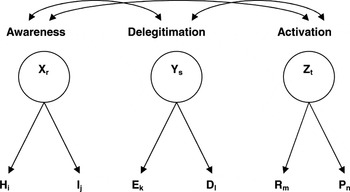
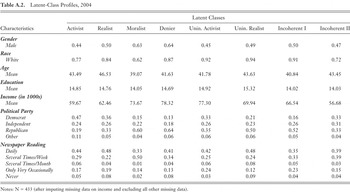
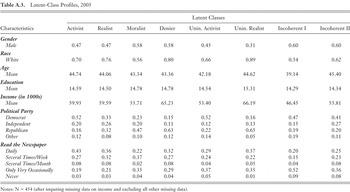
We will carry out our latent-class analyses by fitting the confirmatory model represented in Figure 1. Under this specification, each latent variable is indexed by two manifest variables, and the association between the manifest variables is presumed to be entirely generated by (a) the association between the latent variables, and (b) the association between each latent variable and its two indicators. The three latent variables in Figure 1, each of which has two classes, may be cross-classified to form a single eight-class latent variable (as represented in Table 1). In the Appendix, we have provided further details on our latent-class specification, and we have also provided supplementary results on the characteristics of the members of each of the latent classes (see Tables A.1, A.2, and A.3).

Confirmatory Model with Three Latent Variables
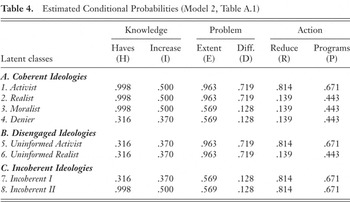
We will base our discussion on estimates from a “partly homogeneous” model that forces the eight latent classes to be defined identically across the two time periods. This constraint ensures that the latent classes have the same meaning in 2004 and 2005, and that changes in the sizes of these classes can therefore be meaningfully tracked (see Appendix for details). As shown in Table 4, the activist profile under our preferred model is just as one would anticipate, with members of this class very likely to be aware of poverty and inequality, very likely to regard inequality as a problem, and very likely to support government efforts to reduce inequality. The model implies, for example, that members of the activist class will agree, with probability .998, that we are “becoming a society of the haves and the have-nots” (HAVES). Because the corresponding conditional probability for INCREASE is lower, we can conclude that the awareness latent variable is principally defined by HAVES, surely a desirable result insofar as HAVES is a better indicator of poverty awareness than is INCREASE. The remaining conditional probabilities are likewise in line with expectations and thus generate latent classes with very straightforward meanings.
Estimated Conditional Probabilities (Model 2, Table A.1)

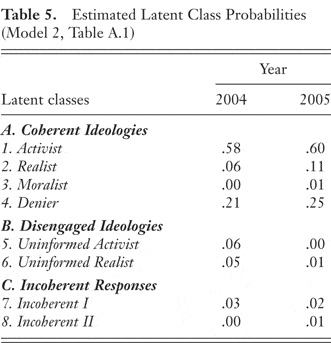
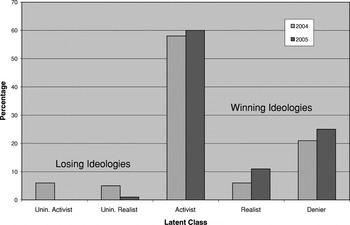
The main parameter estimates of interest are the latent-class probabilities themselves. These estimates, which are reported in Table 5 and graphed in Figure 2, provide a simple picture of the winning and losing classes in the aftermath of Katrina. The two disengaged classes stand out as especially notable losers (see Panel B, Table 5). Although they together accounted for 11% of the population in 2004, they are reduced to a mere 1% of the population by 2005. This virtual elimination of classes built on a foundation of ignorance is of course quite consistent with a DLS effect. At the same time, because the disengaged classes constituted only 11% of the population in 2004, the potential scope of this DLS effect was quite circumscribed from the start. Viewed from this lens, one might conclude that the DLS effect on poverty and inequality awareness was as powerful as it possibly could be, operating with almost full success within the relatively small susceptible population.
Estimated Latent Class Probabilities (Model 2, Table A.1)


Losing and Winning Ideologies
The foregoing story ignores the obvious point that deniers, who also operate from a foundation of ignorance, were potentially susceptible to a DLS effect as well. We have hypothesized, however, that they were very much under the sway of a particularly resistant ideology and would likely reject the “lessons of Katrina” held out by journalists and broadcasters, lessons that were viewed within this class as so much predictable liberal diatribe. This hypothesis, which clearly runs counter to a simple DLS hypothesis, seems to be on the mark. In fact, far from withering away under the influence of Katrina coverage, the denier class proved to be one of the winners in the post-Katrina period. The latter result explains in part why the overall increase in awareness, as revealed in Table 3 (Panel A), was so modest. It was modest not just because the “ignorant” disengaged classes were so small in 2004, but also because the denier class, which is also “ignorant” and hence vulnerable to a DLS effect, didn't take the liberal bait and instead evidently dug in.
The realist class was another winner coming out of Katrina. As shown in Panel A of Table 5, the realist class increased from 6% of the population to 11%, hardly a spectacular takeoff but nonetheless suggestive that the Katrina effect had a backlash character to it. The growing realist sector may be understood as the emerging middle class of poverty attitudes. Although realists agree with liberals that poverty and inequality are serious problems, they are unpersuaded by conventional liberal government programs and presumably are holding out for other answers. Why did this position prove more attractive after Katrina? As argued above, Katrina was not just interpreted as a “call for action,” but also as an object lesson in the ineptitude and inefficiency of government programs. The rise of the realist and denier classes suggests that the latter lesson resonated and developed a real constituency.
The former lesson also had its adherents, but Table 5 reveals that the activist class nonetheless grew only trivially in size (see Panel A, Table 5). It is difficult to reconcile this minor growth with a DLS story that represents Katrina as a revelation and a call to arms. Why didn't Katrina generate a more substantial growth in activism? As we have already noted, it is surely relevant that Katrina was a vehicle for a powerful story of government ineptitude, hardly a story tailor-made for the activist vision. It is also relevant that this vision could only spread by converting a highly culled and unreceptive subpopulation of nonactivists. Because the activist class was already very large in 2004 (i.e., 58% of the population), only a small pool of nonactivists was available for conversion, and that pool was highly culled for anti-activist sentiment (i.e., 51% of the 2004 nonactivists were deniers). The DLS hypothesis fails, then, because the population of potential converts was so limited. Even before Katrina, a sizable activist constituency had already “discovered” poverty, had already deemed it a serious problem, and had already expressed support for a reinvigorated state response.
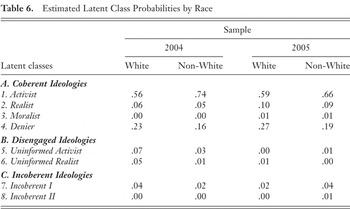
We conclude our analyses by providing evidence on racial differences in the Katrina effect. In Table 6, we report latent-class probabilities after dividing the sample into Whites and non-Whites, an exceedingly primitive racial classification that we are obliged to adopt because the non-White subsample in the Maxwell Poll is so small.13
The 2004 sample includes thirty-two non-Whites, and the 2005 sample includes fifty-two non-Whites.
These estimates are calculated on the basis of posterior membership probabilities (see Vermunt and Magidson, 2005).
Estimated Latent Class Probabilities by Race

CONCLUSIONS
Although inequality and, more recently, poverty have been on the rise in the United States, this development has played out relatively slowly and without much fanfare. The coverage of Katrina is fascinating precisely because it converted a conventional story about natural disaster into an unconventional and high-profile story about the socially constructed disasters of poverty, inequality, and racism. The social side of the Katrina coverage took the form of the claim that Katrina had exposed and made tangible pockets of extreme poverty that had heretofore been our “dirty little secret” (San Diego Union-Tribune 2005). If such an account is credible, the absence of major antipoverty initiatives in the United States may be understood as arising partly from (a) public ignorance about the extent of poverty, (b) the associated lack of public support for antipoverty programs, and (c) the purely rational decision on the part of policymakers to attend to other issues about which the public evidently cared more.
We haven't asked here why this particular lens proved to be one of the main ones through which journalists and broadcasters viewed Katrina. Rather, that question is best left to media scholars, allowing us to focus instead on the simpler sociological question of whether the DLS story, however it may have been settled upon, is at least consistent with the structure of attitudes about poverty and inequality. This effort may be understood as the usual sociological “mopping up” that takes place long after the headlines have faded away.
The DLS story proves to be on the mark in some respects. We have shown that, just as the DLS story implies, public awareness of poverty and inequality did evidently increase as a consequence of Katrina. The two disengaged classes, both of which are built on a foundation of ignorance about poverty and inequality, effectively disappeared in the wake of Katrina, producing a much-simplified attitude landscape comprising three classes: realists, activists, and deniers. However, because the two disengaged classes were quite small even before Katrina, there was not all that much room for Katrina to have an ignorance-eliminating effect. The DLS rhetoric was in this sense overblown.
The DLS story falls short on other fronts as well. The ignorance-eliminating effects of Katrina were suppressed not just because the two disengaged classes were small, but additionally because the deniers, who were also “ignorant” and seemingly good candidates for a DLS effect, did not take well to the liberal lesson that they no doubt regarded as foisted upon them. In fact, the denier class increased in size in the aftermath of Katrina, as did the realist class. The growth of these conservative interpretations of poverty and inequality suggests that the “call for action” story, which at least some journalists stressed in their Katrina coverage, was countered by the equally powerful lesson that government intervention can be inefficient and inept.
The final question that may then be asked is whether the underdeveloped response to poverty in the United States simply reflects a lack of awareness of the extent of poverty and inequality. Is there any merit at all to the DLS story that, had we only known about the problem, we wouldn't possibly have tolerated so much poverty? In addressing this question, one should bear in mind the research evidence suggesting that policymakers take public opinion into account only when (a) it is well organized and stable; (b) a clear and unquestionable majority view has emerged; and (c) the beliefs in question are fundamental, deeply held, and color much public debate (e.g., Manza and Cook, 2001). We conclude by considering each of these three conditions in turn and asking whether they have been met in the present case.
Are attitudes about poverty and inequality coherent? The latent-class approach, which could have revealed all manner of incoherent views, in fact indicated that well-organized ideologies dominate the landscape. If respondents were truly engaging in a random walk through the items, we would have found many of them in one of the two “incoherent” combinations (see Panel C, Table 5). However, only 3% of the 2004 sample indeed embraced these response sets, while another 11% settled on disengaged ideologies that might be regarded as a mild form of incoherence. The remaining four classes, each of which is exceedingly coherent, accounted for 85% of the population in 2004. Although this is an upper-bound estimate of the extent of coherency (given that missing cases and “no opinion” responses were excluded), it is nonetheless strikingly high and clearly inconsistent with the DLS presumption that the pre-Katrina mindset was one of ignorance and poor organization. By 2005, the four coherent classes accounted for a full 97% of the population, implying that Katrina introduced yet more organization into poverty and inequality attitudes.
Has a clear and unquestionable majority view emerged? We have emphasized that Katrina polarized the population into three competing groups: activists, realists, and deniers. Among these three groups, the clear winner in 2004 and 2005 alike is the activists, and by a resounding margin to boot. If taken literally, this result suggests that politicians could conceivably build successful campaigns around an activist ideology, just as John Edwards evidently strategized in settling on a “Two Americas” platform in his 2004 presidential bid. Although our results suggest that the activist stance is a majority one, we also appreciate that it is child's play to tinker with the underlying specification (e.g., introduce new variables, change question wording) in ways that could produce nontrivial changes in the sizes of the latent classes.15
It is well to bear in mind here that our version of the HAVES item yields a higher estimate of poverty awareness than the version analyzed by the Pew Research Center (2005b). See note 10.
How strongly committed is the public to particular inequality or poverty ideologies? This last condition is the most daunting one and probably explains, more so than the preceding two, why poverty and inequality policy is so underdeveloped. There is simply nothing in our results to suggest that poverty or inequality ideologies are unusually strong commitments. After all, we have simply shown that the activist ideology is widely preferred to alternative ideologies, not that any poverty or inequality commitment necessarily dominates other commitments that develop on a wide range of other issues. The prevailing rational-choice position on this point is that an activist ideology is likely to be an especially weak commitment. That is, short of adopting Boudon's (2001) view that commitments to principles figure prominently in individual utility functions (e.g., a principled commitment to egalitarianism), any political program built around an antipoverty platform will be weak by virtue of the relatively small number of supporters who would personally gain from it. From our point of view, the counterargument of Boudon should not be dismissed outright, all the more so given the resurgence of interest in how values and principles, as opposed to narrowly construed interests, play a role in political behavior (e.g., Brooks 2006). However, even if one concedes that principles can in some cases yield deep commitments, it certainly remains to be shown that egalitarian principles, in particular, are likely to be the winning principles around which a winning ideology could be organized. This suggests that the underdeveloped response to poverty and inequality in the United States is attributable neither to ignorance about poverty and inequality (i.e., the DLS hypothesis), nor even to the failure of a dominant activist ideology to emerge. Rather, the principal obstacle on the public opinion side is that an activist ideology is typically a side commitment, not a deeply felt “master commitment” that overrides all others and absolutely forces politicians to pay heed.
Must poverty and inequality ideologies inevitably be weak side commitments in this sense? We think not. It is at least conceivable that they might in the future assume a more substantial role as part of a refashioned liberal agenda (see Massey 2005). We are not of course referencing here the old social democratic solution of “back dooring” poverty programs through larger universalistic programs that gave most everyone a stake in redistribution and hence generated broad and deep commitments to state activism (e.g., Esping-Andersen 2001). This approach faces any number of profound obstacles in the United States. The most obvious alternative, one which is far better suited to U.S. sensibilities, involves making the case that poverty is rife with externalities, such as high rates of drug use, crime and costly incarceration, high health care costs that are collectively borne, high rates of single motherhood and unwanted pregnancies, and much foregone productivity and lowered GNP. That is, just as environmental concerns have been successfully brought into the mainstream via the language of externalities rather than values (with global warming as the “master” externality), so, too, issues of poverty and inequality may ultimately be developed into mainstream ideologies emphasizing the high costs that are collectively borne. It is not implausible that environmental and poverty planks will ultimately be joined together into a unified and cohesive “new liberalism” that rests explicitly on just such an externalities framework. The coverage of Katrina, for all its shortcomings, may be understood as consistent with this renewed appreciation of how poverty, inequality, and racism color most everything, even how a natural disaster plays out.
APPENDIX
In its conventional form, the latent-class model precludes all direct associations between the manifest variables, a constraint that may be expressed as follows:

where the latent variable V has eight classes indexed by t,πijklmntHIEDRPV is the expected probability in cell (i,j,k,l,m,n,t), and the manifest variables H through P are defined in Table 2. The specification of Figure 1 is then secured by fitting additional side constraints on the conditional probabilities:

The preceding constraints ensure that the manifest variable H “loads” exclusively on the awareness variable. For the other seven manifest variables, a corresponding set of constraints must also be imposed, with each such set ensuring that the probability of falling into a particular category of the manifest variable is not affected by the irrelevant latent variables. Finally, we must ensure that latent-class memberships are mutually exclusive, a constraint that may be represented as follows:

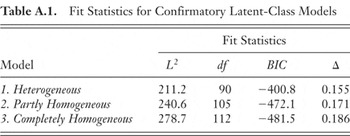
The fit statistics for our models are presented in Table A.1. The first model in this table allows the parameters of our latent-class model to vary freely across the two years, while the second model constrains the conditional probabilities to be invariant. The latter model, which we rely upon exclusively in our discussion, has the virtue of ensuring that the defining characteristics of each latent class are consistent across periods. We can therefore use it to track changes in the sizes of the latent classes without the complication of changes in the meaning of those classes. The final model in Table A.1, that of complete homogeneity, imposes the additional constraint that the sizes of the latent classes be invariant. Although the Bayesian Information Criterion (BIC) prefers this model, it generates an increase in the likelihood-ratio test statistic that is highly significant.
Fit Statistics for Confirmatory Latent-Class Models

Latent-Class Profiles, 2004

Latent-Class Profiles, 2005