
Introduction
The ruins of hundreds of fortified strongholds are scattered throughout Garhwal Himalaya, in Uttarakhand, India, occupying elevated positions on the ridges and mountain tops of the Central Himalayan region. It is generally assumed that the fortification phenomenon in Garhwal originated during the downfall of the Katyuri Dynasty around the twelfth century AD, and continued to the fifteenth century, when King Ajaypal of the Parmar Dynasty consolidated this entire region of Central Himalaya (Raturi Reference Raturi1928: 2). Medieval fortification-building was widespread across the (Trans-)Himalayan regions of Himachal Pradesh, Nepal and Ladakh (Howard Reference Howard1995; Jerath Reference Jerath2000; Devers et al. Reference Devers, Bruneau and Vernie2015). In the Central Himalayan region of Garhwal, however, the phenomenon is particularly poorly researched. There is currently no convincing archaeological or historical evidence to confirm that the phenomenon did indeed begin under the Katyuris. Furthermore, the relationships between the forts and Katyuri administrative divisions is unknown, and the study of the distribution and function of the forts has been almost entirely neglected. Most crucially, only one fort (Chandpur Fort) has been partially excavated by the Archaeological Survey of India (in 2004), and there are few written sources that refer to the many forts in the region. The chronology of forts and their spatial distribution across the Garhwal region is therefore poorly understood.
This article presents newly collected survey data and the distribution pattern of 193 strongholds (Rawat Reference Rawat2017), more than tripling the previously documented and published number (Raturi Reference Raturi1928; Bhatt Reference Bhatt1951; Negi Reference Negi1988; Kathoch Reference Kathoch1996). Using all available sources, we interpret 36 of these strongholds as major forts. We show that these new survey data allow for the proposal of new, more complex theories about the fortification phenomenon in Garhwal Himalaya. In particular, we focus on theories concerning visual signalling. We formally present and explore these theories using GIS techniques (viewshed and line-of-sight analyses) and network science, and statistically address the robustness of some of our key network science results in light of the considerable chronological uncertainty inherent in the survey data.
The fortification phenomenon in medieval Garhwal Himalaya
The earliest relevant published sources are limited to brief accounts of some of the forts (Atkinson Reference Atkinson1884; Bahadur Reference Bahadur1916) and of the geography of the Garhwal region (Vaishnav Reference Vaishnav1927). Raturi (Reference Raturi1928) was the first scholar to publish a list of 52 strongholds; Bhatt's (Reference Bhatt1951) history of the region also includes a list of 52 forts, but there are inconsistencies in fort names between the two sources. More recently, Dabral (Reference Dabral1986, Reference Dabral1990) studied the tradition and geographic distribution of Garhwal fortification and its putative relationship to the Katyuri administration, and Negi (Reference Negi1988) compiled a list of 64 major forts believed to have emerged during the gradual downfall of the Katyuri kingdom. The lists of forts compiled by Kathoch (Reference Kathoch1996) revealed, for the first time, the particularly widespread nature of the fortification phenomenon in the Garhwal region, but also the challenges involved in securely identifying and cataloguing them. Further discussion of the region's history and its fortification is offered by Chauhan (Reference Chauhan2000), Handa (Reference Handa2002) and Bijalwan (Reference Bijalwan2007).
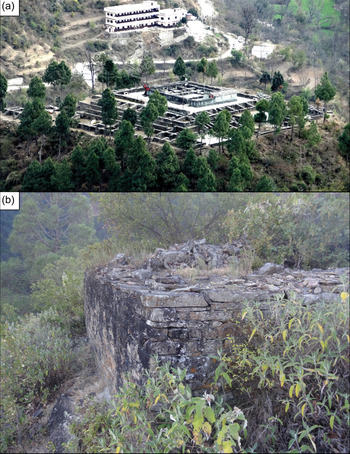
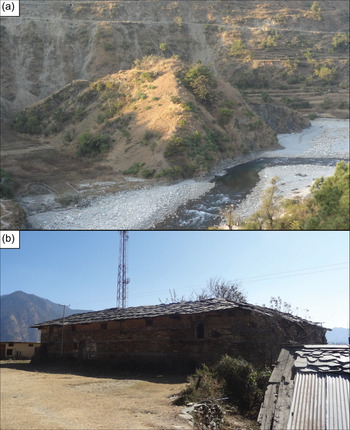
The Katyuris established themselves c. AD 700–800 as an independent political power in Garhwal Himalaya, as documented in copper land-grants and over 20 Katyuri inscriptions (Naithani Reference Naithani2008: 442). The administrative system divided the state into several mandalas (states within the kingdom), governed by an appointed official known as a Kotpal (Nautiyal Reference Nautiyal1969; Dabral Reference Dabral1987: 21). It is believed that a large number of monumental forts (locally known as Garhs; e.g. Figure 1) and smaller structures—the fortalices (Garhi; e.g. Figure 2)—were built by local chiefs called Garhpatis, who emerged after the decline of Katyuri power (Negi Reference Negi1988; Kathoch Reference Kathoch1996). Recent radiocarbon dating of the structural remains of the Chaundkot Fort in southern Garhwal, however, shows that it already existed during the tenth to eleventh centuries AD (Rawat & Nautiyal Reference Rawat and Nautiyal2020). This suggests that many other forts may have existed during the Katyuri reign. The copper land-grants issued by Katyuri rulers suggest that Kotpals could be identified as chiefs of a local fort (Nautiyal Reference Nautiyal1969; Altekar Reference Altekar1972).
a) Chandpur Fort, the first capital of the Parmar Dynasty, and the only partially excavated fort in the study area; b) Nimga fort, located on a hilltop, with huge walls over four levels (figure by N. Singh Rawat).

a) Hansora fortalice: few walls are visible, suggesting that this small stronghold served as a watchtower; b) Rajgarhi fortalice: a small stronghold later transformed into a Kotha (figure by N. Singh Rawat).

Around the end of the first millennium AD, the Katyuri Dynasty weakened politically, leading to the emergence of small principalities or chiefdoms. This disintegrating political setup was ruled by independent local Garhpatis, who controlled a large number of small principalities in this part of the Central Himalayan region. Raturi (Reference Raturi1928: 157) suggested that the chiefdoms were in frequent conflict with each other, seeking, among other aims, to expand their territories. This conflict continued into the fifteenth century when Ajaypal, the thirty-seventh king of the Parmar Dynasty, consolidated the chiefdoms in the region under his rule. This involved the inclusion of all forts in this Central Himalayan region within a single kingdom, leading to the area becoming known in the fifteenth century as Gadwal, and later as Garhwal (the Land of Forts) (Raturi Reference Raturi1928: 2). The Garhs are interwoven into the region's socio-religious and folk traditions, which, in the absence of historical records, currently provide one of the most important sources for studying medieval Garhwal (Oakley & Gairola Reference Oakley and Gairola1935).
The physical structures evidenced at many fort sites in Garhwal (Figures 1–2) range from residential, temple and defensive architecture, including Sumer (fortified, multi-storeyed, earthquake-resistant towers) or Kotha (fortified, square-shaped residences). The forts could have served strategic, defensive purposes. Their elevated locations were ideal for watchtowers to oversee and control the surrounding valleys and mountain slopes. Indeed, the region witnessed the first incursions of the Nepali kings Askochalla and Krachalla c. AD 1100–1200, documented in inscriptions at the towns of Gopeshwar and Barahat (Dabral Reference Dabral1990: 82). Folklore also suggests several seventeenth-century incursions from Tibet to the north (Chatak Reference Chatak1996: 317). Furthermore, following attacks by the Rohillas (the contemporaneous rulers of Rohilkhand), the Mughals also captured the Garhwal foothills in the seventeenth century (Negi Reference Negi, Khanduri and Nautiyal1997). In the nineteenth century, the British also captured this region (Khanduri Reference Khanduri1997: 28; Handa Reference Handa2002: 167). As well as or instead of defensive functions, it could also be argued that the strongholds played a role in the region's socio-religious tradition as many were located along pilgrimage routes (Rawat Reference Rawat2017).
From the fifteenth century onwards, the new unified control of the strongholds may have allowed them to serve additional region-wide functions, such as within a networked communication system. From their elevated positions, messages could be relayed between the forts and fortalices using drum beats (Dhol-Sagar) and trumpet sounds (Ransingha). Although this particular practice is now limited to social events (Dabral Reference Dabral1995; Alter Reference Alter2014), these sound beats could have been used as acoustic signalling in the case of enemy incursion (Purohit Reference Purohit2001). Messages could also have been communicated through visual signals using fire, smoke or flags. There is, however, no archaeological evidence of such visual-signalling systems, other than the prominent elevated locations of forts and fortalices. Here, we use network-science techniques to explore the viability of this hypothetical visual-signalling network theory.
Research aim and questions
We present the most extensive catalogue of forts and fortalices compiled to date, including new survey data. We use these data to assess the possible changing functions of the strongholds as a networked visual-signalling system, from local, pre-fifteenth century clusters reflecting small chiefdoms to an integrated system during the fifteenth century. The research is driven by the following questions:
1. Can our knowledge of the fortification phenomenon be enhanced through analysis of the new survey data?
2. Can sets of sites be identified that reveal possible territorial boundaries of the eighth- to fourteenth-centuries AD local chiefdoms/mandalas? And do such sets form groups (so-called ‘communities’) in a theorised, fragmented visual-signalling network?
3. Is the existence of an integrated visual-signalling network—particularly from the fifteenth century onwards—a feasible possibility?
4. Do sites interpreted as major forts play an important role in the changing visual-signalling systems?
New survey data on Garhwal strongholds
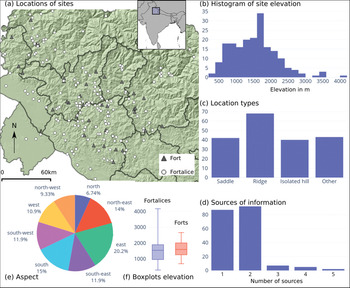
A new catalogue of 193 strongholds in Garhwal Himalaya (see Table S1 in the online supplementary material (OSM)) has been compiled by Rawat (Reference Rawat2017). These sites were identified through a combination of methods (Figure 3d):
• Ten sites were described in previously published academic literature (derived from sources mentioning locations, rulers and information other than merely the name of the sites given in previous lists (e.g. Raturi Reference Raturi1928; Negi Reference Negi1988)).
• Personal interviews were conducted with local villagers of the region in order to identify 173 sites (data derived from thousands of individuals at hundreds of villages via field visits and telephone calls; Rawat Reference Rawat2017).
• 57 sites were physically identified through field visits and on-site GPS mapping of locations and possible features (the topography of this Himalayan region and the location of strongholds on mountain tops precluded visiting more sites).
• 58 sites have the remains of temples, walls, Sumer or Kotha. Fourteen sites have evidence of defensive and residential architecture, and 12 sites have been transformed into ritual or religious places.
• 62 sites were identified using Toposheets of the Survey of India (1:50 000 scale).
• 20 sites were identified through remote-sensing data (including Google Earth).
A new catalogue of 193 forts and fortalices within Garhwal Himalaya (present-day district boundaries shown in part ‘a’) (figure by the authors).

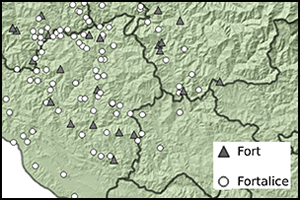
Some 106 sites (55 per cent) were identified through more than one source of information (Figure 3d). The 87 sites identified through only a single source should be considered as tentative. On the basis of the survey data, Rawat (Reference Rawat2017) cautiously interprets 36 sites as major forts (Garhs) and 157 sites as smaller fortalices (Garhi) (Figure 3a). Although all 36 ‘major’ forts were visited, this classification should be considered provisional, given both our limited knowledge of most other forts and that some fort locations might still be unknown.
Most sites are located at very high elevations (Figure 3b), typically positioned on prominent locations such as ridges or hilltops (Figure 3c). The sites’ slopes have diverse orientations (Figure 3e), and roughly equal numbers of sites are located in areas with intermittent, perennial or seasonal drainage (Table S1). The forts and fortalices have very similar locational profiles, and the elevation distribution of forts is similar to that of fortalices, although the latter include a wider range, with the 15 sites with the lowest elevation and the five sites higher than 3000m asl (Figure 3f).
Crucially, there is extremely limited evidence available for reconstructing the chronological development of the fortification phenomenon in this part of Central Himalaya. Two radiocarbon dates from Chaundkot Fort, however, confirm that it was in active use in the tenth and eleventh centuries at least (Rawat & Nautiyal Reference Rawat and Nautiyal2020). Furthermore, some eighth-century historical sources reveal that Prince Kanakpala of Dhar Malwa (central India) visited Garhwal and settled at Chandpur Fort (Kathoch Reference Kathoch2010: 137). One of his descendants, Ajaypal, unified the entire Garhwal region in the fifteenth century AD. At the other end of the chronological spectrum, historical records suggest that Langur fort was active during the seventeenth- to eighteenth-century Nepali or Gorka invasions (Khanduri Reference Khanduri1997). In view of these references, we can therefore assume a wide temporal span for the fortification phenomenon in Garhwal Himalaya between AD 800 and 1800.
Methods and results
We focus on exploring the theory that forts and fortalices may have functioned as fragmentary local or region-wide integrated visual-signalling networks. Our computational method to address these questions comprises four steps: line-of-sight networks, network analysis, configurations and sensitivity analysis. These are introduced in turn, along with a technical description of their results. The results are then further assessed and interpreted within their archaeological and historical contexts in the Discussion section. The methodology applied, the software used and the results are described in full detail in the OSM.
Line-of-sight networks
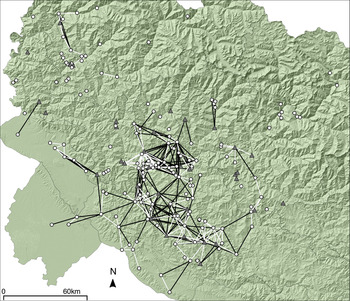
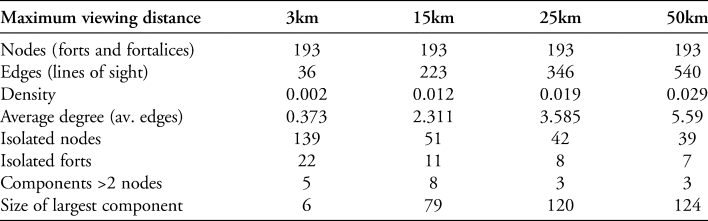
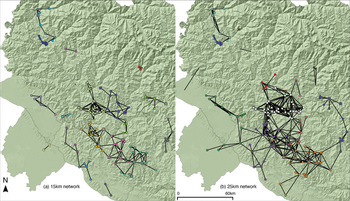
We first created a range of line-of-sight networks (de Floriani et al. Reference de Floriani, Marzano and Puppo1994) using GIS with differing maximum viewing distances of 3km, 15km, 25km and 50km. As very few forts are within a 3km distance of each other (at which individual humans would be visible), the 3km visibility network is highly disconnected and cannot represent an efficient visual-signalling network. The 50km network is highly connected, but, at this distance, only huge fires and smoke columns would be visible (we include results for the 50km network in Table 1 for comparison with the other networks). The 15–25km visibility networks (Figure 4) are most likely to reflect the structure of a possible signalling network: at these distances, fire and smoke signals are still visible, while allowing for observation points to be spaced over a large area. We therefore focus our analyses on the 15–25km networks.
Two nested visibility networks connecting forts (grey triangles) and fortalices (white circles) with a maximum viewing distance of 25km (black) and 15km (white) (figure by the authors).

Network statistics of visibility networks with differing maximum viewing distances.

Network statistics and communities
Next, we analysed the structure of these networks, the role of individual strongholds within the networks, and the well-connected groups of strongholds (so-called ‘communities’). Table 1 presents summary network statistics for all visibility networks (see the OSM). The 15km network has fewer edges (lines of sight) and therefore a lower density (proportion of edges over all possible number of edges) than the 25km network. It is also more disconnected in components (sets of nodes not connected to other sets of nodes), and has 51 isolated strongholds (those unconnected to other strongholds via lines of sight). Notably, the 25km network includes 120 sites (62 per cent of the total) in its largest component. Thus, information could be shared between any of the 120 sites, making this network a viable candidate for an integrated, region-wide, visual-signalling system.
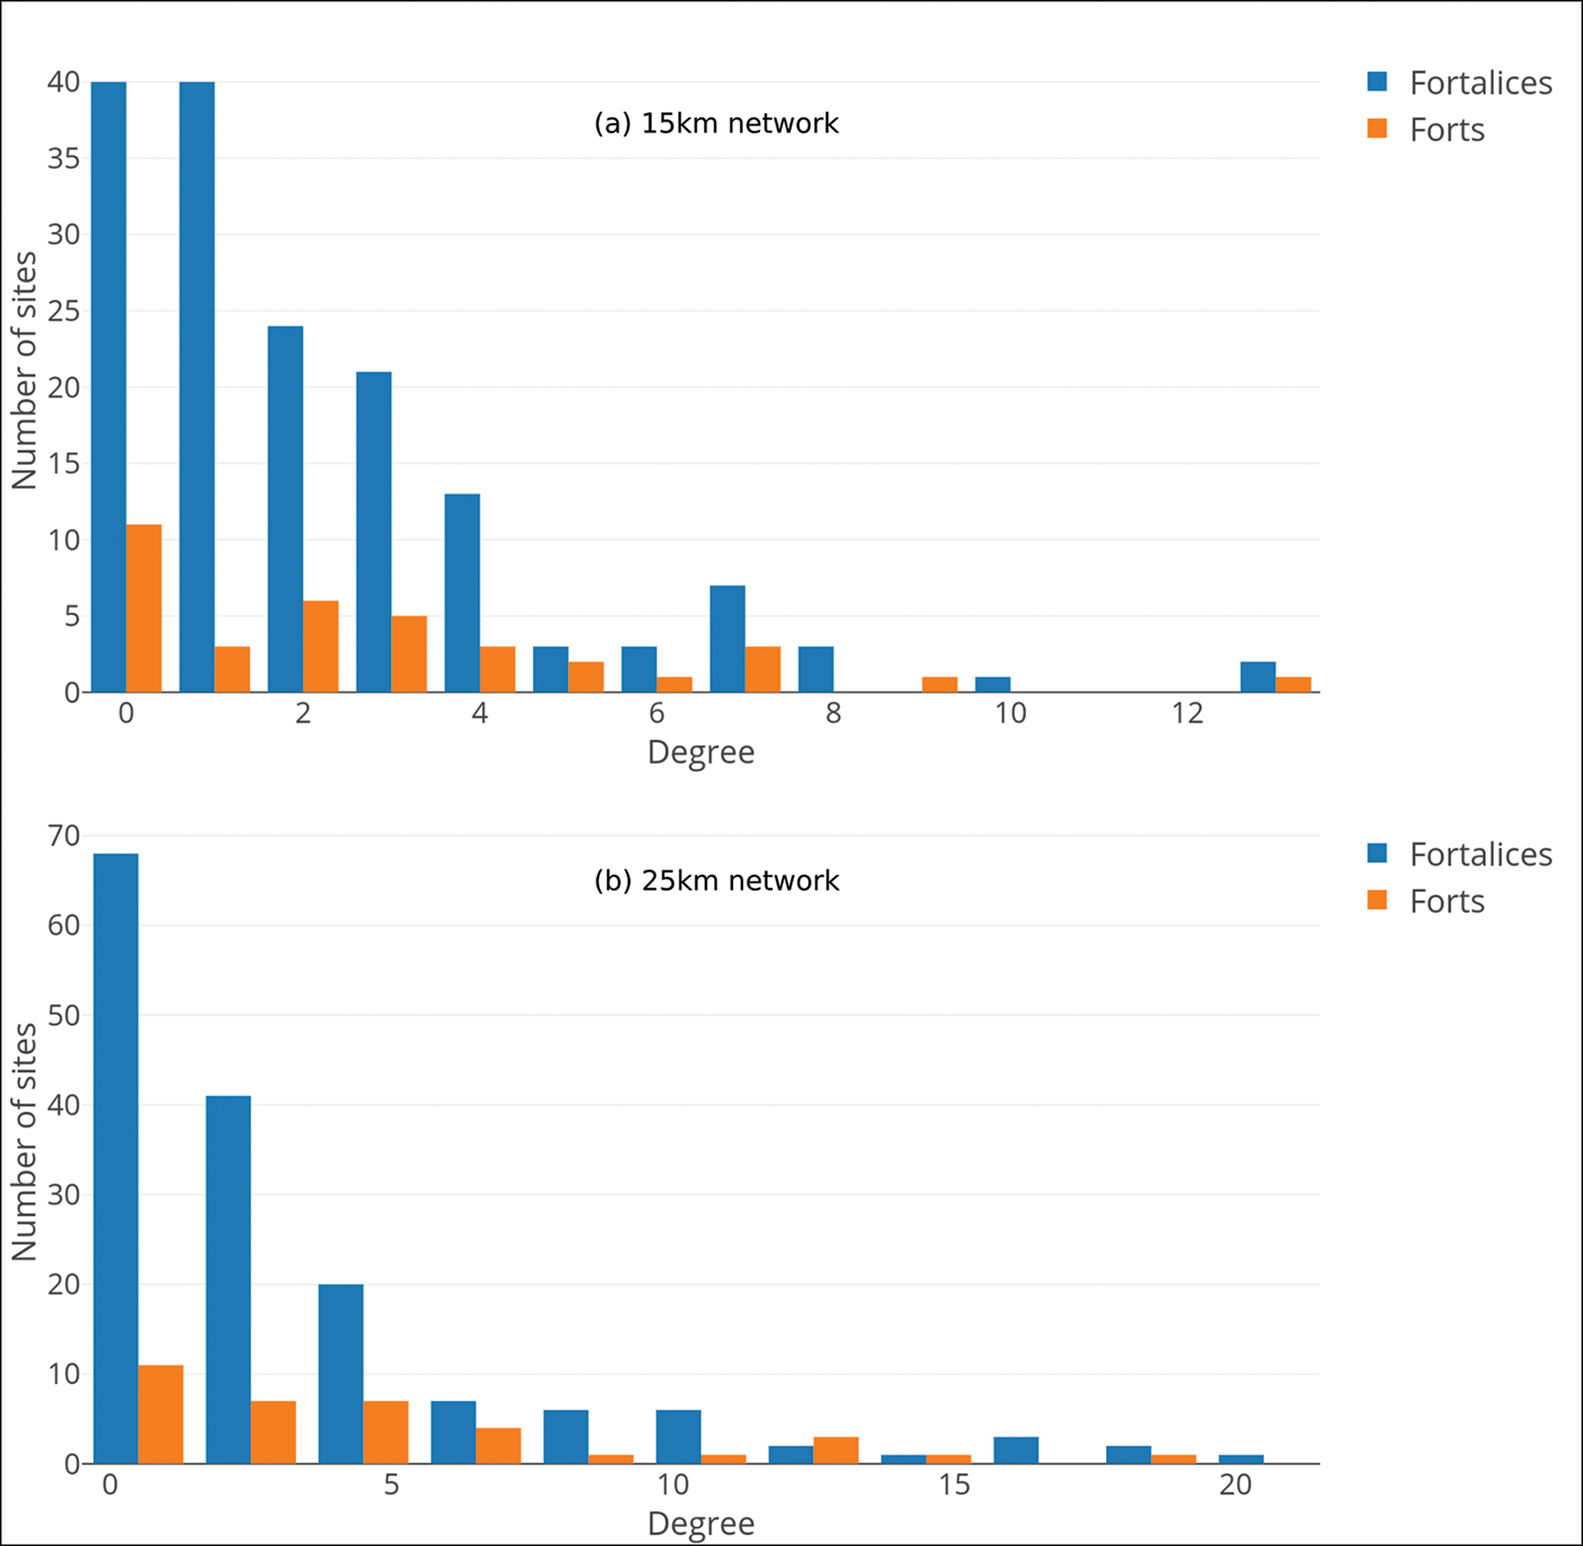
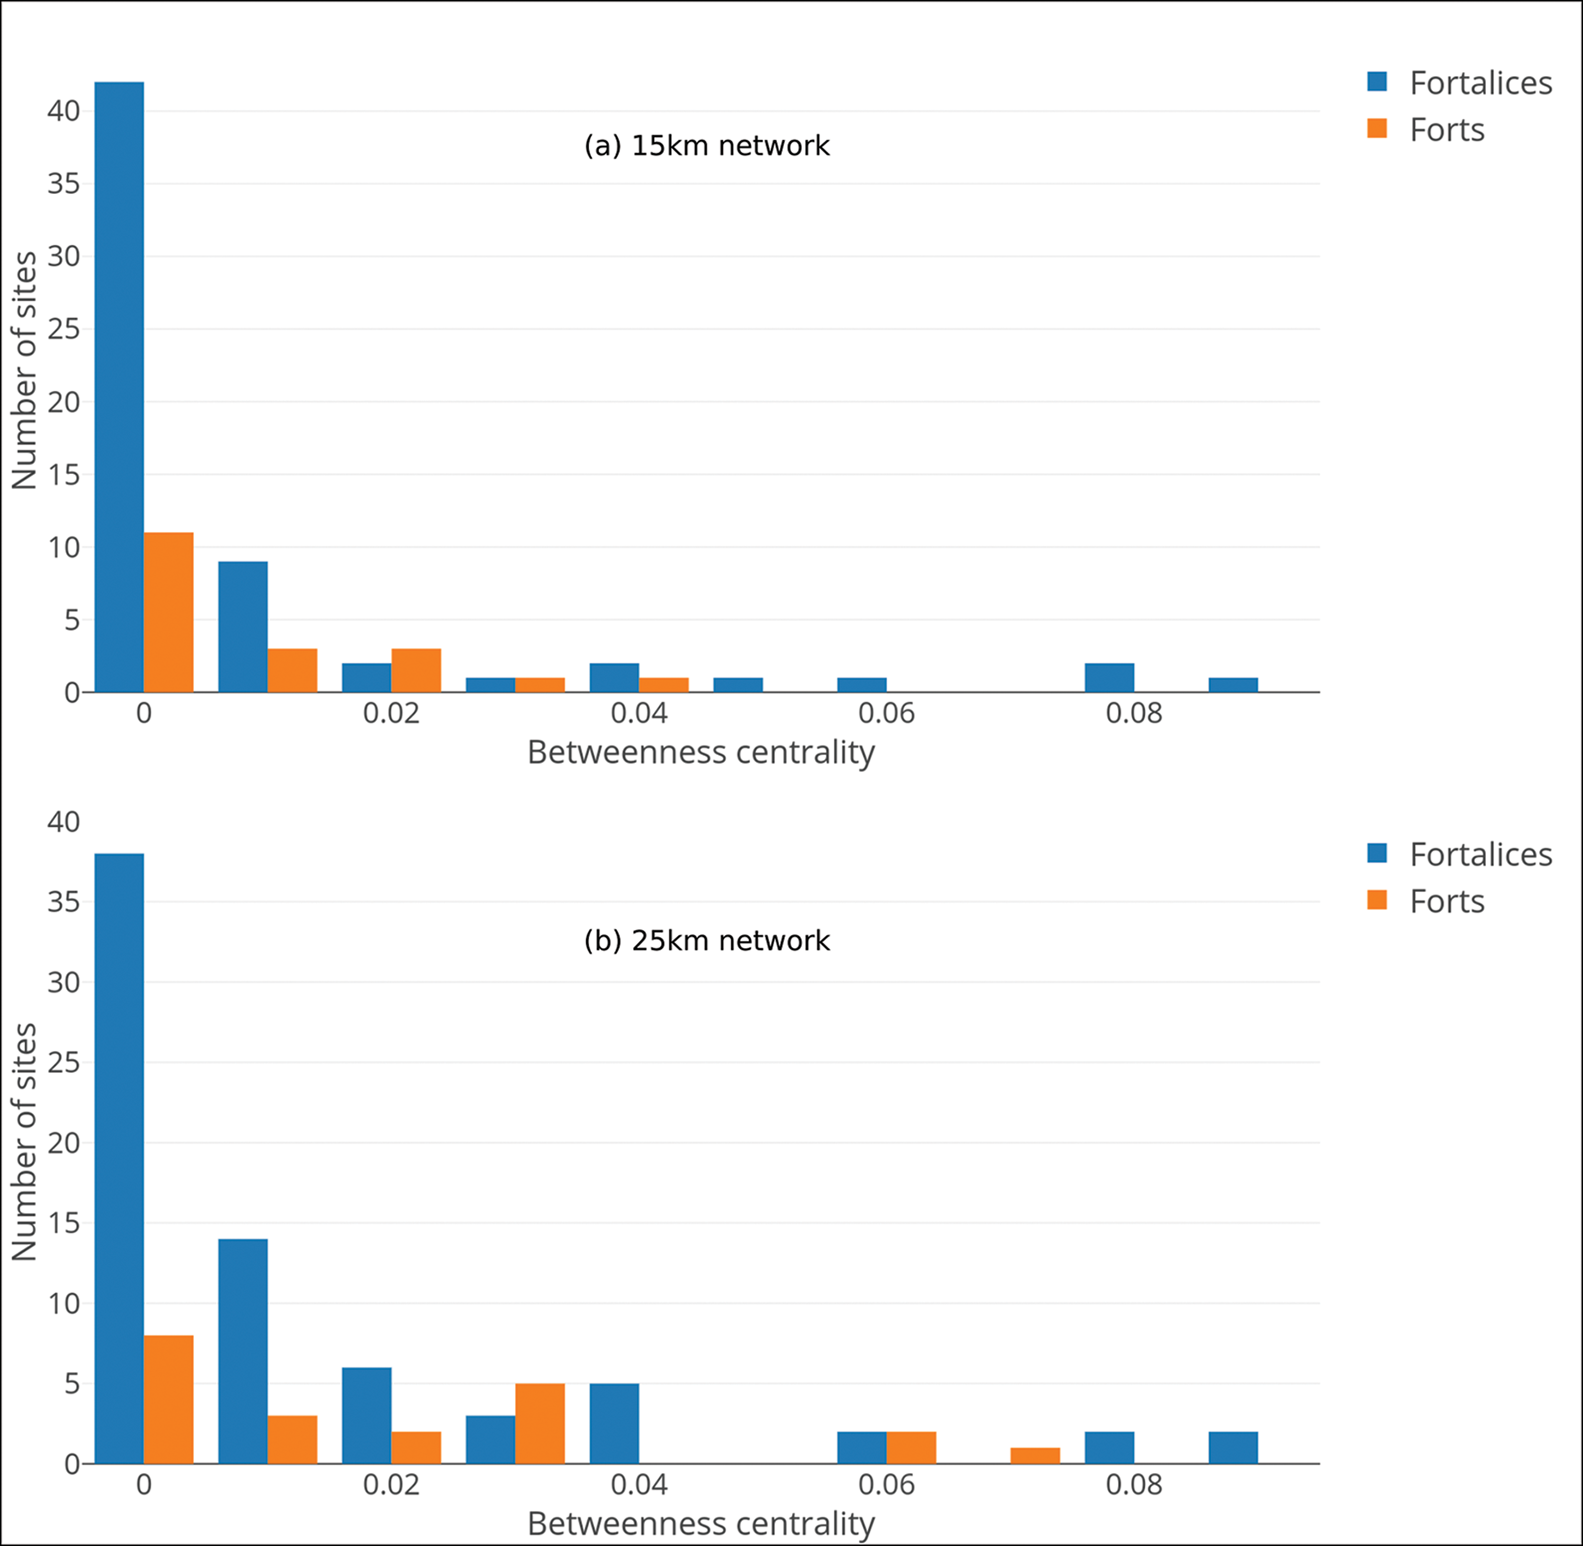
The majority of sites have very few lines of sight connecting to other sites, but a few have a higher degree (the degree of a stronghold is the number of lines of sight connecting to the site); these are ‘hubs’ (Figure 5). This pattern indicates that a few sites could have served to relay information directly to a large number of other sites in their immediate vicinity. Betweenness centrality reveals how important each stronghold is as an intermediary in visual signalling. The distribution of this metric again illustrates the existence of a few hub sites that functioned as necessary go-betweens (Figure 6). Crucially, there is little difference between the forts and fortalices in terms of either degree or betweenness distributions, suggesting that they could both have fulfilled similar roles in the networks (see research question 4).
Degree distribution (number of lines of sight per site) of visibility networks up to 15km (a) and up to 25km (b) (figure by the authors).

Betweenness centrality distribution of visibility networks up to 15km (a) and up to 25km (b) (figure by the authors).

Next, we sought to define ‘communities’ in the networks using the Louvain algorithm to identify sets of nodes (so-called ‘modules’) that are more connected to each other than to other sets of nodes (this is a heuristic algorithm that optimises modularity and results in a list of clusters; see Blondel et al. Reference Blondel, Guillaume, Lambiotte and Lefebvre2008). This allows us to explore our second research question further. The results for the 15km network reveal communities on the borders of the study area that may have functioned as short-distance, visual-signalling clusters, which could in turn effectively communicate—locally among themselves—possible enemy incursions (Figure 7a). It is notable that each community in the 15km network seems to be structured around a single major fort (Figure 7a). When the method is applied to the 25km network, however, the 15km communities on the edge of the study area become integrated with those at the centre of the study region (Figure 7b).
Results of community detection applied to the 15km (a) and 25km (b) networks. Node colours represent communities identified by the Louvain modularity method (Blondel et al. Reference Blondel, Guillaume, Lambiotte and Lefebvre2008); major forts are indicated by squares; isolated nodes are excluded (figure by the authors).

Configurations and comparison with random graphs
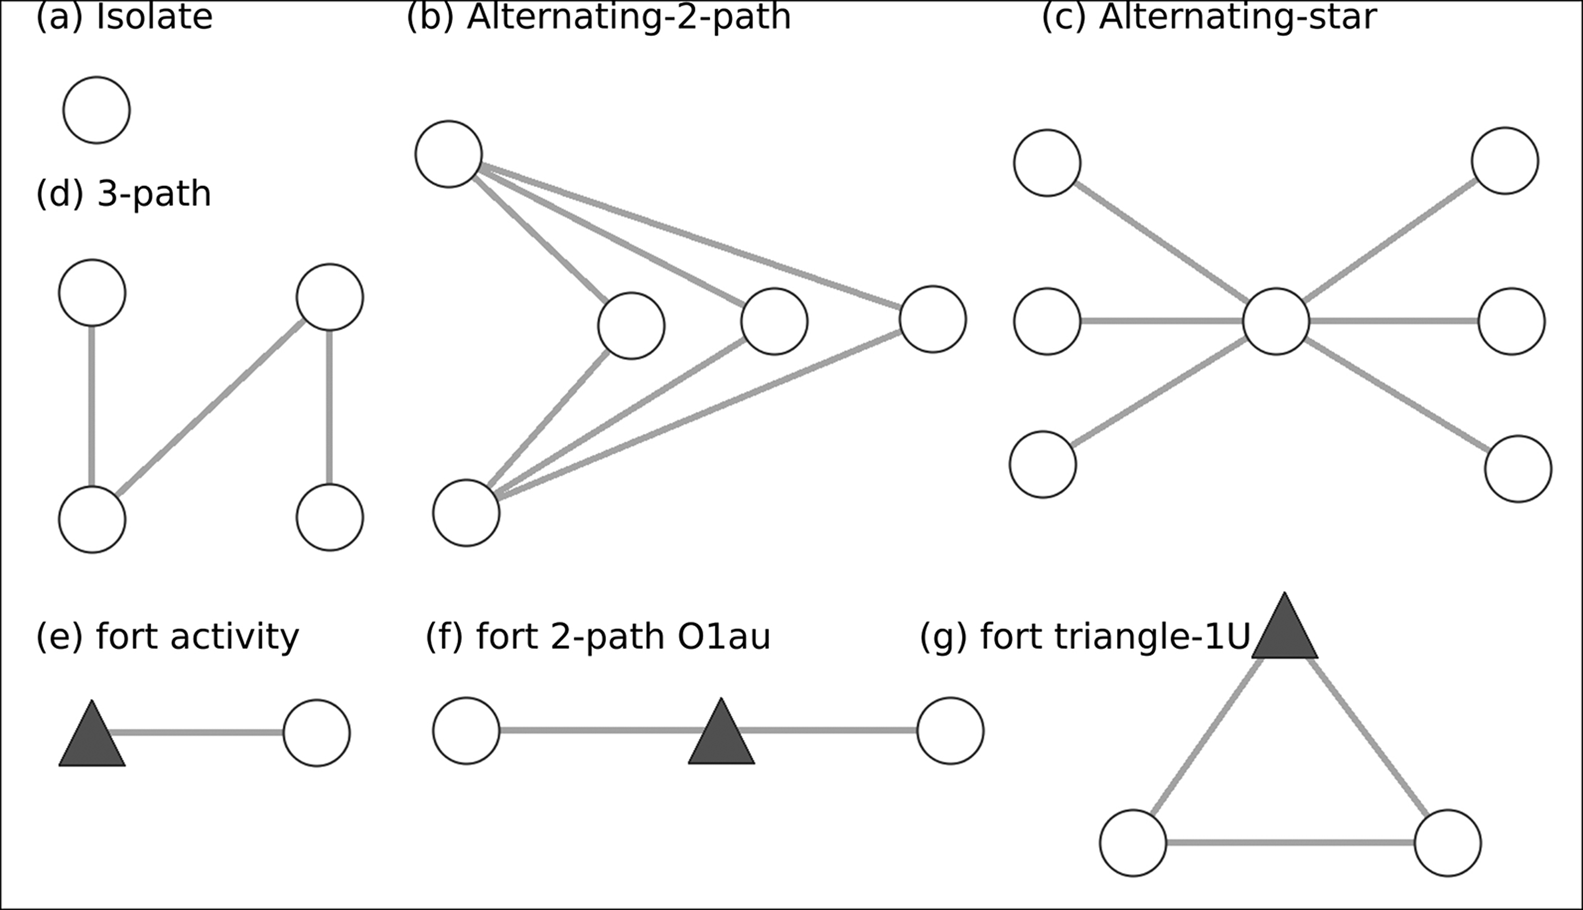
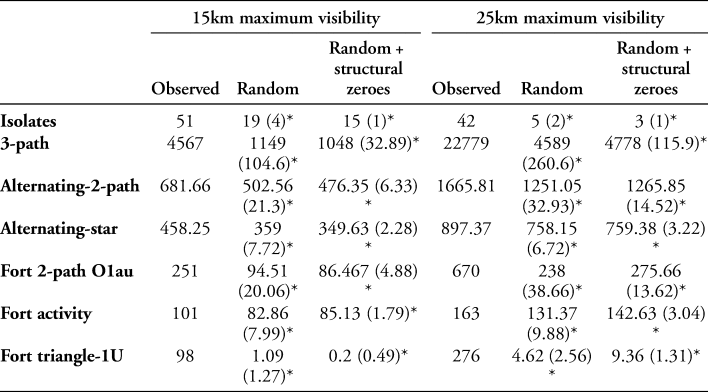
To evaluate whether these networks could have functioned as effective visual-signalling systems, they would need to display certain characteristics or network structural features, represented by so-called ‘configurations’ (Figure 8; see the OSM): strongholds tend to be included in the network (i.e. few isolates), the existence of chains of intervisibility (3-path), alternative chains in case one signalling path is compromised (alternating-2-path), communication hubs (alternating-star), and forts as important intermediaries (fort-activity, fort-2-path-O1au), or as being similar to other strongholds (fort-triangle-1U) (for more detail, see the OSM). The next step in our method allows us to evaluate whether these structures are present in the 15km and 25km networks by counting the theorised configurations within them (Brughmans et al. Reference Brughmans, Keay and Earl2014). Table 2 (columns marked ‘Observed’) presents these counts, illustrating that both networks have very high counts for all configurations: they represent the structure we would expect of a functional visual-signalling network.
Network configurations used in this study to represent theories of visual-signalling networks (a–d) and the roles of forts (represented as grey triangles) within these networks (e–f) (figure by the authors).

Configuration counts for the observed 15 (grey) and 25km networks, and averages (standard deviations in parentheses) of 1000 simulated configuration counts using Bernoulli random graph models. Asterisks indicate where the simulated count is significantly different from the observed count, according to the t-statistic (see Appendix S2 in the OSM).

To evaluate whether these counts are significant we compare them with random graph models. Do networks of this size tend to have these structural features, or is it particular to these ‘observed’ networks (see the OSM; Brughmans & Brandes Reference Brughmans and Brandes2017)? The configurations representing our theories concerning a visual-signalling network are all much more common in the ‘observed’ network than in the simulated, random networks (Table 2). This adds further support to the possibility that this system of strongholds functioned as a visual-signalling network. The networks include many chains of lines of sight, and is robust due to the existence of many alternative paths. One exception is the high number of isolated nodes, which suggests that the visual-signalling network may have only covered part of the study region.
Sensitivity analysis
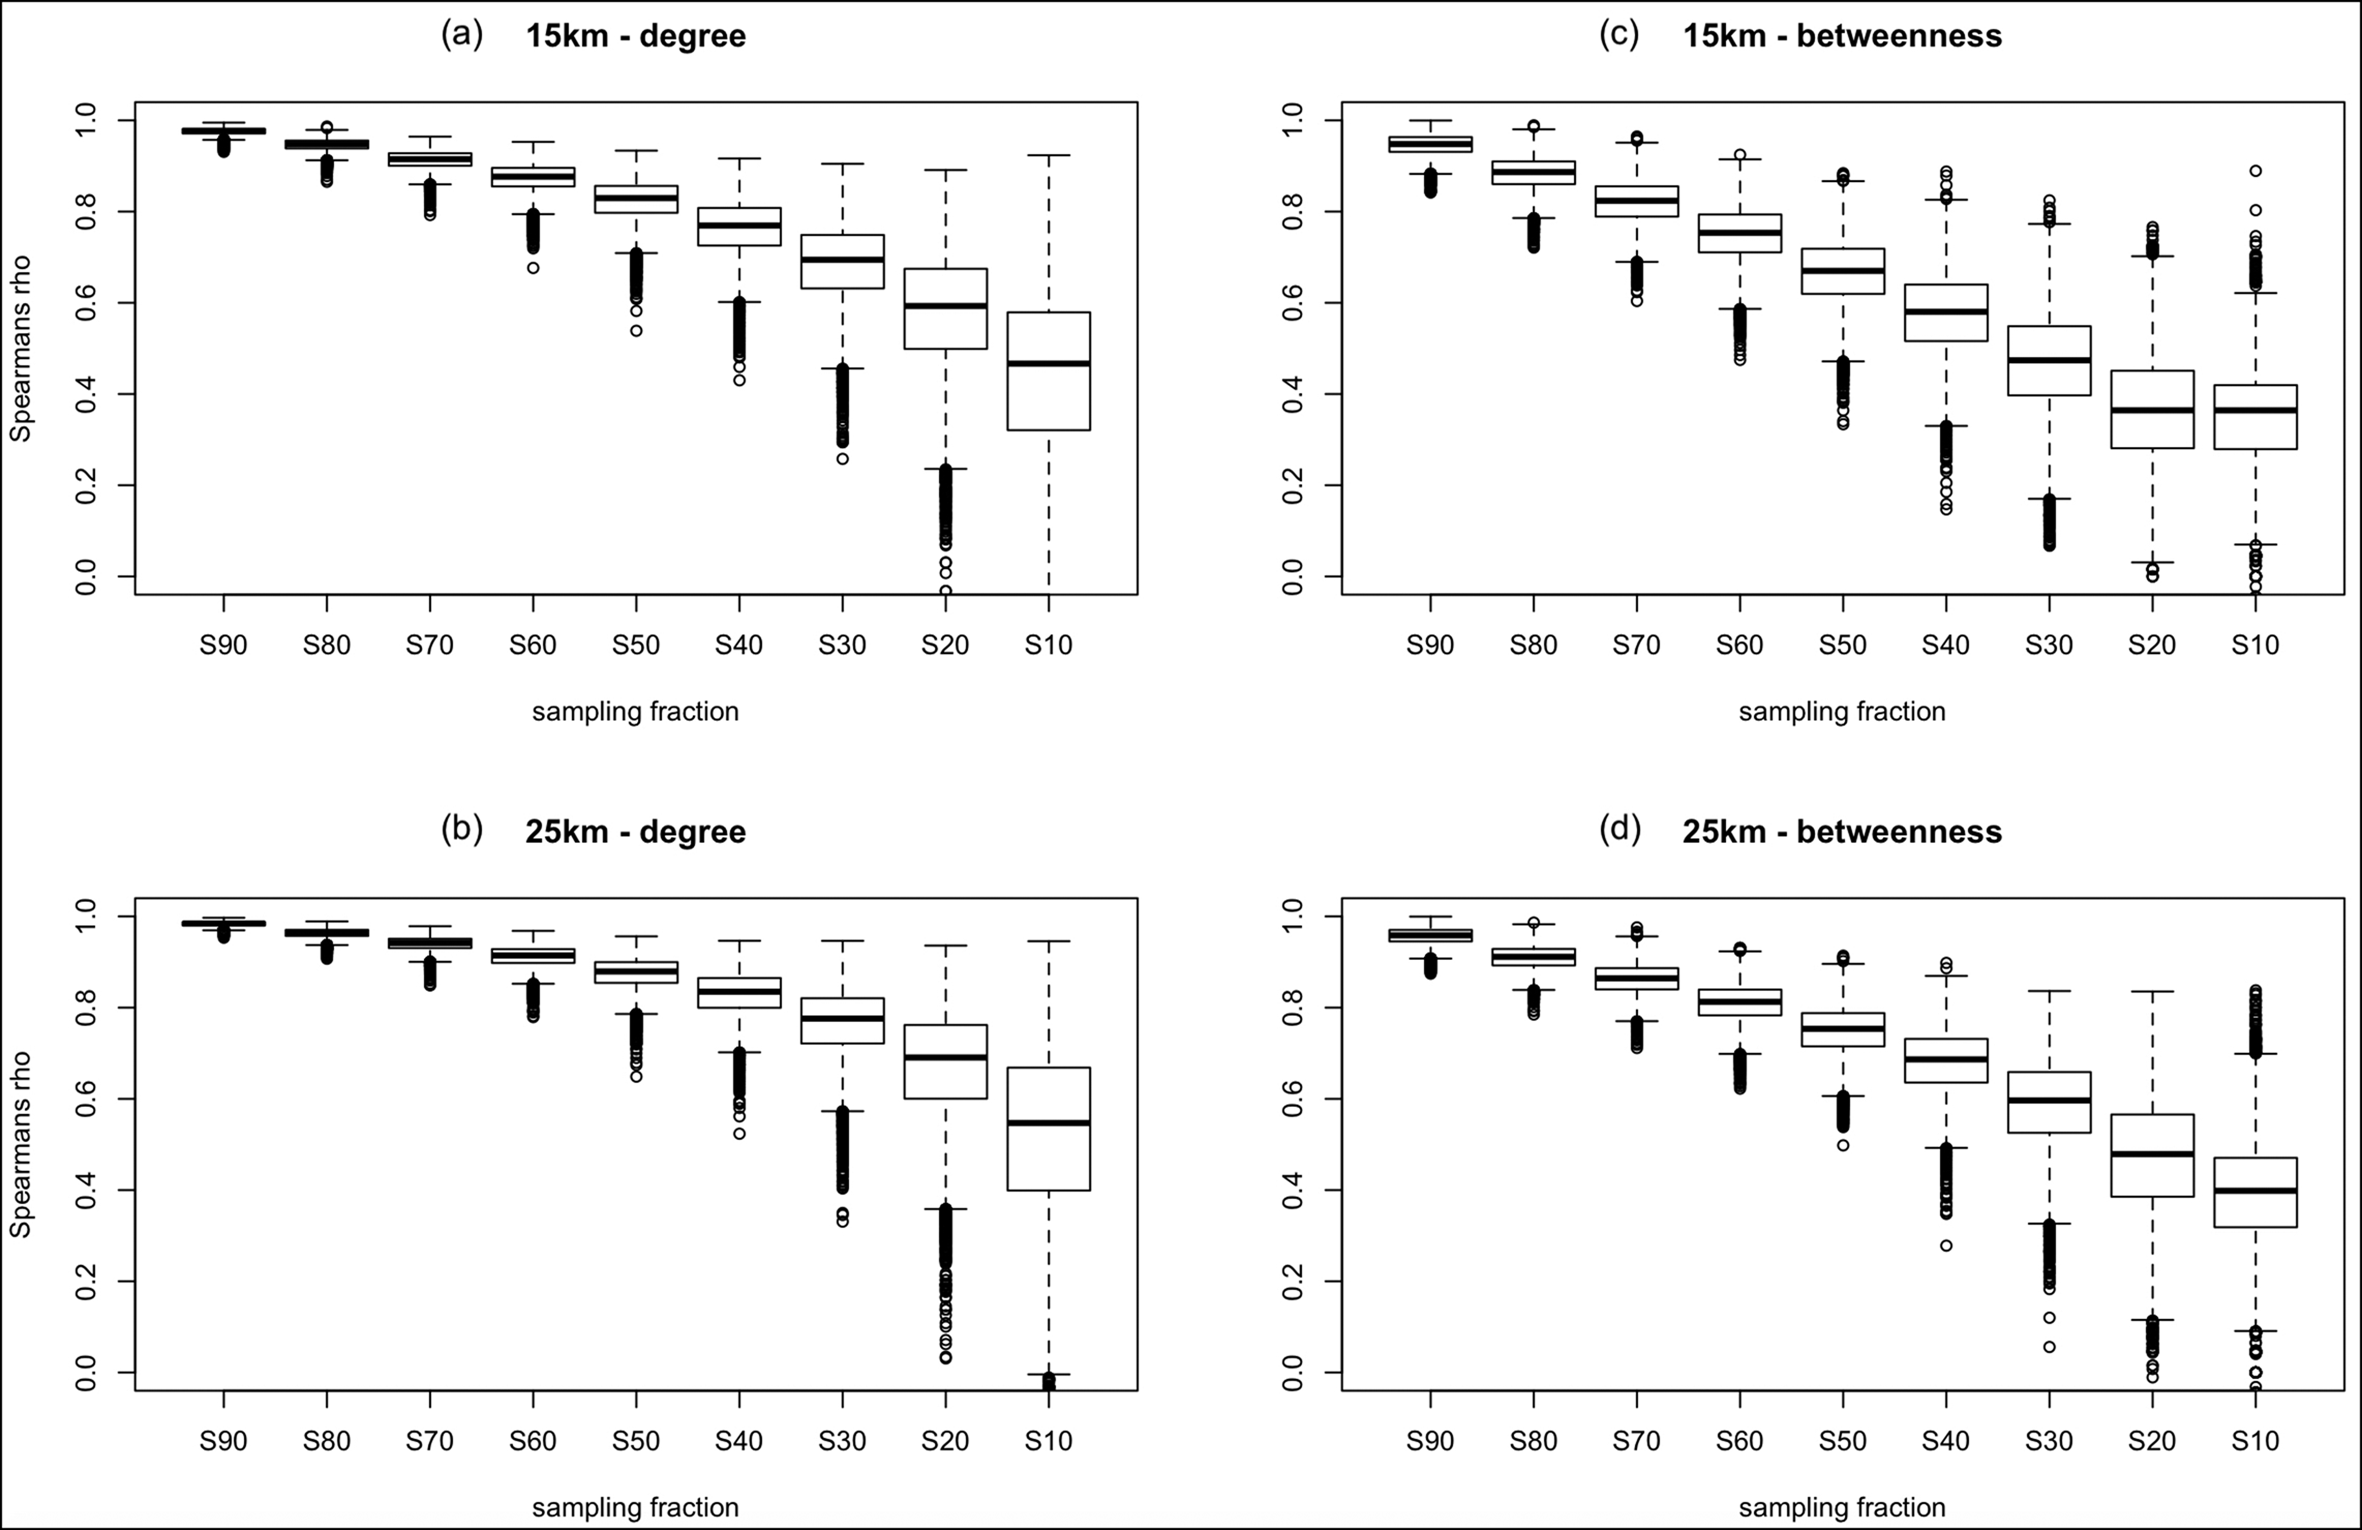
How robust are the results if we only consider fractions of the network in light of the chronological uncertainty of the strongholds? We started with the assumption that all strongholds were contemporaneous and could have functioned together in a single visual-signalling network. The almost complete absence of dating evidence, however, requires evaluation of this assumption using a statistical sensitivity analysis. We therefore used Costenbader and Valente's (Reference Costenbader and Valente2003) approach—as implemented in R by Peeples (Reference Peeples2017)—to identify the extent of changes in the degree and betweenness results as a consequence of removing a proportion of nodes and the links related to them (10 000 iterations per ten per cent subsampling fraction). This allows us to answer how much would degree and betweenness results change if only 90, 80, 70 per cent etc. of all nodes were contemporaneous. The boxplots in Figure 9a–d reveal that the betweenness (c–d) results are very robust if 50 per cent or more of strongholds are contemporaneous, that the degree results are robust at as low as 30 per cent contemporaneity (Figure 9a–b) , and that the results for the 25km network (Figure 9b & d) are more robust than those for the 15km network (Figure 9a & c).
Results of statistical sensitivity analysis for the 15 (top) and 25km (bottom) networks, showing degree (number of lines of sight per site) results to be particularly robust up to 70 per cent node removal and betweenness centrality up to 50–60 per cent node removal (figure by the authors).

Discussion
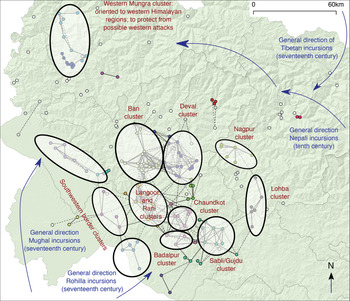
The new survey data, the computational visibility and network analyses, combined with the examination of the regions’ archaeological record (Rawat Reference Rawat2017), allow us to propose a new theory for the socio-political structure of medieval Garhwal Himalaya (summarised in Figure 10). Up to the fifteenth century AD, the fortification phenomenon was structured as local clusters (representing either mandalas or later competing chiefdoms) that were intervisible at short distances, with one or a few major forts in each cluster. The ability of the strongholds across the entire region to function as an integrated visual communication system facilitated its political integration in the fifteenth century under King Ajaypal. Clusters of strongholds in the northern, eastern and southern border regions served to relay information, such as enemy incursions, into the political heartland of the kingdom, which we hypothesise to be represented by the Chaundkot cluster. The western part of the study region, however, was oriented more towards Western Himalayan regions, and we therefore hypothesise that it did not form part of the fifteenth-century unified kingdom. In this section, we discuss how our results support different aspects of this theory.
A visual summary of our new theory about the socio-political structuring of the medieval fortification phenomenon in Garhwal Himalaya. Full edges and node colour represent 15km communities to highlight hypothesised mandalas or chiefdoms; dashed edges represent 25km visibility to highlight the hypothesised integrated visual-signalling network (figure by the authors).

Our results show the plausibility of the theory of an early medieval partial visual-signalling network at distances of up to 15km, or a fifteenth-century integrated visual-signalling network at distances up to 25km. The 15km network represents local clusters and chains of intervisible strongholds along all borders of the study area. Crucially, the local networks of the northern, eastern and southern borders of the study area became integrated with the densely connected central area at 25km visibility. In this case, the evidence suggests a robust and integrated visual-signalling network, in which information from the border strongholds could be effectively transmitted to the vast majority of sites.
The western part of the study area provides an exception to this integrated picture. This western borderland region of Garhwal Himalaya shares many more similarities in socio-cultural traditions and practices with the eastern part of Himachal Pradesh as compared to other regions of Garhwal (Saklani Reference Saklani2007). We do not know how the western Garhwal fortification cluster was connected with the main Chaundkot cluster (future survey efforts would help to clarify this relationship); the latter played a vital socio-political role in the medieval polity of this region.
The case for the exceptional role of Chaundkot Fort is particularly striking given its visual prominence as revealed through archaeological exploration and via our computational analyses (Rawat Reference Rawat2017). Three arguments support our theory that Chaundkot Fort was one of the most important political medieval centres of the region (after Chandpur Fort; Figure 1a):
1) Spread over more than 45ha, the architectural features of Chaundkot Fort suggest that it must have been built and occupied by the nobility who ruled this region.
2) Folklore suggests that a temple dedicated to Lord Shiva was built around the seventeenth century to symbolise the power of the medieval chieftain of this region. Indeed, a noticeable aspect of the fortification phenomenon observed during our survey was that the forts were transformed into an on-site temple (in situ transformation), or a temple was raised near the location of the fort (ex situ transformation). There are many examples of both types of transformation (e.g. Langoor, Ban, Badalpur and Dasholi) in Garhwal Himalaya.
3) Chaundkot Fort was built in a protected central location (for centrality scores, see Table S1), being surrounded in all directions by other clusters of strongholds (Figure 10). While these clusters could have served a defensive purpose, they certainly place Chaundkot as central to the region's visual-signalling means of communication.
Positioned on the eastern border of Garhwal, Lohba Fort offers another intriguing case study (Figure 10). In the 25km network, this fort becomes an important visual bridge between a small component on the north-eastern periphery and the largest central component (for betweenness centrality, see Table S1). Lohba Fort and its satellite fortalices enable effective visual signalling along much of the northern and eastern borders of the study area. Although the 25km network is robust, with many alternative signalling paths in the event that some paths were compromised (high count of alternating-2-path; Table 2), this is not the case for the connection between the Lohba and Nagpur clusters. Thus, a weaker point in the system is revealed.
But did those strongholds interpreted as ‘major’ forts play more important roles as mediators or hubs than the smaller fortalices? Some strongholds seem to support this theory (e.g. Badalpur, Sabli, Chaundkot, Lohba, Nagpur and Ban 1), being part of intervisibility chains (2-path O1au; Table 2). The fortalices, however, tend to be equally well connected in clusters around the major forts (triangle-1U; Table 2), and the latter do not have exceptionally high centrality and degree scores compared with the fortalices (Figures 5–6). In short, major forts formed an integral but equal part of dense local networks.
A crucial limitation to this study is the almost complete absence of chronological control, due to the extremely limited archaeological and historical research devoted to these strongholds. We cannot currently confirm whether all or even most of the strongholds were contemporaneous and could have functioned in the manner described above. Our statistical sensitivity analysis, however, confirms that some of our key network science results are reliable if we assume that only 50 per cent (betweenness centrality) or even as little as 30 per cent (degree) of all strongholds were contemporaneous (Figure 9).
Conclusions
The existence of the fortification phenomenon in medieval Garhwal Himalaya has long been recognised, both historically and in local folklore, yet very little is known about the locations, distribution and roles of the hundreds of forts in this mountainous region. Here, we have presented a new catalogue of 193 strongholds, more than tripling the previously known number of sites. This has revealed the regional ubiquity of the fortification phenomenon and further emphasised the distinctive locations that these sites occupy.
The forts’ prominent locations suggest that visual signalling may have been a key aspect of the fortification phenomenon. We therefore used computational visibility and network analyses to explore two hypotheses: (1) that local visual-signalling networks existed that reflect either eighth- to twelfth-century mandalas in the Katyuri kingdom, or eleventh- to fifteenth-century independent chiefdoms, with ‘major’ forts as their focal points; and (2) that an integrated visual-signalling network or supra-network was facilitated only after all of the major centres of power (forts) were brought under the rule of King Ajaypal around the fifteenth century AD.
Our visibility and network analysis results show that both hypotheses are plausible at distances of up to 15 and 25km respectively, at which fire, light and smoke signals would be visible. Those sites interpreted as ‘major’ forts, however, do not seem to have served as focal points in local visual-signalling networks, but rather functioned in a similar way to the smaller fortalices. These computational methods have great potential for studying hypothetical visual-signalling networks in other archaeological contexts—phenomena that are rarely formally tested. We have provided an integrated approach that can assess the plausibility of such theories. Moreover, our work highlights the need for statistical analysis of the sensitivity of (network and other) formal results in light of data uncertainty—a rare practice in archaeology. This study shows that even in a case of high data uncertainty, the extent to which we can rely on our formal results can still be assessed, providing invaluable insights for any archaeological interpretative effort.
Our computational analyses have allowed us to formulate a new theory concerning the socio-political structuring of strongholds in the Gahrwal region. We identified clusters of forts connected by efficient, local, short-distance visual-signalling networks, which we believe could represent either mandalas in the Katyuri kingdom (eighth to twelfth centuries) or later, largely independent chiefdoms (Figure 10). The ability of these clusters to function as an integrated communication system at longer distances, or as a supra-network across the whole of Garhwal Himalaya, may have facilitated the fifteenth-century unification of the region under King Ajaypal, and was key to maintaining the kingdom as an integrated political unit. Such a supra-network would have had an important bearing on the political history and identity of this region as ‘Garhwal’. It is quite possible, however, that even after the fifteenth-century consolidation of these forts and the region, the small principalities with their forts and fortalices could have continued in existence until the early nineteenth century. Indeed, the historical record shows their continued use until the start of colonial rule in Garhwal (Khanduri Reference Khanduri1997). At the heart of Garhwal lies the Chaundkot cluster of strongholds, which we hypothesise to have been one of the most important political centres of the unified kingdom. Here, information could be gathered from surrounding clusters in all directions, and particularly those from which Nepalese, Tibetan and Mughal incursions could be expected (Figure 10).
To explore and test this theory further requires significant future investment in archaeological excavations at key sites, which, in turn, will open up new research avenues, including the chronological details of the occupation of the forts and the impact on hypothesised visual or acoustic signalling networks, and the relationships of control of individual forts over their more immediate hinterlands. We particularly wish to emphasise the great research potential of extending network studies into soundscapes (Alter Reference Alter2014) by exploring signalling in the region using sound beats (Purohit Reference Purohit2001). In these ways, we hope that this article will stimulate much-needed further archaeological research in Garhwal Himalaya.
Acknowledgements
Thanks are due to R.C. Bhatt, Rajpal Singh Negi, Satish Chandra Singh and Subhash Chandra of the Department of History and Archaeology, Hemvati Nandan Bahuguna Garhwal University, for their valuable information on the history of the region. The first author is also thankful to M.M. Kimothi (former Director of Uttarakhand Space Application Centre, Uttarakhand) for providing basic training on GIS and spatial data analysis. Our heartfelt thanks to Manmohan Rawat, Saurabh Purohit and Govind Negi for providing help in preparing base maps. We are grateful to all the interviewees. We are also thankful to the anonymous reviewers for their constructive comments.
Funding statement
This work forms part of Nagendra Singh Rawat's PhD research funded by the University Grants Commission, Government of India. His study was further developed with a formal network study by Tom Brughmans during an Early Career Fellowship awarded by The Leverhulme Trust (ECF-2016-197).
Supplementary material
To view supplementary material for this article, please visit https://doi.org/10.15184/aqy.2021.4