I. INTRODUCTION
Thermoelectric materials can be used to convert thermal energy to electrical energy by exposing one side of the thermoelectric material to high temperature and can, therefore, potentially be a means to harvest heat energy, the greatest source of energy loss. There is also a converse effect that can be used for solid-state refrigeration. In the case of energy harvesting, the thermal gradient produces a difference in electric potential and causes electricity to flow across the thermoelectric material. This phenomenon, known as the Seebeck effect, facilitates thermoelectric conversion without the use of rotating equipment or gas combustion. From a societal perspective, developing high-performance thermoelectric would provide a method to have more efficient use of energy; for example, in automobiles 70% of energy is lost to thermal energy. The thermoelectric conversion efficiency of a particular thermoelectric material or device is defined by the figure of merit (ZT), expressed as ZT = TS 2σ/k, where S is the Seebeck coefficient, T is the temperature, σ is the electrical conductivity, and k is the thermal conductivity.Reference Goldsmid1 The power factor (PF), expressed as PF = S 2σ, is a function of carrier concentration, mobility, and density of state, and is optimized through aliovalent doping or nonstoichiometry to maximize the ZT of the thermoelectric material.
Although there are many benefits of oxide thermoelectrics, such as low cost, nontoxic raw materials, high temperature stability, etc., semiconductor alloys, such as (Bi,Sb)2(Te,Se)3, SiGe, PbTe, and related semiconductors, have been studied intensively. However, there are concerns on sustainability with these materials, as Te is a relatively rare element. Oxide thermoelectrics have been of great interest since the discovery of high thermoelectric power factors in p-type NaCo2O4 and its Ca-doped derivatives, which exhibit ZT~0.75 parallel to the layers in the crystal structure.Reference Terasaki, Sasago and Uchinokura2 The benefits of low symmetry structure in n-type have been also shown in the tungsten-bronze structured ferroelectric (Sr,Ba)Nb2O6 (SBN) single crystal.Reference Lee, Wilke, Trolier-McKinstry, Zhang and Randall3
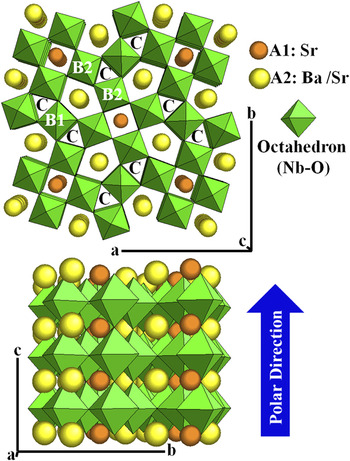
The uniaxial ferroelectric SBN showed strong crystal anisotropic characteristics; the thermoelectric power factor of the c-axis direction was much higher than that of a- and b-axis directions. The crystal structure and crystal chemistry have been investigated in stoichiometric materials because of the ferroelectric properties, particularly for the electro-optic and, more recently, piezoelectric properties.Reference Duran, Trolier-McKinstry and Messing4, Reference Duran, Trolier-McKinstry and Messing5Figure 1 shows the basic structure where there is essentially a one-dimensional interconnection between the perovskite subunits, and the system has previously been noted to have a low thermal conductivity.Reference Lee, Wilke, Trolier-McKinstry, Zhang and Randall3, 9 The site occupancy of the A1 and A2 sites depends on alkaline earth and alkali mixtures. So if, for example, we only have alkaline earth cations, e.g., Ca+2, Sr+2, and Ba+2, both sites (A1 and A2) are occupied. In the case of alkali cations mixed with alkaline earth, A1 will be predominantly occupied with the alkali cations, and A2 will be contained alkaline earth cations. The octahedral has two B sites, B1 and B2, with the B1 having two Nb, and B2 eight per unit cell. The C site is small, and only smaller cations like Li+ occupy this site. This material also meets with the trend, such as complex structure, nanostructure, lower dimensionality, and intrinsic localized modes with low thermal conductivity, to enhance the thermoelectric figure of merit.Reference Ohta10–Reference Snyder and Toberer13
Crystal structure for (Sr,Ba)Nb2O6 showing the connectivity of the NbO6 octahedra. A1 site: Sr, A2: Ba or Sr, and C site: vacant site (after Jamieson et al.,Reference Jamieson, Abrahams and Bernstel6 Bursill and Lin,Reference Bursill and Lin7 and Woike et al.Reference Woike, Petricek, Dusek, Hansen, Fertey, Lecomte, Arakcheeva, Chapuis, Imlau and Pankrath8).

II. EXPERIMENTAL PROCEDURE
The textured Sr0.61Ba0.39Nb2O6 (SBN) polycrystalline ceramics were fabricated by reactive sintering of matrix powders SrNb2O6 (SN) and BaNb2O6 (BN) with rodlike Ba2NaNb5O15 (BNN) template particles, which were synthesized by reacting NaCl salt with BaNb2O6 (BN) powder (see Refs. 4 and 14, and references therein). BNN templates have a diameter of 2–6 μm and a length of 10–40 μm, as estimated from optical microscopy. Tape casting was performed on a glass substrate at a casting speed of 10 cm/s. The sheets were cut parallel (B and D samples) and perpendicular (C sample) to the casting direction from the green compacts. Samples were burned out slowly at 600 °C for 7 h at 0.5 °C/min and then isostatically pressed at 250 MPa. Finally, the specimens were sintered at 1400 °C for 4 h in air.
To introduce a certain amount of carrier concentration, the diced specimens were reduced by annealing at 1300 °C for 30 h in low oxygen partial pressures (pO2) of ~10−12–10−14 atm, at pO2 ~10−14 atm for samples A, B, and C, and pO2 ~10−12 atm for sample D, using gas mixtures of N2–H2. The oxygen partial pressure was measured with a Y-stabilized zirconia oxygen sensor (DS Probe, Australian Oxytrol Systems Pty. Ltd., Victoria, Australia). The Seebeck coefficients (= thermopower) were measured in an MMR Technologies SB-100 Programmable Seebeck Controller (MountainView, CA). Ohmic contacts were made by sputtering a 10-nm layer of Ti overcoated with 100 nm of Pt. Lead wires were attached with silver epoxy (Epo-tek H20E, Epoxy Technology, Billerica, MA). The electrical conductivity versus temperature was measured with a HP 4284 LCR meter (Santa Clara, CA) at 20 Hz from 150 to 520 K using a four-point method. The randomly oriented polycrystalline SBN materials were processed using conventional solid-state methods, using starting powders with purities above 99.9%. The densities of all samples were achieved above 95% of theoretical density.
III. RESULTS AND DISCUSSION
The high temperature reduction annealing results in the following reactionReference Lee, Wilke, Trolier-McKinstry, Zhang and Randall3:

where the charge carrier is dominated by electrons (n-type), in which the conduction mechanism changes with annealing conditions and measurement temperatures; it was found that a polaron hopping conduction is dominant at high temperatures and with a high reduction degree in reduced SBN single crystals.Reference Lee, Wilke, Trolier-McKinstry, Zhang and Randall3 These reduction reactions can increase the [Nb4+]/[Nb5+] ratio to be a higher electrical conductor and create a Nb4+O2 as a second phase, a small amount of which was detected in the samples annealed at 1300 °C at below pO2~10−14 atm (not shown in this work).
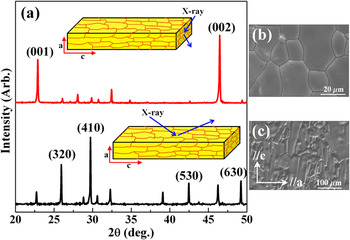
Figure 2 shows the diffraction data and scanning electron microscopy (SEM) micrographs of the randomly oriented polycrystalline SBN and textured SBN cut parallel to the c-axis direction. The x-ray diffraction (XRD) patterns show that the grains of a textured SBN were highly oriented in the c-axis direction, with relatively enhanced intensities for the (001) and (002) peaks. On the basis of the XRD analysis, the texture fraction of the final specimens was calculated to be in the range of 82–91% via the Lotgering factor.Reference Lotgering15 The grain size of randomly oriented polycrystalline SBN was ~40 μm with equiaxed morphology, while the lengthwise (c-axis) grain dimension of the textured SBN was much larger, over 100 μm, than in the randomly oriented and a-axis case. The a-axis microstructure has grain sizes in the direction of the thermal gradient close to that of randomly oriented polycrystalline SBN.
(a) XRD patterns for textured SBN showing the crystallinity and orientation, and SEM images for (b) randomly oriented SBN and (c) textured SBN ceramics oriented parallel to the c axis.

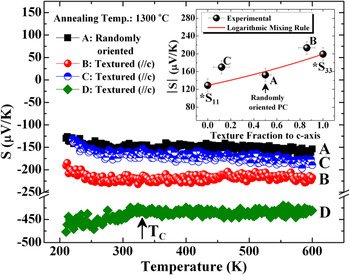
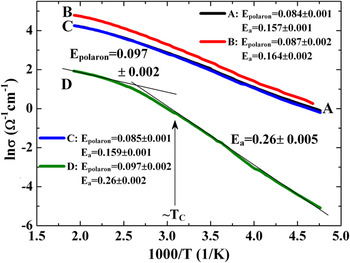
Figure 3 shows the Seebeck coefficients as a function of temperature for randomly oriented SBN and textured SBN; all textured SBN were grown in the c-axis direction, and the samples B and D were measured parallel to the growth direction (//c) [see Fig. 2(c)]; sample C was measured perpendicular to the growth direction (⊥c) [see Fig. 2(c)]. Two annealing conditions were used: B (annealed at 1300 °C in pO2~10−14 atm) and D (annealed at 1300 °C in pO2~10−12 atm). It can be seen in sample D that there is a ferroelectric–thermoelectric anomaly, as was previously reported from our group in the nonstoichiometric SBN single crystalReference Lee, Wilke, Trolier-McKinstry, Zhang and Randall3; both samples show an anomaly at around 330 K, consistent with the 4mm–4/mmm phase transition occurring near 340 K.Reference Ballman and Brown16 Depending on the degree of reduction, there is either an increase or a decrease in the magnitude of the Seebeck coefficient at lower temperatures in the ferroelectric phase (4mm). This observation is consistent with the reduction degree dependence of ferroelectric–thermoelectric behavior for single crystal SBNReference Lee, Wilke, Trolier-McKinstry, Zhang and Randall3 and reduced perovskite BaTiO3–δ.Reference Lee, Yang, Wilke, Trolier-McKinstry and Randall17, Reference Kolodiazhnyi18 However, as shown in Fig. 4, the electrical conductivity anomaly at the phase transition temperature of the textured SBN differs from a steplike anomaly of the reduced BaTiO3–δ case, which has the first-order phase transition (cubic-tetragonal-orthorhombic transition). In contrast, SBN has a tetragonal (4/mmm)-tetragonal (4mm) phase transition showing a relaxorlike phase transition. We, therefore, anticipate that the electrical conductivity is as not sensitive to the tetragonal–tetragonal relaxorlike phase transition. Nevertheless, as shown in Fig. 4, one can see the slope change around the phase transition, showing a conduction mechanism change from semiconducting to polaron hopping behavior, also based on the temperature invariant Seebeck coefficient. At high temperature above T C, the activation energies for polaron hopping (E polaron) were estimated from a plot of ln σ versus 1/T (see Fig. 4): 0.084 ± 0.001 eV (sample A), 0.085 ± 0.001 (sample C), 0.087 ± 0.002 (sample B), and 0.097 ± 0.002 (sample D). It is noted that the activation energy for polaron hopping at a lower reduction degree (sample D) is higher than that at a higher reduction degree (sample B), as would be expected by the hopping site concentration difference with a reduction degree. At low temperatures below T C, the activation energies for conduction (E a), 0.157 ± 0.001 eV (sample A), 0.159 ± 0.001 eV (sample C), 0.164 ± 0.002 eV (sample B), and 0.26 ± 0.005 eV (sample D) is much higher than the E polaron. It is anticipated that the high activation energy of sample D is corresponding to the positive slope of the Seebeck coefficient below T C, indicating a strong electron trapping by the phase transition.Reference Lee, Yang, Wilke, Trolier-McKinstry and Randall17
Seebeck coefficient (S) as a function of temperature. The samples were annealed at 1300 °C in pO2~10−14 atm (A, B, and C) and pO2~10−12 atm (D). The textured SBN ceramics (B, C, and D) were grown in c-axis direction, and data B and D were measured parallel to the grown direction (//c); data C was measured perpendicular to the grown direction (⊥c). The inset is the Seebeck coefficient as a function of texture fraction to c-axis; the solid line denotes a fitting curve by logarithmic mixing rule, and the Seebeck coefficients were averaged from 350 to 550 K. *Data from Ref. 3.

Plot of lnσ versus 1000/T for samples A, B, C, and D.

In turn, above T C in the paraelectric phase, the conduction mechanism is dominated by a polaron hopping conduction, as can be also modeled with a temperature invariant thermopower, S = −(k B/e)ln[(2-c)/c],Reference Lee, Yang, Wilke, Trolier-McKinstry and Randall17, Reference Heikes and Ure19, Reference Chaikin and Beni20 where the hopping site is presumably Nb4+/Nb5+ (c = [Nb4+]/[Nb5+]), which is originated by the reduction process, Eq. (1). The magnitude of thermopower in c-axis textured SBN is higher than that of randomly oriented polycrystalline SBN, which is consistent with the crystal anisotropy of single crystal SBN, uniaxial ferroelectric structure. For the anisotropic materials, the thermopower (S ij) is a second rank tensor, Ei = Sij(dT/dzj), Ei is the electric field, (dT/dzj) is the temperature gradient, and the Seebeck coefficients of 4mm and 4/mmm crystallographic point groups are expressed byReference Newnham21
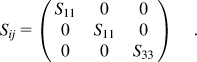
A similar matrix representation can be applied to σij and kij. It should be noted that property averaging of σij and kij is more complex, as there are grain boundary Schottky barriers and phonon scattering mechanism; therefore, these properties are not intrinsic. However, Seebeck coefficients are typically not sensitive to grain boundaries, and therefore can be more readily compared to single crystal values with different degrees of texture. Therefore, we here approximate the average Seebeck coefficients with a modified logarithmic mixing rule:

where  is the average Seebeck coefficient, and f is the texture fraction to the c-axis. As shown in Fig. 3 (inset), the average Seebeck coefficient of randomly oriented polycrystalline SBN and textured SBN lie reasonably on the fitting line between S 11 and S 33 values from single crystal SBN. The slight deviation from the fitting may result from the impurity effects by templates and/or stoichiometric difference relative to the single crystal SBN.
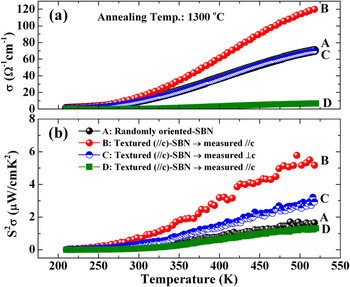
With the polaron hopping conduction mechanism, the Seebeck coefficient is independent on temperature, while the electrical conductivity, including the carrier mobility term, increased with increasing temperature, as shown in Fig. 5(a). The textured SBN grown in the c-axis direction, sample B, shows a higher electrical conductivity than in the randomly oriented polycrystalline SBN (sample A) and sample C measured perpendicular to the c axis. It is anticipated that the higher electrical conductivity results from the crystal anisotropy and also a decrease of the number of grain boundaries parallel to measurement direction. Large crystal anisotropy of the electrical conductivity was already shown with single crystal SBN, with the higher electrical conductivity in the c-axis direction. In comparing samples A and C, the electrical conductivity of samples A and C is almost the same, indicating that grain boundaries limit the electronic conductivity in SBN. It is noted that the a-axis grain size of sample C is very close to the randomly oriented grain size of sample A [see Figs. 2(b) and 2(c)]. Ideally, grain orientation, large grains, and compositional development are all required in terms of microstructural optimization of the thermoelectric SBN ceramics.
(a) Electrical conductivity (σ) and (b) the thermoelectric power factor (S 2σ) as a function of temperature for samples A, B, C, and D.

As shown in single crystal SBN, both the electrical conductivity and the magnitude of thermopower in textured polycrystalline SBN oriented c-axis were higher than randomly oriented polycryatalline SBN and the cases measured perpendicular to the growth direction (⊥c-axis). Consequently, as shown in Fig. 5(b), the thermoelectric power factor was significantly improved not only by the decrease of the number of grain boundaries, but also by orienting the grain to the c-axis.
IV. CONCLUSIONS
In summary, it was proven that the crystal anisotropic effect of tungsten bronze structured ferroelectric SBN single crystal is applicable to textured polycrystalline SBN oriented to the c-axis direction. The c-axis-oriented polycrystalline SBN showed higher electrical conductivity and higher thermopower than randomly oriented polycrystalline SBN and the case measured perpendicular to the c-axis growth direction, showing strong anisotropic behavior. The conduction mechanism is only dependent on temperature and reduction degree. Above 4mm–4/mmm phase transition temperature, the carrier transport mechanism changes to a polaron hopping conduction, which is not anisotropic; all cases of oriented and randomly oriented polycrystalline SBN have a temperature independent thermopower. However, the magnitude of the Seebeck coefficient is dependent on the crystal anisotropy. The activation energy for polaron hopping (E polaron = 0.084–0.097 eV) varied with the reduction degree. With higher thermopower and electrical conductivity of the c-axis-oriented texture SBN, we obtained prominently improved thermoelectric power factors. The larger grain growth in the c-axis with dopants and high temperature measurement should be studied to enhance the thermoelectric power factor and make this promising n-type thermoelectric oxide in bulk forms that are suitable for implementation in real devices.
ACKNOWLEDGMENTS
This study is based on work supported by the National Science Foundation, as part of the Center for Dielectric Studies under Grant No. 0628817. The authors wish to acknowledge the Center for Dielectric Studies (CDS) membership and National Science Foundation Industry/University Cooperative Research Centers (NSF I/UCRC) program for support on this topic.