




No CrossRef data available.
Article contents
Programmed cell death in a human intestinal parasite, Blastocystis hominis
Published online by Cambridge University Press: 28 November 2001
Abstract
Although programmed cell death (PCD) has been associated with multicellular organisms, there have been more reports of its presence in some protozoans. Our study shows the existence of PCD in an intestinal protozoan, Blastocystis hominis. Light and electron microscopy, biochemical and flow cytometry studies showed apoptosis-like death in B. hominis cells exposed to a cytotoxic monoclonal antibody (MAb 1D5). B. hominis cells displayed key morphological and biochemical features of apoptosis, namely, nuclear condensation and in situ fragmentation, reduced cytoplasmic volume, some externalization of phosphatidylserine and maintenance of plasma membrane integrity. No oligonucleosomal DNA laddering was observed in gel electrophoresis. This study supports earlier observations that the cellular machinery that is required to carry out PCD may have existed before the advent of multicellularity. Our study also ascribes a novel function for the B. hominis central vacuole in apoptosis; it acts as a repository where apoptotic bodies are stored before being released into the extracellular space.
Information
- Type
- Research Article
- Information
- Copyright
- © 2002 Cambridge University Press
INTRODUCTION
Programmed cell death (PCD) has been found to be an intrinsic part of the development of all invertebrate and vertebrate multicellular organisms studied so far, including nematodes, insects, amphibians and mammals (Ellis, Yuan & Horvitz, 1991; Raff, 1992; Vaux, 1993; Steller, 1995). Unnecessary, damaged, and potentially harmful cells must be deleted from surrounding healthy ones to ensure structural and functional homeostasis. Multicellular animals have mechanisms for killing their own cells (Vaux & Strasser, 1996). Classical examples of PCD or apoptosis include the cell deletion in regressing interdigital webs (Kerr et al. 1987) as well as in development of the retina (Penfold & Provis, 1986). Although different cell types do not necessarily display all the hallmarks of apoptosis, there are, however, a number of strikingly similar features. These include shrinkage of the cell, preservation of membrane integrity, chromatin condensation and nuclear fragmentation, which allows cells undergoing PCD to be easily distinguished from healthy and necrotic cells. Necrosis is characterized by mitochondrial swelling, nuclear flocculation and the loss of plasma membrane integrity resulting in uncontrolled cell lysis.
Time-lapse studies showed that changes in certain cells undergoing apoptosis occurred within 1 to 3 h post-induction (Wyllie, 1992) whereas necrosis occurred in a matter of seconds (Collins et al. 1997). PCD was thought to be an exclusive feature of multicellular organisms but has also been observed in protozoans like Dictyostelium discoideum (Cornillon et al. 1994), Trypanosoma cruzi (Ameisen et al. 1995), Leishmania (Leishmania) amazonensis (Moreira et al. 1996), T. brucei rhodesiense (Welburn et al. 1996) and Plasmodium falciparum (Picot et al. 1997).
The present study describes PCD features in the unicellular eukaryotic human intestinal protozoan parasite, Blastocystis hominis, after induction with a surface reactive cytotoxic mAb, 1D5. Our earlier studies (Tan et al. 1997) had shown that this antibody had a cytotoxic effect on B. hominis and was able to reduce the number of colonies in soft agar significantly. Monoclonal antibody 1D5 binds to the protein moiety of a 30.5 kDa glycoprotein found on the surface membrane of the organism. Reaction with mAb 1D5 also produced morphologically smaller B. hominis cells (Tan et al. 1997). These effects led us to consider the possibility that mAb 1D5 could be inducing apoptosis in these parasites.
MATERIALS AND METHODS
Parasite
Blastocystis hominis isolate B was obtained from a local patient and maintained axenically in Iscove's modified Dulbecco's medium (IMDM) containing 10% horse serum (Ho et al. 1993). Cells were grown anaerobically (Concept Plus Anaerobic Workstation, Ruskinn Technology, UK) at 37 °C.
Induction of PCD
Monoclonal antibody 1D5, an IgM antibody (Tan et al. 1996), was used to induce PCD in B. hominis. Cells were inoculated into pre-reduced hybridoma supernatant (kept for 48 h in an anaerobic chamber) containing mAb 1D5 to give a final concentration of 2×10⁶ cells/ml. Three controls were included in the experiments. (i) Cells exposed to an unrelated IgM, mAb 5. Monoclonal antibody 5, raised against a β-bungarotoxin (snake, Bungarus multicinctus), was used as a negative control to show that mAb 1D5 was inducing PCD and not other components in the media in which mAb 1D5 and mAb 5 were cultured. (ii) Cells grown in normal culture conditions (IMDM with 10% horse serum). (iii) Necrotic cell control of B. hominis cells incubated with 0.1% sodium azide and harvested 24 h post-treatment. Cells inoculated into IMDM with 10% horse serum, mAb 1D5 and mAb 5 were harvested at 3, 24 and 48 h for analysis.
Flow cytometry
Cells were harvested as described above and washed 3 times in PBS, pH 7.4. B. hominis cells were viewed under the light microscope and analysed by a flow cytometer (Coulter Epics Elite ESP, USA) using an argon-ion laser tuned to 488 nm. Forward and side-light scatter was detected using a 610 nm band-pass filter and displayed using WinMDI 2.7 software program. Based on dot plots of side scatter versus forward scatter, a region (R1) was defined to enclose parasites while excluding debris and cellular clumps.
Membrane integrity assay
Cells were washed in Dulbecco's phosphate-buffered saline (DPBS) and suspended in 1 ml of the same buffer. Then 100 μl of fluorescein diacetate (FDA) were added to B. hominis after dilution in DPBS (4 μl FDA/ml of DPBS). After a 10 min incubation at 37 °C, propidium iodide was added and the cells incubated for a further 5 min at room temperature. Cells were analysed using fluorescence microscopy and flow cytometry. For fluorescence microscopy (Nikon, Microphot-FXA) at 450–490 nm, at least 100 cells were counted for green or red fluorescence at each time-point. Cell fluorescence was also analysed by the flow cytometer.
DNA gel electrophoresis
Cells were inoculated into the 3 different media to give a final concentration of 5×10⁶ cells/ml and harvested 3, 24 and 48 h later. An apoptotic DNA ladder kit (Boehringer Mannheim) was used to extract DNA from apoptosis-induced and uninduced cells according to the manufacturer's instructions. Apoptotic U937 cells (histiocytic lymphoma cells), included in the kit, were used as positive control. DNA was electrophoresed in 2% agarose gel at 100 V for 2 h, visualized by an UV transilluminator and the gels photographed with a Polaroid camera.
Detection of phosphatidylserine externalization (Annexin V/propidium iodide)
The technique was performed using an Annexin V/FITC kit (BenderMed Systems, USA) on 2×10⁶ cells/ml inoculated and harvested similarly from the 3 different media mentioned above. Cells were washed twice in 1 ml of PBS. Then 190 μl of calcium-containing binding buffer, 0.21 μg/ml FITC-Annexin V and 2.5 μg/ml propidium iodide were added sequentially. The samples were measured by flow cytometry for FITC/PI fluorescence. A region (M1) was defined to exclude background fluorescence by unstained cells. Stained parasites that fall within the M1 region were represented as a percentage of total cells analysed.
In situ nick-end labelling of internucleosomal cleavage DNA fragments
TdT-mediated dUTP-biotin nick-end labelling (TUNEL) was performed using ApoAlertTM DNA Fragmentation Assay kit (Clontech). A total of 2×10⁶ cells/ml were inoculated into the 3 different media and harvested as above. Cells were washed twice with 1 ml of PBS and fixed with 4% formaldehyde/PBS for 25 min at 4 °C. After 2 washes with PBS the pellet was resuspended in 5 ml of permeabilization solution (0.2% Triton X-100 in PBS) and incubated on ice for 5 min, after which 80 μl of equilibration buffer were added and the cells incubated at room temperature for 5 min. The cells were labelled by adding 50 μl of TUNEL mix followed by incubation for 60 min at 37 °C in a dark, humidified incubator. One ml of 20 mM EDTA was then added to terminate the tailing reaction. The samples were washed with PBS and the pellet resuspended in 250 μl of PBS prior to flow cytometry using an argon-ion laser tuned to 488 nm. Green fluorescence was detected using a 525 nm band-pass filter. A region (M1) was defined to exclude background fluorescence by unstained cells. Stained parasites that fall within the M1 region were represented as a percentage of total cells analysed.
Transmission electron microscopy
A total of 1×10⁷ cells were inoculated into 5 ml of the 3 different media mentioned above and harvested 24, 48 and 72 h after treatment. Cells were washed twice in 0.1 M sodium cacodylate buffer with 5% sucrose and fixed sequentially in each of the following fixatives: 1% glutaraldehyde in 0.5 M sodium cacodylate buffer, pH 7.2 for 3 h, followed by 2 washes in buffer, 2% osmium tetroxide in 0.1% potassium ferrocyanide solution for 1 h and then 2 washes in 0.5 M cacodylate buffer. The cells were then processed according to the procedure used by Moe et al. (1999) and examined with a Philips EM280S electron microscope.
Effect of necrotized cells on B. hominis cultures
Necrosis was achieved by prolonged incubation of B. hominis culture for 20 days. Viable cells were not seen by light microscopy by this time. Five ml of these cultures containing remnants of necrotized B. hominis cells were added to the following tubes: (i) 5 ml of IMDM with 10% horse serum plus 2×10⁷ B. hominis cells (3-day-old exponential phase culture); (ii) 5 ml of IMDM with 10% horse serum. A control tube, 10 ml of IMDM with 10% horse serum, was inoculated with a 3-day-old culture of 2×10⁷ B. hominis cells. The tubes were incubated in an anaerobic chamber for 72 h and intact cells were counted using a Neubauer haemocytometer.
RESULTS
Light microscopy and flow cytometry
Cell shrinkage due to compaction of organelles in the cytoplasm is an important morphological indication of apoptosis. Monoclonal antibody 1D5-treated B. hominis cells were examined by light microscopy and flow cytometry. Light microscopy revealed mAb 1D5-treated B. hominis cells with condensed cytoplasm and darkening of cells (Fig. 1B). B. hominis cells grown in normal culture conditions and those treated with mAb 5 displayed healthy morphology and growth (Fig. 1A). Flow cytometry showed significant reduction in cell size in mAb 1D5-treated parasites as evidenced by reduction in forward scatter (Fig. 1C). This reduction in cell size was seen in all mAb 1D5-treated cells from 3 h onwards. Untreated B. hominis cells and mAb 5-treated cells showed no marked change in cell size and granularity throughout the course of the incubation period (data not shown). Flow cytometry data showed 2 distinct population of cells. B. hominis cells exposed to 0.1% sodium azide displayed a reduction in cell size and granularity. The cell debris was responsible for the reduction in cell size and increase in the granularity (Fig. 1C).

Fig. 1. Effect of mAb 1D5 on Blastocystis hominis cell size and morphology by light microscopy (A and B) and flow cytometry (C). (A) Cells grown in normal culture conditions. (B) Cells exposed to mAb 1D5. Note cell shrinkage, condensed cytoplasm and darkening of cells after exposure to mAb 1D5. (C) Flow cytometry analysis of cell size and granularity. X and Y axes represent cell size and granularity respectively. X-mean and Y-mean quantify cell size and granularity respectively. Note 2 distinct populations of cells in flow cytometry. The population on the left could be due to dead cells and debris while those on the right could be undergoing PCD. From the X-mean, it can be deduced that mAb 1D5-treated cells undergo cell shrinkage.
Membrane integrity assay
Loss of cell viability is most often measured as loss of membrane integrity. This event maybe due to primary necrosis or secondary apoptosis. A short incubation with PI and FDA was used to demonstrate membrane integrity in B. hominis cells undergoing apoptosis. FDA, an uncharged molecule, enters the cells and is then cleaved by cytoplasmic enzymes. This cleavage of FDA results in green fluorescence. FDA then becomes charged and is unable to leave the cell. This stain thus labels cells with an intact plasma membrane. PI can only enter cells with an altered plasma membrane and then stains the nucleic acids giving red fluorescence.
To evaluate membrane integrity in mAb 1D5-treated cells, the parasites were visually scored for FDA and PI fluorescence by fluorescence microscopy. At least 100 cells were counted for each experiment (Fig. 2A–C). During the exposure to mAb 1D5, there was a gradual increase of PI-positive cells from 36 to 48% and a gradual decrease of FDA-positive cells from 64 to 52% (Fig. 2B). However, for cells exposed to mAb 5 (Fig. 2C) and those grown in normal culture media (Fig. 2A) FDA-positive cells increased markedly and PI-positive cells decreased by 48 h indicating normal growth. Membrane integrity of these parasites was quantified by flow cytometry (Fig. 2D). It was found that 75.4% of mAb 1D5-treated cells were FDA-positive at 3 h and 62.3% at 48 h. Cells grown in normal culture media showed 35.1% and 43.1% FDA-positive cells at 3 h and 48 h respectively. Cells exposed to mAb 5 showed 33.9% and 62.8% FDA-positive cells at 3 h and 48 h respectively. Flow cytometry data revealed a gradual increase in dying cells (cells which are both FDA- and PI-positive) due to mAb 1D5 treatment.

Fig. 2. For legend see opposite.
Fig. 2. Membrane integrity assay of Blastocystis hominis cells using FDA/PI staining by fluorescence microscopy (A–C) and flow cytometry (D). (A) Untreated cells. (B and C) Cells exposed to mAb 1D5 and mAb 5 respectively. Note gradual increase of PI uptake and gradual decrease of FDA uptake in mAb 1D5-treated cells. (D) X and Y axes represent FDA and PI staining respectively. Note decrease in FDA uptake and increase in PI uptake in mAb 1D5-treated cells.
DNA gel electrophoresis
DNA fragmentation and the display of DNA ladders, often of 200 bp and multiples thereof, in agarose gel electrophoresis are common features of apoptosis. Agarose gel electrophoresis of B. hominis DNA in the presence and absence of mAb 1D5, mAb 5 and 0.1% sodium azide is shown in Fig. 3. No DNA ladder was noted in any experiment except for 2 distinct DNA fragments, 800 bp and ∼1 kb, observed in mAb 1D5, mAb 5-treated and untreated cells. DNA extracted from Raji cells, using the same kit, did not show any such fragments during gel electrophoresis (data not shown), indicating that these 2 fragments are unique to B. hominis. A positive control consisting of apoptotic U937 cells (Boehringer Mannheim) showed a DNA laddering profile typical of apoptosis (Fig. 3).

Fig. 3. Agarose gel electrophoresis of Blastocystis hominis DNA after exposure to mAb 1D5. 100 bp marker (lane 1); apoptotic U937 cells (lane 2); control untreated parasites 0, 3, 24 and 48 h (lanes 3, 4, 5 and 6 respectively); 3, 24 and 48 h mAb 1D5-treatment (lanes 7, 8 and 9 respectively); 3, 24 and 48 h mAb 5 treatment (lanes 10, 11 and 12 respectively); 0.1% sodium azide treatment (lane 13). Note absence of DNA ladder and presence of 2 distinct fragments in lanes 3–12.
Externalization of PS
In non-apoptotic cells, PS is segregated to the inner leaflet of the plasma membrane. During early stages of apoptosis, this asymmetry collapses and PS becomes exposed on the outer surface of cells (Vermes et al. 1995). Annexin V is a protein that preferentially binds PS in a calcium-dependent manner. Annexin V/PI assay detects the translocation of PS to the outer leaflet of the plasma membrane, simultaneously with preservation of membrane integrity. A slight increase in PS translocation was detected by flow cytometry in mAb 1D5-treated cells over a period of 6 h. Annexin V binding in these cells increased from 3.1% at 1 h to 12.9% at 6 h as compared to <4% of control cells at 6 h. Fig. 4 shows the percentage of Annexin V-binding cells against time to represent data obtained from flow cytometry.

Fig. 4. Externalization of PS in Blastocystis hominis cells grown in normal culture conditions and those exposed to mAb 1D5 and mAb 5. Monoclonal antibody 1D5-treated cells show higher percentage of Annexin V-labelled cells relative to controls.
TUNEL assay
Endonuclease activity was evaluated with the TUNEL assay. TUNEL relies on the specific binding of terminal deoxynucleotidyl transferase (TdT) to exposed 3′-OH ends of DNA followed by the synthesis of a labelled polydeoxynucleotide molecule. Nuclear DNA is first exposed by proteolytic treatment; then TdT is used to incorporate biotinylated deoxyuridine into the sites of DNA breaks. The signal is amplified by avidin-peroxidase, enabling conventional histochemical identification of PCD by fluorescence microscopy or flow cytometry.
Fig. 5A and D show TUNEL labelling of control cells after 3 h of growth in normal growth media and mAb 5 respectively. The nucleus is relatively free of TUNEL label indicating unfragmented DNA. In contrast, cells exposed to mAb 1D5 for 3 h exhibited intense TUNEL labelling of the nuclear DNA (Fig. 5C). Parasites exposed to 0.1% sodium azide (necrotic control) showed more diffused TUNEL labelling due to massive, irregular fragmentation of DNA (Fig. 5B).

Fig. 5. In situ DNA fragmentation analysis (TUNEL) of Blastocystic hominis cells by fluorescence microscopy (A–D) and flow cytometry (E). (A) Cells grown in normal culture conditions showing non-specific TUNEL staining. (B) Cells treated with 0.1% sodium azide (necrosis). (C and D) Cells exposed to mAb 1D5 and mAb 5 respectively. (E) Note increase in TUNEL intensity in mAb 1D5-treated cells.
Flow cytometry was employed to quantify in situ DNA fragmentation. By 3 h 16.3% of mAb 1D5 cells were TUNEL labelled and 45.8% were maximally labelled by 48 h. Controls in normal growth media and mAb 5-treated cells showed minimal DNA fragmentation. Nuclease activity in parasites cultured in normal growth media and those exposed to mAb 5 were approximately 1.0% and 0.6% respectively. B. hominis cells that were exposed to 0.1% sodium azide (necrotic control) showed 9.2% TUNEL labelling (Fig. 5E).
Transmission electron microscopy (TEM)
TEM micrographs showed that B. hominis cells treated with mAb 1D5 undergo morphological changes suggestive of apoptosis. After 24 h culture in the presence of mAb 1D5, the nucleus contained chromatin clumps at the nuclear periphery (Fig. 6A). Many mitochondria were seen in mAb 1D5-treated cells (Fig. 6B). The presence of large cytoplasmic vacuoles, either appearing empty or containing some inclusions (Fig. 6C) and cytoplasm blebbing inwards into the central vacuole (Fig. 6D) were noted. This inward cytoplasmic blebbing appears to result in the deposition of apoptotic bodies in the central vacuole (Fig. 6E) prior to their release into the extracellular space (Fig. 6F). In contrast, 24 h culture in normal growth media and mAb 5, showed normal B. hominis morphology. Normal DNA chromatin which is usually seen as a crescentic mass at the nuclear periphery was visible within the nucleus (Fig. 6G).

Fig. 6. For legend see opposite.
Fig. 6. Transmission electron micrographs of Blastocystis hominis cells exposed to mAb 1D5 for 24 h (A–F) showing: (A) segregation of condensed chromatin to the nuclear periphery, (B) increase in number of mitochondria during apoptosis and nuclei with chromatin marginalization (arrow) appearing to migrate into the central vacuole, (C) large cytoplasmic vacuoles (V), (D) cytoplasm pinching inwards into the central vacuole (arrows), (E) membrane-bound organelle-containing vesicles within the central vacuole, (F) apoptotic bodies released into the extracellular space during late apoptosis. (G) Shows healthy B. hominis cell displaying normal DNA chromatin seen as a crescentic mass (arrow). N, nucleus; CV, central vacuole; M, mitochondria; V, vacuole.
Effect of necrotized cells on B. hominis cultures
The 20-day-old B. hominis culture did not contain any viable cells. Such a culture had an inhibitory growth effect on healthy B. hominis cells. When exposed to this aged culture, healthy B. hominis cells showed slight or no growth for 72 h. Negative control tubes, of aged culture only, had no intact cells at Day 0 and at Day 3 indicating that the aged culture preparation had no viable cells. The tubes containing both normal growth media and the aged cell culture had 2.1×10⁷cells. In the positive control tubes containing normal growth media (IMDM with 10% horse serum), in the absence of aged culture, cell number increased 4-fold from 2×10⁷ to 8.5×10⁷cells after 72 h (Fig. 7).

Fig. 7. Effect of necrotized Blastocystis hominis cells on healthy cultures. [−] Control, necrotized cells in normal culture conditions. [+] Control, 3-day-old healthy cells in normal culture conditions. Test, 3-day-old cells exposed to necrotized B. hominis cells.
DISCUSSION
PCD was thought to be only present in multicellular organisms but recent studies on protozoans have shown this phenomenon in unicellular eukaryotes (loc. cit.) suggesting the presence of PCD even before the advent of multicellularity. The present study shows the existence of PCD in yet another protozoan, B. hominis. Tan et al. (1997) showed the cytotoxic effect of mAb 1D5 on healthy B. hominis cells but the mode of death had not been elucidated until now. Shrinkage of mAb 1D5-treated B. hominis cells led us to believe that PCD occurred in this parasite. In the presence of mAb 1D5, B. hominis was also shown to preserve its membrane integrity for up to 48 h using PI and FDA as had been shown in Dictyostelium discoideum (Cornillon et al. 1994).
In higher eukaryotes, apoptotic cells exhibit externalization of PS during PCD (Vermes et al. 1995). This apoptotic feature was noted in only some mAb 1D5-treated B. hominis cells. It is not clear why only a minority of cells show PS externalization during apoptosis. Other investigators have reported similar results where only a minority of cells have Annexin V binding (Ferlini et al. 1997; Gatti et al. 1998; Willingham, 1999). Gatti et al. (1998) reported that this phenomenon could be due to membrane changes that may have occurred during PCD, thus hindering Annexin V binding.
Apoptosis was originally defined by specific morphological criteria, one of which was the condensation of chromatin within the nucleus (Kerr, Wyllie & Currie, 1972). This condensation is thought to be caused by an endonuclease activity that can cleave DNA between the nucleosomes to give fragments that resolve on agarose gel electrophoresis as multiples of about 180–200 bp. Consequently, the appearance of the nucleosomal DNA ladder on agarose gel was regarded as a hallmark of PCD (Collins et al. 1992). However, we could not detect any DNA laddering in B. hominis cells exposed to mAb 1D5. Recent research has shown that some cell types can show morphological and biochemical features typical of apoptosis even in the absence of internucleosomal DNA breakage (Howell & Martz, 1987; Barbieri et al. 1992; Cohen et al. 1992; Collins et al. 1992; Mesner, Winters & Green, 1992; Ucker, Obermiller & Eckhart, 1992; Falcieri et al. 1993; Cornillon et al. 1994; Hirata et al. 1998).
TUNEL assay was then employed to show endonuclease activity in mAb 1D5-treated B. hominis cells resulting in DNA fragmentation. Although agarose gel electrophoresis of B. hominis DNA did not show typical ladder-like DNA fragmentation pattern, TUNEL fluorescence is sufficient to confirm DNA fragmentation. Darzynkiewicz et al. (1997) showed that DNA degradation, in many cell types, does not proceed to nucleosomal sized fragments but rather results in 50–300 kb DNA fragments which do not readily generate a characteristic ‘ladder’ pattern during agarose gel electrophoresis.
TEM of mAb 1D5-treated cells showed segregation of condensed chromatin in fine masses against the inner surface of the nuclear membrane. More mitochondria were seen in the apoptotic cells suggesting that this mode of death in B. hominis is an energy-requiring process. In mammalian apoptotic cells, the cell membrane pinches outwards to form apoptotic bodies externally. In our study, cytoplasmic portions of the apoptotic B. hominis cell invaginates into the central vacuole. This process appears to result in the formation of membrane-bound apoptotic bodies containing portions of the fragmented nucleus and an array of intact organelles such as mitochondria resulting in vacuolization and thinning of the cytoplasm in the apoptotic cell. This sequence of events sets apoptosis apart from necrosis, where the intracellular enzymes are released into the extracellular space, thus inhibiting growth of healthy B. hominis cells. The apoptotic bodies are packaged as membrane-bound vesicles prior to their release into the extracellular space. We have shown that the necrotized B. hominis cells inhibited growth of healthy cells. Intracellular enzymes such as proteases from the necrotized cells may be responsible for this.
Several aspects of the cell death pathway in response to mAb 1D5 are similar to PCD in higher eukaryotes, including commitment to cell death hours prior to expiry of plasma membrane integrity, fragmentation of nuclear DNA, externalization of PS and formation of apoptotic bodies. Apoptosis-like processes described in other parasites share similar characteristics of the cell death pathway (Ameisen et al. 1995; Moreira et al. 1996; Welburn et al. 1996; Murphy & Welburn 1997; Picot et al. 1997; Ridgley, Xiong & Ruben, 1999). Apoptosis in B. hominis, however, occurs without DNA ladder-like oligonucleosomal fragments in gel electrophoresis. There was evidence of some externalization of PS which has not been reported in other parasites. Unlike mammalian cells where apoptotic bodies bud off the plasma membrane, in B. hominis the apoptotic bodies collect in the central vacuole before being released into the extracellular space.
It is tempting to postulate a unique role for the central vacuole as a repository for apoptotic bodies. The exact function of the central vacuole in this organism has yet to be determined (Stenzel & Boreham, 1996). Previous studies have shown that the central vacuole is devoid of hydrolytic enzymes like acid phosphatase (Stenzel, Dunn & Boreham, 1989). Yoshikawa & Hayakawa (1996) revealed that the central vacuole of B. hominis is a repository for carbohydrates and lipids required for cell growth. Dunn, Boreham & Stenzel (1989) reported that the central vacuole infrequently contained sections of membranous material of unknown origin. Recently, Pakandl (1999) demonstrated cytoplasmic projections containing mitochondria and nuclei in the central vacuole but did not ascribe any function for the protrusions. We believe that the central vacuole could also be a repository for apoptotic bodies during PCD. Fig. 8 shows the postulated sequence of events that occur in B. hominis undergoing apoptosis.
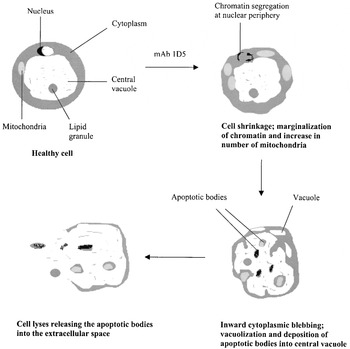
Fig. 8. Proposed stages of apoptosis in Blastocystis hominis.
Why does an intestinal parasite like B. hominis undergo PCD? If B. hominis were to undergo necrosis in vivo, in which dying cells spill their contents into the extracellular space, growth of the B. hominis population will be greatly disrupted. We believe that a proportion of the B. hominis population, therefore, undergoes PCD, while others survive to infect the host. This feature is similar to the findings of Welburn, Barcinski & Williams (1997) who reported that some trypanosomatids undergo PCD for the continuation of their life-cycle.
Most of this work was supported by a generous research grant (RP3992340) from the National University of Singapore. The assistance of Mrs Josephine Howe in transmission electron microscopy and that of Miss Ng Bee Ling (National University Medical Institutes, NUS) in flow cytometry is greatly appreciated.
References
AMEISEN, J. C., IDZIOREK, T., BILLANT-MULOT, O., LOYENS, M., TISSNER, J., POTENTIER, A. & OMAISSI, A. (1995). Apoptosis in a unicellular eukaryote (Trypanosoma cruzi): implications for the evolutionary origin and role of programmed cell death in the control of cell proliferation, differentiation and survival. Cell Death and Differentiation 2, 285–300.Google Scholar
BARBIERI, D., TROIANO, L., GRASSILLI, E., AGNESINI, C., CRISTOFALO, E. A., MONTI, D., CAPRI, M., COSSARIZZA, A. & FRANCESCHI, C. (1992). Inhibition of apoptosis by zinc: a reappraisal. Biochemistry and Biophysics Research Communication 187, 1256–1261.CrossRefGoogle Scholar
COHEN, G. M., SUN, X., SNOWDEN, R. T., DINSDALE, D. & SKILLETER, D. N. (1992). Key morphological features of apoptosis may occur in the absence of internucleosomal DNA fragmentation. Biochemistry Journal 286, 331–334.CrossRefGoogle Scholar
COLLINS, R. J., HARMON, B. V., GOBE, G. C. & KERR, J. F. R. (1992). Internucleosomal DNA cleavage should not be the sole criterion for identifying apoptosis. International Journal of Radiation Biology 61, 451–453.CrossRefGoogle Scholar
COLLINS, J. A., SCHANDL, C. A., YOUNG, K. K., VESELY, J. & WILLINGHAM, M. C. (1997). Major DNA fragmentation is a late event in apoptosis. Journal of Histochemistry and Cytochemistry 45, 923–934.CrossRefGoogle Scholar
CORNILLON, S., FOA, C., DAVOUST, J., BUONAVISTA, N., GROSS, J. D. & GOLSTEIN, P. (1994). Programmed cell death in Dictyostelium. Journal of Cell Science 107, 2691–2704.Google Scholar
DARZYNKIEWICZ, Z., JUAN, G., LI, X., GORCZYCA, W., MURAKAMI, T. & TRAGANOS, F. (1997). Cytometry in cell necrobiology: analysis of apoptosis and accidental cell death (necrosis). Cytometry 27, 1–20.3.0.CO;2-L>CrossRefGoogle Scholar
DUNN, L. A., BOREHAM, P. F. L. & STENZEL, D. J. (1989). Ultrastructural variation of Blastocystis hominis stocks in culture. International Journal for Parasitology 19, 43–56.CrossRefGoogle Scholar
ELLIS, R. E., YUAN, J. & HORVITZ, H. R. (1991). Mechanisms and functions of cell death. Annual Reviews of Cell Biology 7, 663–698.CrossRefGoogle Scholar
FALCIERI, E., MARTELLI, A. M., BAREGGI, R., CATALDI, A. & COCCO, L. (1993). The protein kinase inhibitor staurosporine induces morphological changes typical of apoptosis in Molt-4 cells without concomitant DNA fragmentation. Biochemistry and Biophysics Research Communication 193, 19–25.CrossRefGoogle Scholar
FERLINI, C., KUNKL, A., SCAMBIA, G. & FATTOROSSI, A. (1997). The use of Apostain in identifying early apoptosis. Journal of Immunological Methods 205, 95–101.CrossRefGoogle Scholar
GATTI, R., BELLETTI, S., ORLANDINI, G., BUSSOLATI, O., DALL'ASTA, V. & GAZZOLA, G. C. (1998). Comparison of Annexin V and Calcein-AM as early vital markers of apoptosis in adherent cells by confocal laser microscopy. Journal of Histochemistry and Cytochemistry 46, 895–900.CrossRefGoogle Scholar
HIRATA, H., HIBASAMI, H., YOSHIDA, T., MORITA, A., OHKAYA, S., MATSUMOTO, M., SASAKI, H. & UCHIDA, A. (1998). Differentiation and apoptosis without DNA fragmentation in cultured Schwann cells derived from wallerian-degenerated nerve. Apoptosis 3, 353–360.CrossRefGoogle Scholar
HO, L. C., SINGH, M., SURESH, G., NG, G. C. & YAP, E. H. (1993). Axenic culture of Blastocystis hominis in Iscove's modified Dulbecco's medium. Parasitology Research 79, 614–616.CrossRefGoogle Scholar
HOWELL, D. M. & MARTZ, E. (1987). The degree of CTL-induced DNA solubilization is not determined by the human vs mouse origin of the target cell. Journal of Immunology 138, 3695–3698.Google Scholar
KERR, J. F. R., SEARLE, J., HARMON, B. V. & BISHOP, C. J. (1987). Apoptosis. In Perspectives on Mammalian Cell Death (ed. POTTEN, C. S.), pp. 93–128. Oxford University Press, Oxford.
KERR, J. F. R., WYLLIE, A. H. & CURRIE, A. R. (1972). Apoptosis: A basic biological phenomenon with wide-ranging implications in tissue kinetics. British Journal of Cancer 26, 239–257.CrossRefGoogle Scholar
MESNER, P. W., WINTERS, T. R. & GREEN, S. H. (1992). Nerve growth factor withdrawal-induced cell death in neuronal PC12 cells resembles that in sympathetic neurons. Journal of Cell Biology 199, 1669–1680.CrossRefGoogle Scholar
MOE, K. T., SINGH, M., HOWE, J., HO, L. C., TAN, S. W., CHEN, X. Q. & YAP, E. H. (1999). Development of Blastocystis hominis cysts into vacuolar forms in vitro. Parasitology Research 85, 103–108.CrossRefGoogle Scholar
MOREIRA, M. E. L., PORTILLO, H. A. D., MILDER, R. V., BALANCO, J. M. F. & BARCINSKI, M. A. (1996). Heat shock induction of apoptosis in promastigotes of the unicellular organism Leishmania (Leishmania) amazonensis. Journal of Cellular Physiology 167, 305–313.3.0.CO;2-6>CrossRefGoogle Scholar
MURPHY, N. B. & WELBURN, S. C. (1997). Programmed cell death in procyclic Trypanosoma brucei rhodesiense is associated with differential expression of mRNAs. Cell Death and Differentiation 4, 365–370.CrossRefGoogle Scholar
PAKANDL, M. (1999). Blastocystis sp. from pigs: ultrastructural changes occurring during polyxenic cultivation in Iscove's modified Dulbecco's medium. Parasitology Research 85, 743–748.Google Scholar
PENFOLD, P. L. & PROVIS, J. M. (1986). Cell death in the development of the human retina: phagocytosis of pyknotic and apoptotic bodies by retinal cells. Graefe's Archive for Clinical and Experimental Opthalmology 224, 549–553.CrossRefGoogle Scholar
PICOT, S., BURNOD, J., BRACCHI, V., CHUMPITAZI, B. F. F. & AMBROISE-THOMAS, P. (1997). Apoptosis related to chloroquine sensitivity of the human malaria parasite Plasmodium falciparum. Transactions of the Royal Society of Tropical Medicine and Hygiene 91, 590–591.CrossRefGoogle Scholar
RAFF, M. C. (1992). Social controls on cell survival and cell death. Nature, London 356, 397–400.CrossRefGoogle Scholar
RIDGLEY, E. L., XIONG, Z. & RUBEN, L. (1999). Reactive oxygen species activate a Ca2+-dependent cell death pathway in the unicellular organism Trypanosoma brucei. Biochemistry Journal 340, 33–40.CrossRefGoogle Scholar
STELLER, H. (1995). Mechanisms and genes of cellular suicide. Science 267, 1445–1449.CrossRefGoogle Scholar
STENZEL, D. J. & BOREHAM, P. F. L. (1996). Blastocystis hominis revisited. Clinical Microbiology Review 9, 563–584.Google Scholar
STENZEL, D. J., DUNN, L. A. & BOREHAM, P. F. L. (1989). Endocytosis in cultures of Blastocystis hominis. International Journal for Parasitology 19, 787–791.CrossRefGoogle Scholar
TAN, S. W., HO, L. C., MOE, K. T., CHEN, X. Q., NG, G. C., YAP, E. H. & SINGH, M. (1996). Production and characterization of murine monoclonal antibodies to Blastocystis hominis. International Journal for Parasitology 26, 375–381.CrossRefGoogle Scholar
TAN, S. W., SINGH, M., HO, L. C., HOWE, J., MOE, K. T., CHEN, X. Q., NG, G. C. & YAP, E. H. (1997). Survival of Blastocystis hominis clones after exposure to a cytotoxic monoclonal antibody. International Journal for Parasitology 27, 947–954.CrossRefGoogle Scholar
UCKER, D. S., OBERMILLER, P. S. & ECKHART, W. (1992). Genome digestion is a dispensable consequence of physiological cell death mediated by cytotoxic T lymphocytes. Molecular and Cell Biology 12, 3060–3069.CrossRefGoogle Scholar
VAUX, D. L. (1993). Towards an understanding of the molecular mechanisms of physiological cell death. Proceedings of the National Academy of Sciences, USA 90, 786–789.CrossRefGoogle Scholar
VAUX, D. L. & STRASSER, A. (1996). The molecular biology of apoptosis. Proceedings of the National Academy of Sciences, USA 93, 2239–2244.CrossRefGoogle Scholar
VERMES, I., HAANEN, C., STEFFENS-NAKKEN, H. & REUTELINGSPERGER, C. (1995). A novel assay for apoptosis: Flow cytometric detection of phosphatidylserine expression on early apoptotic cells using fluorescein labelled Annexin V. Journal of Immunological Methods 184, 39–51.CrossRefGoogle Scholar
WELBURN, S. C., DALE, C., ELLIS, D., BEECROFT, R. & PEARSON, T. W. (1996). Apoptosis in procyclic Trypanosoma brucei rhodesiense in vitro. Cell Death and Differentiation 3, 229–236.Google Scholar
WELBURN, S. C., BARCINSKI, M. A. & WILLIAMS, G. T. (1997). Programmed cell death in trypanosomatids. Parasitology Today 13, 22–26.CrossRefGoogle Scholar
WILLINGHAM, M. C. (1999). Cytochemical method for the detection of apoptosis. Journal of Histochemistry and Cytochemistry 47, 1101–1109.CrossRefGoogle Scholar
WYLLIE, A. H. (1992). Apoptosis and the regulation of cell numbers in normal and neoplastic tissues: an overview. Cancer Metastasis Review 11, 93–103.CrossRefGoogle Scholar
YOSHIKAWA, H. & HAYAKAWA, A. (1996). Morphological changes in the central vacuole of Blastocystis hominis during in vitro culture. Protoplasm 194, 63–68.CrossRefGoogle Scholar

Fig. 1. Effect of mAb 1D5 on Blastocystis hominis cell size and morphology by light microscopy (A and B) and flow cytometry (C). (A) Cells grown in normal culture conditions. (B) Cells exposed to mAb 1D5. Note cell shrinkage, condensed cytoplasm and darkening of cells after exposure to mAb 1D5. (C) Flow cytometry analysis of cell size and granularity. X and Y axes represent cell size and granularity respectively. X-mean and Y-mean quantify cell size and granularity respectively. Note 2 distinct populations of cells in flow cytometry. The population on the left could be due to dead cells and debris while those on the right could be undergoing PCD. From the X-mean, it can be deduced that mAb 1D5-treated cells undergo cell shrinkage.
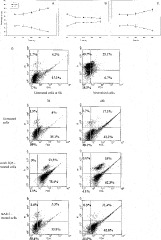
Fig. 2. For legend see opposite.Fig. 2. Membrane integrity assay of Blastocystis hominis cells using FDA/PI staining by fluorescence microscopy (A–C) and flow cytometry (D). (A) Untreated cells. (B and C) Cells exposed to mAb 1D5 and mAb 5 respectively. Note gradual increase of PI uptake and gradual decrease of FDA uptake in mAb 1D5-treated cells. (D) X and Y axes represent FDA and PI staining respectively. Note decrease in FDA uptake and increase in PI uptake in mAb 1D5-treated cells.

Fig. 3. Agarose gel electrophoresis of Blastocystis hominis DNA after exposure to mAb 1D5. 100 bp marker (lane 1); apoptotic U937 cells (lane 2); control untreated parasites 0, 3, 24 and 48 h (lanes 3, 4, 5 and 6 respectively); 3, 24 and 48 h mAb 1D5-treatment (lanes 7, 8 and 9 respectively); 3, 24 and 48 h mAb 5 treatment (lanes 10, 11 and 12 respectively); 0.1% sodium azide treatment (lane 13). Note absence of DNA ladder and presence of 2 distinct fragments in lanes 3–12.

Fig. 4. Externalization of PS in Blastocystis hominis cells grown in normal culture conditions and those exposed to mAb 1D5 and mAb 5. Monoclonal antibody 1D5-treated cells show higher percentage of Annexin V-labelled cells relative to controls.

Fig. 5. In situ DNA fragmentation analysis (TUNEL) of Blastocystic hominis cells by fluorescence microscopy (A–D) and flow cytometry (E). (A) Cells grown in normal culture conditions showing non-specific TUNEL staining. (B) Cells treated with 0.1% sodium azide (necrosis). (C and D) Cells exposed to mAb 1D5 and mAb 5 respectively. (E) Note increase in TUNEL intensity in mAb 1D5-treated cells.
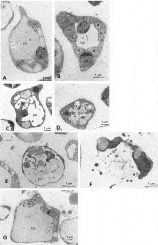
Fig. 6. For legend see opposite.Fig. 6. Transmission electron micrographs of Blastocystis hominis cells exposed to mAb 1D5 for 24 h (A–F) showing: (A) segregation of condensed chromatin to the nuclear periphery, (B) increase in number of mitochondria during apoptosis and nuclei with chromatin marginalization (arrow) appearing to migrate into the central vacuole, (C) large cytoplasmic vacuoles (V), (D) cytoplasm pinching inwards into the central vacuole (arrows), (E) membrane-bound organelle-containing vesicles within the central vacuole, (F) apoptotic bodies released into the extracellular space during late apoptosis. (G) Shows healthy B. hominis cell displaying normal DNA chromatin seen as a crescentic mass (arrow). N, nucleus; CV, central vacuole; M, mitochondria; V, vacuole.
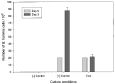
Fig. 7. Effect of necrotized Blastocystis hominis cells on healthy cultures. [−] Control, necrotized cells in normal culture conditions. [+] Control, 3-day-old healthy cells in normal culture conditions. Test, 3-day-old cells exposed to necrotized B. hominis cells.
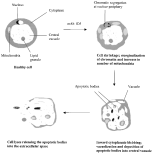
Fig. 8. Proposed stages of apoptosis in Blastocystis hominis.
 You have
Access
- 43
- Cited by