Implications
A standardised methodology is required for classification of starchy diets (e.g. grain processing techniques) on glycaemic and insulinaemic responses in horses. Differences in results obtained for horses might be due to differences in experimental protocols. The present data suggest that feed restriction for 12 h before feeding the starchy diet and no further ingestion of roughage during the blood sampling period provides the best-defined conditions. Hay is a very heterogeneous feedstuff (e.g. large differences in nutrient composition or total amount of hay consumed during ad libitum access); therefore, a precise description of the side effects of hay composition on metabolic responses is hard to define.
Introduction
In horses, several studies have been conducted to describe glycaemic and insulinaemic responses to a starchy meal with a focus on grain origin (Stull and Rodiek, Reference Stull and Rodiek1988; Jose-Cunilleras et al., Reference Jose-Cunilleras, Taylo and Hinchcliff2004; Rodiek and Stull, Reference Rodiek and Stull2007), different grain processing techniques (Vervuert et al., Reference Vervuert, Coenen and Bothe2003, Reference Vervuert, Coenen and Bothe2004, Reference Vervuert, Bothe and Coenen2007 and Reference Vervuert, Voigt, Hollands, Cuddeford and Coenen2008a) or the interaction between starch and other nutrients like fiber (Stull and Rodiek, Reference Stull and Rodiek1988; Radicke et al., Reference Radicke, Meyer and Kienzle1994; Pagan and Harris, Reference Pagan and Harris1999; Harris et al., Reference Harris, Sillence, Inglis, Siever-Kelly, Friend, Munn and Davidson2005; Vervuert et al., Reference Vervuert, Klein and Coenen2008b and Reference Vervuert, Voigt, Hollands, Cuddeford and Coenen2008c) or fat (Stull and Rodiek, Reference Stull and Rodiek1988; Delobel et al., Reference Delobel, Schoonheere, Hornick and Istasse2006).
Recently, Brouns et al. (Reference Brouns, Bjorck, Frayn, Gibbs, Lang, Slama and Wolever2005) reviewed the influence of methodological variations and their impact on blood glucose and insulin responses to a starchy diet in humans. Methodological considerations include number of subjects, sex, age, subject status, pre-test conditions, carbohydrate intake and blood sampling procedures (Brouns et al., Reference Brouns, Bjorck, Frayn, Gibbs, Lang, Slama and Wolever2005; Ralston, Reference Ralston2005; Vervuert and Coenen, Reference Vervuert and Coenen2005). However, general recommendations in experimental procedures related to glycaemic and insulinaemic responses to starchy diets do not exist in horses (Ralston, Reference Ralston2005; Vervuert and Coenen, Reference Vervuert and Coenen2005). To date, information is lacking as to which recommendations should be considered to standardise the methodology. One open question is related to the effects of the foregoing feeding state on blood glucose and insulin responses to a starchy diet (Ralston, Reference Ralston2005). In humans, testing glycaemic and insulinaemic responses preferably should occur before 1000 h in the morning, after a 10- to 14-h overnight fast (Brouns et al., Reference Brouns, Bjorck, Frayn, Gibbs, Lang, Slama and Wolever2005). In horses, the feeding states before and after feeding of the test meal is performed equivocally. In most studies, a 10- to 18-h overnight fast is described, and no additional forage was given to the horses during the postprandial blood sampling period (Stull and Rodiek, Reference Stull and Rodiek1988; Vervuert et al., Reference Vervuert, Coenen and Bothe2003, Reference Vervuert, Coenen and Bothe2004, Reference Vervuert, Bothe and Coenen2007, Reference Vervuert, Voigt, Hollands, Cuddeford and Coenen2008a, Reference Vervuert, Klein and Coenen2008b and Reference Vervuert, Voigt, Hollands, Cuddeford and Coenen2008c; Jose-Cunilleras et al., Reference Jose-Cunilleras, Taylo and Hinchcliff2004; Zeyner et al., Reference Zeyner, Hoffmeister, Einspanier, Gottschalk, Lengwenat and Illies2006). In other studies, ad libitum access to hay was offered the night before and during the blood sampling procedure (Hoffman et al., Reference Hoffman, Boston, Stefanovski, Kronfeld and Harris2003; Treiber et al., Reference Treiber, Boston, Kronfeld, Staniar and Harris2005). The data from literature provide evidence that the feeding state before feeding of the test diet might influence the glycaemic and insulinaemic responses. Sticker et al. (Reference Sticker, Thompson, Bunting, Fernandez, DePew and Nadal1995) found no significant impact on glucose and insulin responses in protein- or energy-restricted mares, but their non-esterified fatty acids (NEFA) concentrations were 2.5 times higher than those of mares fed control energy. Similar changes were reported by Rose and Sampson (Reference Rose and Sampson1982) after 24, 48, 72 and 96 h of withholding feed in horses. After a 19-h period of feed deprivation, DePew et al. (Reference DePew, Thompson, Fernandez, Sticker and Burleigh1994) reported that refeeding of horses was followed by increased plasma concentrations of insulin, glucagon, glucose and blood urea nitrogen, and by reduced concentrations of NEFAs. In contrast, 48 h of feed restriction decreased insulin levels in slightly obese pony mares compared with ponies fed alfalfa hay ad libitum (Buff et al., Reference Buff, Spader, Morrison and Keisler2006). Long-lasting fasting periods (>3 days) have been shown to reduce tissue sensitivity to the glucoregulatory action of insulin in ponies and donkeys (Argenzio and Hintz, Reference Argenzio and Hintz1971; Forhead and Dobson, Reference Forhead and Dobson1997).
The main objectives of this study were (i) to investigate the effects on glycaemic and insulinaemic responses related to the overnight feeding state (hay intake v. fasting) before the intake of cracked corn (CC) and (ii) to examine whether hay intake during the blood sampling period affects postprandial metabolic responses to the CC diet.
Material and methods
Animals
Four geldings, all aged 3 years, mean body mass (±s.d.) 417 (±43) kg, mean body condition score 4.0 ± 0.5 (on a scale of 1 to 9), were individually housed in box stalls, bedded on straw, and turned out onto a sand paddock for 3 h a day. The horses had free access to water at all times. This project was approved by the ethics committee for animal rights protection of the Leipzig district government, in accordance with German legislation for animal rights and welfare.
Diets
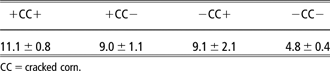
Horses were fed, in a randomised order, four different feeding protocols with hay offered before or after CC intake: (i) ad libitum hay for 12 h before feeding CC and ad libitum hay after CC intake for 9 h (+CC+); (ii) ad libitum hay for 12 h before feeding CC and no hay after CC intake for 9 h (+CC−); (iii) feed restriction for 12 h before feeding CC and ad libitum hay after CC intake for 9 h (−CC+); and (iv) 1.2 kg hay/100 kg of body weight (BW) per day divided into two equal portions and offered at 0900 h and 1900 h, feed restriction for 12 h before feeding CC and no hay after CC intake for 9 h (−CC−) (Table 1). The CC intake was adjusted to a starch intake of 2 g/kg BW for the different hay offerings. CC was fed once per day at 0800 h. Each feeding protocol consisted of a 10-day acclimatisation period.
Mean (±s.d.) dry matter intake (kg/day) for the different hay offerings (N = 4) during acclimatisation period

CC = cracked corn.
Blood collection day
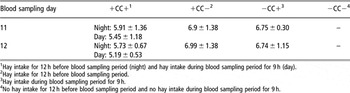
Blood was collected at the end of each acclimatisation period at day 11 and 12, before and after CC was fed at 0800 h, according to the different feeding protocols: (i) ad libitum hay for 12 h before feeding CC and ad libitum hay after CC intake for 9 h during blood sampling period (+CC+); (ii) ad libitum hay for 12 h before feeding CC and no hay after CC intake during blood sampling period (+CC−); (iii) feed restriction for 12 h before feeding CC and ad libitum hay after CC intake for 9 h during blood sampling period (−CC+); and (iv) feed restriction for 12 h before feeding CC and no hay after CC intake during blood sampling period (−CC−) (Table 2).
Mean (±s.d.) dry matter intake (kg) for the different hay offerings during blood sampling days (N = 4)

1Hay intake for 12 h before blood sampling period (night) and hay intake during blood sampling period for 9 h (day).
2Hay intake for 12 h before blood sampling period.
3Hay intake during blood sampling period for 9 h.
4No hay intake for 12 h before blood sampling period and no hay intake during blood sampling period for 9 h.
At day 11 (0700 h), an indwelling catheter (1.8 × 2.35 mm/12 G; Braun, Melsungen, Germany) was inserted into the Vena jugularis externa. The catheter was connected to a 50-cm extension set (Vygon, Aachen, Germany) and sutured in place. The extension set and catheter were flushed with physiological saline after every blood sampling. At day 12 after the last blood sampling, the catheter was removed.
Blood samples were collected at day 11 and day 12, 30 min before feeding the CC at 0730 h and thereafter at 30-min intervals for 8.5 h.
Blood was collected into tubes containing lithium-heparin (Sarstedt AG, Numbrecht, Germany); the blood samples were centrifuged at 1800 × g for 10 min and plasma was stored at −20°C until analysed.
Analytical methods
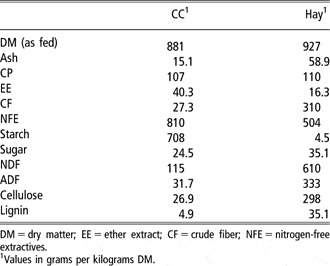
Starch was estimated polarimetrically (Polartronic E; Schmidt and Haensch, Berlin, Germany). Sugar (glucose and sucrose) was determined by the Luff Schoorl method (Matissek et al., Reference Matissek, Schnepel and Steiner1992). Other dietary components were assayed by the Weende system (Naumann and Bassler, Reference Naumann and Bassler1999). The chemical analyses of CC and hay are shown in Table 3.
Chemical analyses for cracked corn (CC) and hay

DM = dry matter; EE = ether extract; CF = crude fiber; NFE = nitrogen-free extractives.
1Values in grams per kilograms DM.
Plasma glucose concentrations were determined by glucose oxidase assay (Unimate 7 GLUC GDH; Roche Diagnostics GmbH, Mannheim, Germany), and plasma insulin was determined by radioimmunoassay (Insulin RIA, Coat-a-Count (125I); DPC Biermann, Bad Nauheim, Germany).
Statistical methods
The following parameters were calculated: mean plasma glucose and plasma insulin concentrations; peak plasma glucose and peak plasma insulin; time to peak plasma glucose and plasma insulin; incremental area under the plasma glucose and plasma insulin curve (AUC), with the use of simple non-overlapping polygons; and the area over the baseline, without consideration of the AUC.
Data were subjected to an analysis of variance for repeated measures (STATISTIKA; StatSoft, Tulsa, OK), factoring the effects of diet, postprandial time and blood sampling day. Because blood sampling day (day 11 and 12) was not significant, data were pooled as a mean of two blood sampling days for each horse. When F values were significant, a least significant difference test was applied for further analysis.
Significant differences between means were identified by use of the Student–Newman–Keul test. Linear and nonlinear correlation tests were used to test for any relationship between serum glucose and serum insulin. Statistical significance was accepted at P < 0.05.
Results
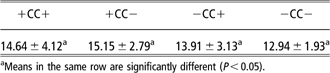
Rate of CC intake varied between 12.94 ± 1.93 (−CC−) and 15.15 ± 2.79 min/kg dry matter (DM) (+CC−) (Table 4).
Mean (±s.d.) dry matter intake time (min/kg dry matter) for cracked corn (CC) relative to the different hay offerings during blood sampling days

aMeans in the same row are significantly different (P < 0.05).
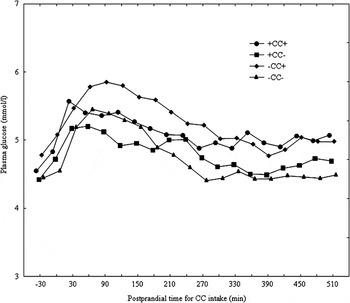
The different hay offerings did not affect basal glucose levels because, for all diets, mean resting glucose concentrations varied between 4.42 (+CC−) and 4.78 mmol/l (−CC+) (diet P = ns; Figure 1). A significant rise in plasma glucose was found after CC intake for all diets (Figure 1). The highest peak plasma glucose levels were analysed for −CC+ (Table 5), and the lowest peaks were found for +CC− (Table 5, diet P < 0.05). Time to reach peak plasma glucose concentration varied between 45 (+CC+) and 113 min (−CC+) postprandially (diet P = ns; Table 5). Plasma glucose concentrations turned back to resting levels 270 to 300 min after feed intake (Figure 1).
Mean plasma glucose concentrations (mmol/l) for +CC+ (●, ±0.34 mmol/l, blood sampling day P = 0.205), +CC− (▪, ±0.42 mmol/l, blood sampling day P = 0.717), −CC+ (⧫, ±0.61 mmol/l, blood sampling day P = 0.960) and −CC− (▴, ±0.62 mmol/l, blood sampling day P = 0.950). Values are means over two blood sampling days; pooled s.d. are given in brackets. Diet P = 0.23, time P < 0.001, diet × time P = 0.80.

Peak plasma glucose concentrations (mmol/l), time to peak plasma glucose (min), peak plasma insulin concentrations (μU/ml) and time to peak plasma insulin (min) for the different treatments

a,bMeans in the same column with different superscripts are significantly different (P < 0.05).
Values are means over two blood sampling days ± s.d.
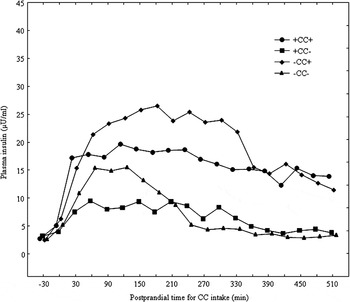
Resting plasma insulin concentrations were 2.44 (−CC+) and 3.19 μU/ml (+CC−) (diet P = ns). After the intake of CC, plasma insulin concentrations rose postprandially (time P < 0.05), with the highest peaks for −CC+ (31.27 ± 18.19 μU/ml) and significant lower peaks for +CC− (13.36 ± 2.93 μU/ml) (diet P < 0.05; Table 5). Time to reach maximum plasma insulin concentration varied between 68 (−CC−) and 218 min (+CC−) postprandially after CC intake (diet P = ns; Table 5). Plasma insulin (Figure 2) concentrations for −CC− and +CC− returned to resting values about 300 min after CC feeding. For +CC+ and −CC+, plasma insulin concentrations were still above resting levels 510 min after CC intake (time P < 0.05, diet P < 0.05).
Mean plasma insulin concentrations (μU/ml) for +CC+ (●, ±7.62 μU/ml, blood sampling day P = 0.957), +CC− (▪, ±3.74 μU/ml, blood sampling day P = 0.520), −CC+ (⧫, ±13.79 μU/ml, blood sampling day P = 0.463) and −CC− (▴, ±6.56 μU/ml, blood sampling day P = 0.679). Values are means over two blood sampling days; pooled s.d. are given in brackets. Diet P = 0.06, time P < 0.001, diet × time P = 0.048.

Discussion
Different hay offerings were used to investigate the effects of feeding state on glycaemic and insulinaemic responses to a starchy meal in healthy horses.
In the present study, resting glucose and insulin levels were not affected by feeding state (feed withheld for 12 h or ad libitum hay feeding). Similar findings were reported in the literature (Rose and Sampson, Reference Rose and Sampson1982; DePew et al., Reference DePew, Thompson, Fernandez, Sticker and Burleigh1994). The maintenance of glucose levels during a fasting state suggests that hepatic gluconeogenesis and/or glycogenolysis play an important role in glucose homeostasis. In horses, it is supposed that energy metabolism during 12 h of feed deprivation is partly compensated by microbial fermentation of carbohydrates in the large intestine and the resulting products of short chain fatty acids (SCFAs) like propionate, acetate and butyrate (Bergman, Reference Bergman1990). In the large intestine, SCFAs are absorbed at their site of production, and propionate is known to be largely converted into glucose (Bergman, Reference Bergman1990). Gastrointestinal transit time of roughage varies between 22 and 36.6 h (Pearson et al., Reference Pearson, Archibald and Muirhead2001); most digesta reach the caecum and ventral colon within 3 h of a meal (Cuddeford, Reference Cuddeford2002). Thus, it seems that during the short period of feed restriction, most of the roughage offered to the horses before the feed restriction was still in the process of fermentation and was contributing to energy metabolism.
One striking result was the relatively low glucose and insulin response after CC intake (2 g starch/kg BW) independent of the different hay offerings. In a similar trial, we offered CC (2 g starch/kg BW) to older horses (mean age 11.8 ± 1 years) and found glucose peaks up to 7 mmol/l and maximum insulin responses up to 85 μU/ml (Vervuert et al., Reference Vervuert, Klein and Coenen2008b), which are comparable to those changes obtained in whole oats (Vervuert et al., Reference Vervuert, Voigt, Hollands, Cuddeford and Coenen2008c) or rolled barley (Jose-Cunilleras et al., Reference Jose-Cunilleras, Taylo and Hinchcliff2004; Vervuert et al., Reference Vervuert, Voigt, Hollands, Cuddeford and Coenen2008a). Similar to our findings, higher glucose and insulin responses were reported in aged horses (>20 years) than in young horses (<5 years) after an oral glucose challenge (Ralston et al., Reference Ralston, Nockels and Squires1988; Malinowski et al., Reference Malinowski, Shock, Rochelle, Kearns, Guirnalda and McKeever2006). Recent research indicates a negative impact on insulin sensitivity in horses fed high glycaemic meals over a period of months (Hoffman et al., Reference Hoffman, Boston, Stefanovski, Kronfeld and Harris2003; Treiber et al., Reference Treiber, Boston, Kronfeld, Staniar and Harris2005). In the present study before the start of experiments, the young horses were mainly on a grass- or hay-based diet with less exposure to starch. On the other hand, our older horses were used for several experimental trials that assessed the effects of grain processing on starch availability (Vervuert et al., Reference Vervuert, Voigt, Hollands, Cuddeford and Coenen2008a and Reference Vervuert, Voigt, Hollands, Cuddeford and Coenen2008c). It is tentative to speculate that the chronic starch intake might have negatively influenced insulin sensitivity in older horses. Another possible explanation might be a reduced digestion of starch related to low levels of pancreatic amylase in the small intestine in the young horses; consequently, enzymatic hydrolysis of starch was limited. The pancreatic concentration of amylase is reported to be low in horses compared with other animals like pigs (Radicke et al., Reference Radicke, Landes, Kienzle and Meyer1992). In that context, it is interesting to note that equine pancreatic tissue lipase was more dominant (1090 ± 285.3 U/mg of DNA) than pancreatic amylase (59.5 ± 9.8 U/mg of DNA) (Lorenzo-Figueras et al., Reference Lorenzo-Figueras, Morisset, Morisset, Lainé and Merritt2007). The influence of diet on relative and absolute amounts of pancreatic enzymes is well established in other species, particularly in rats and swine (Wicker et al., Reference Wicker, Puigserver and Scheele1984; Owsley et al., Reference Owsley, Orr and Tribble1986). In rats, high dietary carbohydrate intake increased amylase synthesis in pancreatic lobules and also increased mRNA-directed synthesis of amylase in the translation system in vitro (Wicker et al., Reference Wicker, Puigserver and Scheele1984). However, information on age- and diet-related effects on pancreatic amylase concentration is rare in the horse, but adaptation processes are supposed to be similar to those of other animal species. Radicke et al. (Reference Radicke, Landes, Kienzle and Meyer1992) observed lower amylase activity in the chyme after hay intake than after oat or corn intake in horses fitted with permanent fistulas into the jejunum. Taking these data into consideration, we cannot exclude that pancreatic amylase activity was relatively low in the young horses, and that adaptation time to the CC was too short to induce an increase in amylase synthesis. In that context, an incomplete enzymatic starch breakdown in the small intestine is of some concern because undigested starch will enter the hindgut and be fermented by bacteria (De Fombelle et al., Reference De Fombelle, Veiga, Drogoul and Julliand2004; Coenen et al., Reference Coenen, Moesseler and Vervuert2006). Generally, bacterial breakdown of starch occurs very rapidly in the large intestine, leading to an accumulation of lactic acid and SCFAs that results in a decreased pH (Radicke et al., Reference Radicke, Kienzle and Meyer1993; Hussein et al., Reference Hussein, Vogedes, Fernandez and Frankeny2004; Richards et al., Reference Richards, Hinch and Rowe2006). These changes are well recognised and can induce disturbances in the large intestine environment. Beside starch breakdown in the hindgut, it cannot be excluded that starch was already fermented in the stomach and small intestine. Varloud et al. (Reference Varloud, Fonty, Roussel, Guyonvarch and Julliand2007) observed an increase in microbial activity in the equine stomach within 60 min after feed intake. The increase in microbial activity was accompanied by increasing glucose concentrations in the stomach chyme, which were five times higher at that time than in the initial fraction of the ingested feed, suggesting the presence of starch-degrading activity by the microbial population.
However, it seems that the level of starch intake selected in the current study (2 g starch/kg BW per meal) does not cause any health problems, even though some starch is supposed to be fermented in the large intestine. This is in accordance with other studies in which the safe intake of concentrates was limited to a maximum of 2 g starch/kg BW or 0.5 kg concentrate/100 kg BW (Potter et al., Reference Potter, Arnold, Householder, Hansen and Brown1992).
In the present study, the highest glucose (P = ns) and insulin responses (P < 0.05) were observed for feeding hay ad libitum during the blood sampling period (hay intake; Table 2), with a trend for higher glucose and insulin responses when hay was withheld the night before the blood sampling procedure (−CC+). Furthermore, basal insulin levels did not revert during the blood sampling period within 510 min after CC intake when hay was fed during the observation period (diets +CC+ and −CC+).
These results, however, stand partly in contrast to other findings. Recent studies suggest that small amounts of dietary fiber (∼1 kg alfalfa, or 60 g purified pectin or ∼120 g purified lignocellulose) added to a starchy meal (2 g starch/kg BW) did not significantly affect glucose and insulin responses (Vervuert et al., Reference Vervuert, Klein and Coenen2008b and Reference Vervuert, Voigt, Hollands, Cuddeford and Coenen2008c). One likely explanation for the differences in glycaemic and insulinaemic responses might be related to a higher soluble carbohydrate intake resulting from the hay intake. In the present study, sugar content (glucose and sucrose) in the hay was 35 g/kg DM, and the horses consumed a mean of 180 g sugar from hay intake during the blood sampling period. In general, hay is considered to be low glycaemic (Rodiek and Stull, Reference Rodiek and Stull2007), but systematic investigations considering differences in soluble carbohydrate content in hay are lacking. Similar to our results, Cottrell et al. (Reference Cottrell, Watts, Duarte and Ralston2005) reported decreased soluble sugar content in hay after soaking in water; furthermore, when this hay was fed to horses, their glycaemic and insulinaemic responses were lower.
In addition, hay intake during the blood sampling period will cause dilution of the corn starch and probably prolong its digestion in the small intestine. The digesta passage rate through the pre-caecal part of the gastrointestinal tract is variable depending on such factors as the quantity of food consumed, the rate of food consumption and the type of food ingested (Martin-Rosset et al., Reference Martin-Rosset, Doreau, Boulot and Miraglia1990; Miraglia et al., Reference Miraglia, Poncet and Martin-Rosset1992; McLean et al., Reference McLean, Hyslop, Longland, Cuddeford and Hollands2000).
In studies from ruminants, SCFAs seemed to have stimulatory effects on insulin. Propionate and butyrate are supposed to increase insulin through receptor activation independently of glucose concentration (Sano et al., Reference Sano, Tano, Takahashi and Terashima1995; Matsunaga et al., Reference Matsunaga, Arakawa, Goka, Nam, Ohneda, Sasaki and Katoh1999). The intake of hay during the blood sampling period provided more fermentable substrate, resulting in an increased production of SCFAs (Hussein et al., Reference Hussein, Vogedes, Fernandez and Frankeny2004). In horses, little is known about the effect of SCFAs on insulin activation. Under in vitro conditions, equine pancreas perfusion with butyrate stimulated insulin secretion in the absence of glucose, whereas acetate or propionate perfusion failed to stimulate insulin secretion (Holley and Evans, Reference Holley and Evans1979). In addition, Argenzio and Hintz (Reference Argenzio and Hintz1971) reported a significant rise in insulin after butyrate infusion in fasted ponies (fasted for 72 h), but propionate infusion did not affect plasma insulin levels (Argenzio and Hintz, Reference Argenzio and Hintz1971). From the present study, it remains open as to whether SCFA, especially acetate as the main fermentation product by hay feeding (Schwabenbauer et al., Reference Schwabenbauer, Meyer and Lindemann1982), would be a significant insulinogenic factor under physiological conditions like hay feeding.
In general, there was a trend for slower intake time of CC when hay was offered ad libitum the night before. The impact on CC intake seemed to be strongly related to satiety (Bochnia et al., Reference Bochnia, Vervuert and Coenen2008). To offset the problems associated with the rapid consumption and episodic feeding of the concentrate, it is common practice to recommend that roughage (grass meal or hay) be fed before the concentrate (Meyer and Coenen, Reference Meyer and Coenen2002). However, a trend for lower insulin responses was found for both diets that offered hay the night before CC feeding compared with feed deprivation for the respective treatments (+CC+ v. −CC+).
It cannot be excluded that the differences in intake time of CC might influence glycaemic and insulinaemic responses as well, for example, by affecting the mean retention time of CC in the stomach (Vervuert et al., Reference Vervuert, Voigt, Hollands, Cuddeford and Coenen2008c).
General comment
Data from humans and animal species clearly indicate that glycaemic and insulinaemic responses are affected by several factors including the individual subjects’, amount of starch intake, speed of gastric emptying, rate of passage through the gastrointestinal tract, enzyme availability, and others. A standardised methodology should be developed for the estimation of glycaemic and insulinaemic responses in feedstuffs for horses to make it possible to compare the results of different research groups. While an authorised glycaemic index methodology has been established for humans (Brouns et al., Reference Brouns, Bjorck, Frayn, Gibbs, Lang, Slama and Wolever2005), a standardised protocol for horses has not, and a round-table discussion with equine researchers has thus far failed to develop one.
Acknowledgements
The authors would like to thank Jana Tiedtke for technical assistance.