Introduction
The personal social networks of older people are comprised of their close social relationships, usually family members, friends, and other close confidants (Wrzus et al., Reference Wrzus, Hänel, Wagner and Neyer2013). Personal networks are linked with mental health, insofar as they are the most accessible source of social support, they improve one's self-esteem, enable access to resources and facilitate coping with stressful life event (Cohen and Wills, Reference Cohen and Wills1985; Berkman et al., Reference Berkman, Glass, Brissette and Seeman2000; Thoits, Reference Thoits2011). However, networks are dynamic constructs that undergo transitions in old age. Consequently, attention should be paid to the mental health outcomes of such network changes (Berg et al., Reference Berg, Hoffman, Hassing, McClearn and Johansson2009; Houtjes et al., Reference Houtjes, van Meijel, van de Ven, Deeg, van Tilburg and Beekman2014). Research in this area requires understanding of the internal processes within the networks, particularly the dynamics of losses and gains of close ties (Cornwell and Laumann, Reference Cornwell and Laumann2015). The current analysis considers these internal changes in detail and focuses on two key aspects in the domain of interpersonal relations: the emotional closeness and contact frequency with both lost and newly added confidants in relation to mental health over time.
The association between social networks and mental health is well-documented in cross-sectional studies, as well as prospective studies of mental health changes (Kawachi and Berkman, Reference Kawachi and Berkman2001; Santini et al., Reference Santini, Koyanagi, Tyrovolas, Mason and Haro2015). Although these studies provide important insights, they mostly treat social networks as a static construct and measure them at one time point only. Social networks are dynamic, however, and undergo various transformations in old age (Krause, Reference Krause1999; Shaw et al., Reference Shaw, Krause, Liang and Bennett2007). While some studies do inspect social network changes and mental health, they mostly measure the overall social network by assessing changes in global factors such as social network size (Berg et al., Reference Berg, Hoffman, Hassing, McClearn and Johansson2009; Houtjes et al., Reference Houtjes, van Meijel, van de Ven, Deeg, van Tilburg and Beekman2014). These overall changes can mask more complex dynamics, as some social ties are lost over time while others are newly recruited. These processes can occur either independently of each other or simultaneously (Cornwell and Laumann, Reference Cornwell and Laumann2015), and should be examined separately as different processes having potentially different effects on mental health. New ties can lead to improved mental health by increasing one's access to social resources and activities, as well as providing practical and emotional help (Glass et al., Reference Glass, De Leon, Bassuk and Berkman2006). Losing close social relationships, on the other hand, can impair mental health due to loneliness and reduced access to resources and support (Thoits, Reference Thoits2011). A recent study demonstrated the importance of these processes by showing the physical and mental health benefits of network growth, via the addition of new confidants (Cornwell and Laumann, Reference Cornwell and Laumann2015).
These findings shed light on the effects of internal turnover on mental health. However, the effects may be more nuanced than is implied by measuring the number of lost and added confidants. Transitions in mental health may also be influenced by the quality of the network, as well as the frequency of interaction with its members (Litwin et al., Reference Litwin, Stoeckel and Schwartz2015; Windsor et al., Reference Windsor, Rioseco, Fiori, Curtis and Booth2016). The quality of one's social relationships may be particularly important, with some evidence suggesting its dominant role in relation to mental health outcomes (Pinquart and Sörensen, Reference Pinquart and Sörensen2000; Schwarzbach et al., Reference Schwarzbach, Luppa, Forstmeier, König and Riedel-Heller2014) (with some exceptions, see for example Litwin, Reference Litwin2011, who found that network type, and not network quality, was related to depressive symptoms among older adults). The explanation for this dominance suggests that emotionally close relationships tend to provide positive appraisals and support, while the mere presence of social contacts can also act as a source of conflict and strain (Pinquart and Sörensen, Reference Pinquart and Sörensen2000).
The characteristics of the relationships with lost and newly added confidants can reflect different types of change processes with possibly different mental health outcomes. For example, new confidants may be added to one's social network when spending time at senior centers, but if they are superficial ties, they may contribute little to one's happiness. In contrast, new ties may be formed in order to provide needed support to the older adult in question, in which case they may be considered emotionally meaningful and have a positive influence on mental health (Zettel and Rook, Reference Zettel and Rook2004). Similar processes may occur for lost ties. Peripheral confidants can be discarded in a voluntary process due to a desire to focus on more meaningful relationships, thereby exerting a smaller influence on mental health (Carstensen, Reference Carstensen2006). Conversely, losing important ties may be less voluntary, such as following the confidant's death or illness, and this may be experienced as a hurtful loss (Zettel and Rook, Reference Zettel and Rook2004).
Considering this brief review, the current inquiry examines social networks’ internal turnover and subsequent mental health in late life. It goes beyond a count of the lost and added confidants and assesses the nature of the relationship with the ties in question, namely their emotional closeness and contact frequency. Our first hypothesis is that these attributes will explain mental health beyond the count of changed confidants. Our second hypothesis is that this association with mental health will be particularly pronounced for emotional closeness with the social network members.
Methods
Data were obtained from the Survey of Health, Aging and Retirement in Europe (SHARE), a longitudinal survey that is based upon probability samples of community dwelling individuals aged 50 years and above who have their regular domicile in the participating country. A person was excluded if she or he was incarcerated, hospitalized or out of the country during the survey period, unable to speak the country's language(s) or moved to an unknown address. In addition, partners who lived with the respondents were interviewed regardless of their age (Börsch-Supan et al., Reference Börsch-Supan2013). The present study focused on the fourth and sixth waves of SHARE, administered in 2011 and 2015, since social network data were collected only during these two waves. The analytical sample included respondents from the 14 countries that participated in the two waves of data collection: Austria, Germany, Sweden, Spain, Italy, France, Denmark, Switzerland, Belgium, Czech Republic, Poland, Portugal, Slovenia, and Estonia. The analysis was limited to those who were 65 years or older at the time of the first measurement (2011). A total of 16,860 respondents over the age of 65 years answered the survey in 2011 and again four years later. The final analytic sample was limited to participants with full data on the study variables who had a social network in Wave 4, and thus are comprised of 14,101 respondents.
Since not all participants were retained across the two study measurements, we conducted an attrition analysis. This was performed by a logistic regression which used selected socio-demographic and health characteristics in Wave 4 to predict respondents’ participation in Wave 6. These variables were age, gender, partner status, education, financial distress, self-perceived health, mobility limitations, and a generalized cognition score (elaborated upon later). The analysis showed that respondents who dropped out between the waves were significantly (p < 0.05) more likely to be older, male, have secondary, or higher education, to have a partner, and report worse physical and cognitive health, that is report lower self-perceived health, more mobility limitations, and obtain a lower cognitive score. We adjusted for the attrition bias by using weights (additional explanations are shown later).
Study variables
Mental health was assessed using positive and negative indicators (Keyes, Reference Keyes2007). Negative mental health was represented by the Euro-D, a 12-item measure meant to count late life depressive symptoms. It was developed to allow for comparison of depressive symptoms across European countries, and has been shown to have good validity (Prince et al., Reference Prince1999). Each item in the scale describes a symptom possibly experienced in the past month, and respondents can reply “yes” or “no.” The scale items are depressed mood, pessimism, wishing death, guilt, sleep, interest, irritability, appetite, fatigue, concentration, enjoyment, and tearfulness. A score of four or more symptoms is considered as a cut-off point to identify major depression (Guerra et al., Reference Guerra, Ferri, Llibre, Prina and Prince2015). A minimum of ten completed items was required for using the score, such that scores with 10–11 complete items were interpolated (Palgi et al., Reference Palgi, Shrira and Zaslavsky2015). Due to high positive skewness of the variable it was log transformed before entering the regression models.
Positive mental health was measured using the CASP-12 scale for perceived quality of life in old age (Knesebeck et al., Reference Knesebeck, Wahrendorf, Hyde and Siegrist2007). The scale items encompass four quality of life domains: control, autonomy, self-realization, and pleasure. Each domain consists of three items inquiring about the frequency of experiencing a certain state, ranging from “often” (1) to “never” (4). Items phrased in a manner which reflects poor quality of life were reverse-coded, so that a higher score on all items meant higher quality of life, and the total scale has a range of 12–48. A score of 35 points or lower can indicate low quality of life (Adena et al., Reference Adena, Myck, Oczkowska, Börsch-Supan, Kneip, Litwin, Myck and Weber2015). We used scores with a minimum of 10 complete items by interpolating scores with 10–11 complete items, similarly to the Euro-D measure.
Social network data were collected via a name generating inventory for the compilation of social networks. This approach was introduced in the fourth wave of SHARE (Litwin et al., Reference Litwin, Stoeckel, Roll, Shiovitz-Ezra, Kotte, Malter and Borsch-Supan2013) and measured again four years later (2015). The inventory asks respondents to name up to seven persons with whom they discuss “important matters”. They are then asked to provide additional information about these confidants, such as their contact frequency and emotional closeness with them. Emotional closeness was probed by asking respondents “How close do you feel to (confidant's name)?” with answers ranging from “Not very close” (1) to “Extremely close” (4). Contact frequency was assessed by asking respondents “During the past twelve months, how often did you have contact with (confidant's name) either in person, by phone or mail, email or any other electronic means?” Response options ranged from (1) “Daily” to (7) “Never,” and were reverse coded such that higher scores indicated higher frequency of contact.
The changes within the network were evaluated during the second measurement of this inventory. After receiving the same questions as in the baseline measurement, respondents were asked to link the confidants they mentioned with those reported four years earlier. Following the identification of the 2015 roster (i.e. the list of persons named), respondents were shown a list of their baseline social network members, by name and role relationship. Participants were asked to indicate next to each of the persons just named the number they were assigned in the previous roster. This allowed us to identify for each social network member whether he or she was mentioned in both waves or just once. Confidants who were mentioned only at baseline were termed “lost,” and those who were mentioned only in the second measurement were labeled as “new.” We created a count score for both types of confidants by summing the number of “lost” and “new” confidants. The attributes of each type of confidant were assessed by creating categorical variables of “no such confidants,” “low closeness/contact,” and “high closeness/contact.” Respondents were coded as “high” closeness if their new/lost confidants had a mean emotional closeness score of 3–4 (“very close” – “extremely close”), and as “low” closeness if their new/lost confidants had a mean score lower than 3. They were coded as “high” contact if the mean score of contact frequency was 6–7 (“several times a week” – “daily”), and as “low” contact if the mean score was below 6.
We adjusted the analysis for a variety of variables that may potentially influence mental health changes. These were age, gender, education, marital status, self-rated health, mobility impairments, cognition score, and financial adequacy, all measured at baseline. The education measurement, based on the International Standard Classification of Education (ISCED), divided the respondents into two categories: primary schooling or less (ISCED-97 score = 0–2) and secondary education or above (ISCED-97 score = 3–6). Marital status divided the sample into those who had a partner at baseline, those who did not have a partner, and those who became widowed since baseline. Self-rated health was a single item with five possible responses that ranged from “poor” (1) to “excellent” (5). Health was also measured by the number of mobility, arm function, and fine motor limitations (0–10). A cognition score was based on tests of verbal recall and fluency. The verbal recall test sums up both immediate and delayed recall and ranges between 0 and 20. In the fluency test, respondents were asked to name as many animals as they could in 1 min. Since the total score was skewed, all scores greater than 45 were changed to 45. The scores of both cognition tests were standardized and their average score was used as the summary cognition score in the study. Financial adequacy was based on a subjective measure that asked the extent to which the respondent's household can make ends meet, with four response options ranging from “with great difficulty” (1) to “easily” (4). Finally, the analysis controlled for country of residence.
Statistical analysis
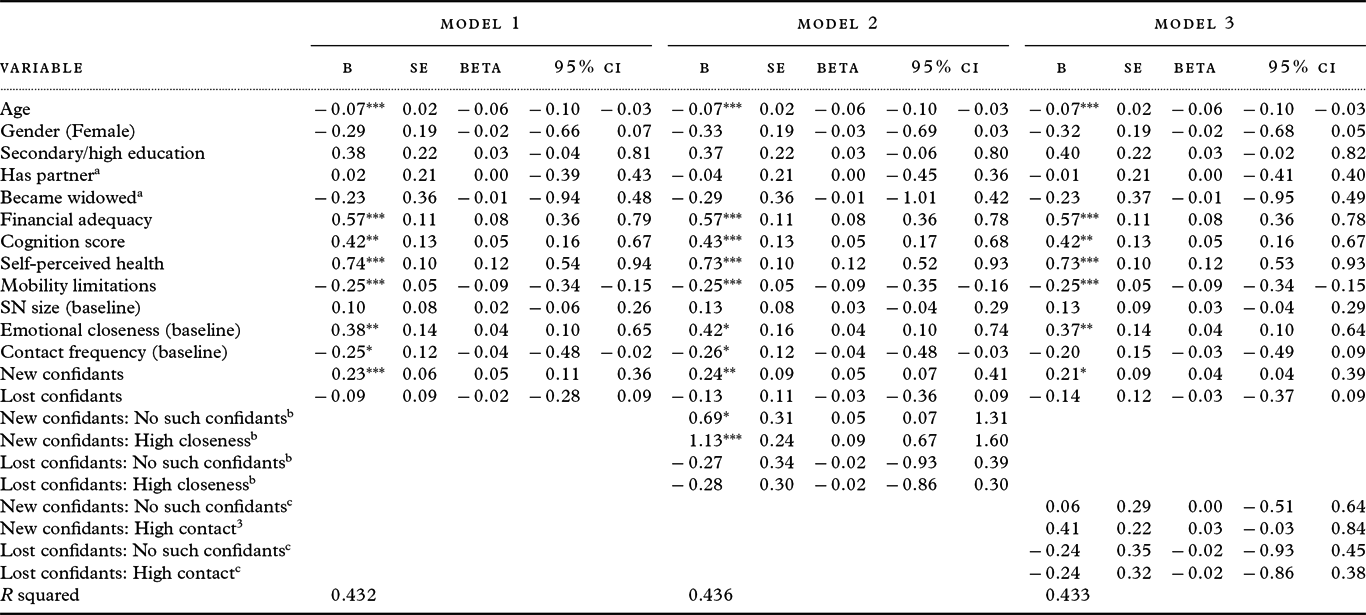
Data analysis was conducted using STATA 13 (StataCorp, 2013) and R version 3.3.2 (R Core Team, 2016). In the first stage of the analysis, a univariate description of the study variables was conducted. Next, the inquiry employed bivariate χ 2 analyses of the association between the emotional closeness and contact frequency of the lost and new confidants. Finally, multivariate OLS regression models were executed in which depressive symptoms and perceived quality of life in 2015 were regressed on their baseline measurement and on the other study variables. The first model for each outcome variable used the control variables and the count of new and lost confidants, as well as the baseline social network size, mean emotional closeness and mean contact frequency with social network members. The second model added the mean emotional closeness of lost and new confidants. The third model used the mean contact frequency with lost and new confidants.
All analyses were adjusted for sampling bias and attrition using individual sampling weights provided by SHARE. The baseline weights adjust for sampling bias and account for the different characteristics of persons who take part in the survey compared to the target population. They are calculated separately for each country and are calibrated against the total national population by age and gender. The study weights also need to account for attrition, since the respondents who dropped out from the study differed in their attributes from those who remained in both waves. This was done by calculating a dummy variable which indicates participation in follow-up among the baseline sample, and predicting that variable using a logistic regression with various socio-demographic and health factors. We then predicted the odds of respondents participating in both waves, and multiplied the inverse of this predicted probability by the baseline weights (For more information see Cornwell & Laumann, Reference Cornwell and Laumann2015).
Results
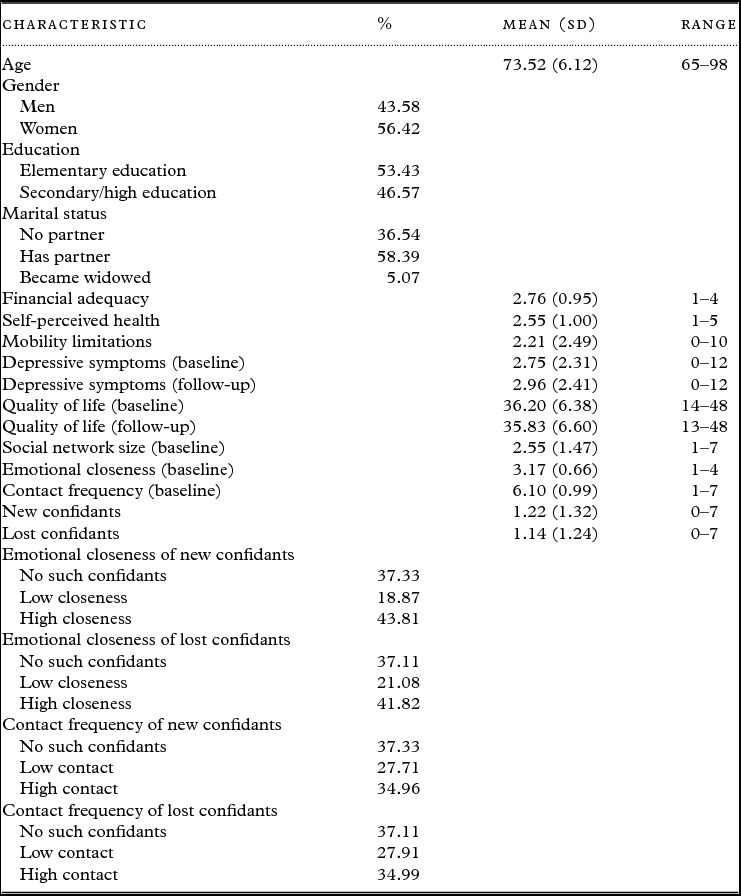
The background characteristics of the study sample are shown in Table 1. The respondents were aged 74 years on an average, with a slight majority of women, persons with elementary education, and persons who had a partner at baseline. They reported that their household could make ends meet “Fairly easily” and that they had “Good” health on average, and an average of two mobility limitations. They reported a mean of 2.75 depressive symptoms at baseline, which slightly increased to 2.96 at follow-up. Their average quality of life (CASP) score was 36.2 at baseline and 35.8 at follow-up.
Descriptive background characteristics of the sample (Weighted)

Table 1 also provides an overview of the personal social networks at baseline and of their internal turnover. At baseline, the average social network numbered 2.6 confidants. It had an average emotional closeness of 3.2 (“Very close”) and average contact frequency of 6.1 (“several times a week”). Over time 1.2 new confidants were added to the network, and slightly fewer confidants were not mentioned again (1.1). About 37% of respondents did not lose any confidants, and a similar percentage did not add any new confidants. Some 42% of the respondents reported losing confidants with high levels of emotional closeness, while a slightly higher percentage of 44 reported gaining confidants of high emotional closeness. Approximately 35% of respondents reported either losing or gaining confidants with high mean levels of contact frequency.
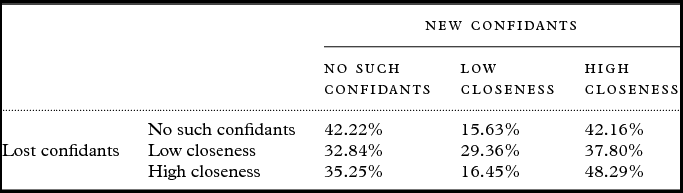
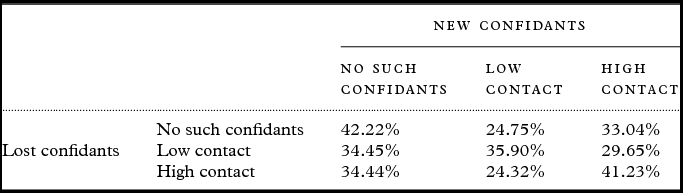
Table 2 presents a cross-tabulation of the emotional closeness of new and lost confidants. A χ 2 test indicated a linkage between the properties of lost confidants and new confidants (χ 2 (4) = 331.78, p < 0.001). Thus, older individuals tended to be consistent in their preferences, such that those who did not lose confidants were more likely not to add new confidants and those who lost confidants were more likely to add confidants with a similar emotional quality. For example, 48% of those who lost confidants of high emotional closeness added similarly close confidants, while a lower rate (38%) of those who lost confidants of low emotional closeness added confidants with high emotional closeness. However, these results also attest to the variability in the different combinations of lost and new confidants. For example, although 48% of those who lost confidants with high emotional closeness added similarly close confidants, 16% of them added confidants with low emotional closeness and 35% did not add new confidants at all. Therefore, these results also indicate that despite a general tendency for consistency, not all individuals were consistent in their preferences. For some respondents, the characteristics of the lost and newly added confidants were independent of each other. A similar trend can be seen in Table 3, among the contact frequency of lost and new confidants (χ 2 (4) = 278.31, p < 0.001).
Emotional closeness of lost and new confidants (Weighted)

Contact frequency of lost and new confidants (Weighted)

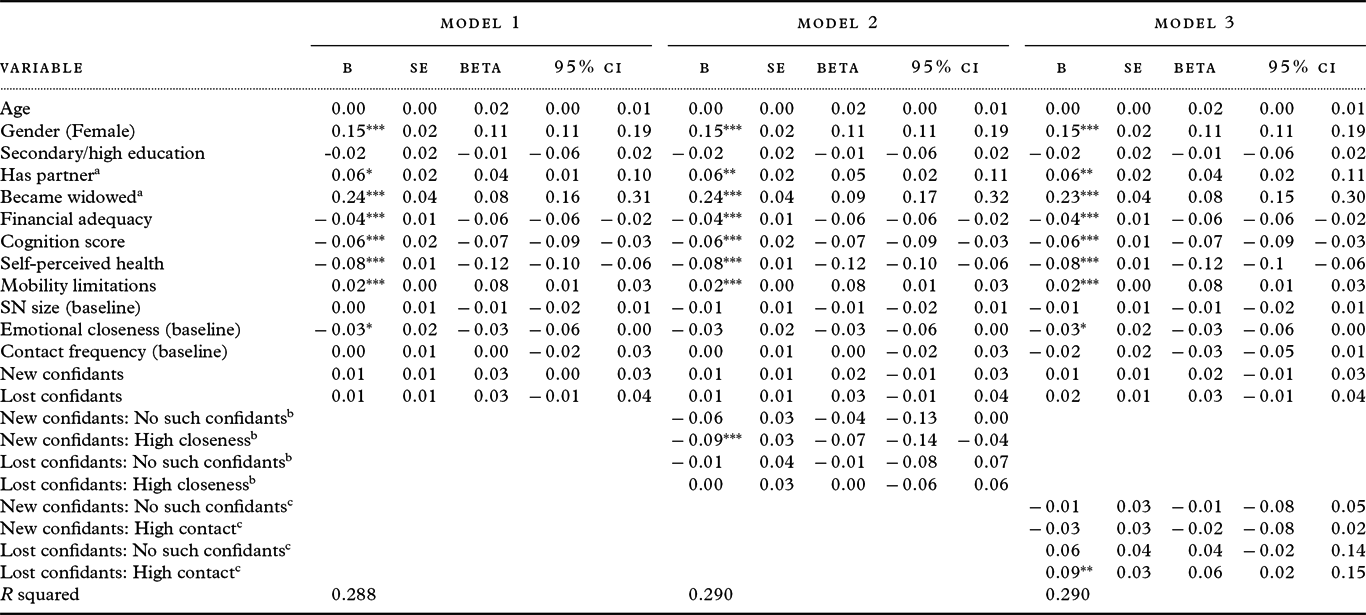
The regression models are shown in Tables 4 and 5, for depressive symptoms and perceived quality of life, respectively. The first model in Table 4 shows that depressive symptoms increased for women, for persons who had a partner at baseline and those who became widowed (compared to those without a partner), persons in worse financial status and worse cognitive and physical health. Baseline social network size and contact frequency were not related to depressive symptoms at follow-up, while lower mean emotional closeness was associated with increased depressive symptoms over time. Model 2 added emotional closeness with new and lost confidants and showed that adding new confidants with a high average emotional closeness was related to fewer depressive symptoms, compared to those who added new confidants with low emotional closeness. In fact, adding confidants with a low emotional closeness had a similar effect as not adding new confidants at all. The third model added contact frequency with lost and new confidants. It showed that losing confidants with a high average contact frequency was related to higher depressive symptoms.
OLS regressions of social networks and changes in log transformed depressive symptoms (Weighted)

Notes: aReference: No partner in both waves; bReference: Low mean emotional closeness; cReference: Low mean contact frequency; N = 14,101; Controlled for country, baseline dependent variable.
*p < 0.05.
**p < 0.01.
***p < 0.001.
OLS regressions of social networks and changes in quality of life (Weighted)

Notes: aReference: No partner in both waves; bReference: Low mean emotional closeness; cReference: Low mean contact frequency; N = 14,101; Controlled for country, baseline dependent variable.
*p < 0.05.
**p < 0.01.
***p < 0.001.
Table 5 predicts perceived quality of life over time. Model 1 shows that quality of life grew for persons of a younger age at baseline and those in a better financial, cognitive, and physical state. It also found better quality of life among respondents with better emotional closeness with their social network members and lower contact frequency at baseline, and among those who reported adding more new confidants to their social network. Model 2 showed that adding new confidants of high emotional closeness was related to better quality of life compared to adding confidants with low emotional closeness. Moreover, not adding confidants at all was also related to better quality of life in comparison to new confidants with low emotional closeness. Model 3 considered contact frequency with new and lost confidants, but these were not related to quality of life.
Discussion
The current paper examined the internal turnover within personal social networks in old age and their associations with mental health over time. The analysis was based upon data from a social networks module, measured in the fourth and sixth waves of SHARE. The module produced a list of older individuals’ close social ties as well as changes in citing these ties at both measurements. The results confirm the study's first hypothesis by showing that the nature of the relationship with the lost and new confidants was associated with mental health. Moreover, this association was found beyond a count of these confidants. The results further corroborate the second hypothesis. The emotional closeness with added or lost confidants had a generally consistent association with mental health, such that adding emotionally close confidants was associated with lower depression and higher quality of life. On the other hand, losing frequently contacted confidants was associated only with higher depressive symptoms.
The results underscore the relevance of internal turnover in personal social networks’ in old age and specifically the content of the relationship with confidants. Better quality of the relationship, in terms of emotional closeness or contact frequency, was associated with mental health over time. Losing or adding confidants with a less meaningful relationship had the same effect as not having lost or added confidants at all, and sometimes even a worse effect. The emphasis on the content of the relationships rather than on their existence echoes previous findings of a stronger and more consistent association of mental health with social networks’ quality compared to their structure (Pinquart and Sörensen, Reference Pinquart and Sörensen2000; Schwarzbach et al., Reference Schwarzbach, Luppa, Forstmeier, König and Riedel-Heller2014). The underlying logic is similar – simply having a relationship may not entail support. Losing confidants or gaining new close ties may not necessarily reflect changes in support and may not align with older adults' preferences. Assessing the relationship with these ties provides a deeper understanding of their contribution to mental health.
The addition of new confidants has emerged as a particularly relevant process in terms of mental health in late life. While network gains are explored less often, as research tends to focus on the losses experienced in old age, recent work has demonstrated their viability in relation to health (Cornwell and Laumann, Reference Cornwell and Laumann2015). The current work builds upon these findings and demonstrates the contribution of new ties to mental health, particularly the emotional closeness of these ties.
The emotional relationship with social ties has been emphasized by the Socioemotional Selectivity Theory, as it claims that older persons tend to actively focus on emotionally meaningful relationships (Carstensen, Reference Carstensen2006). Although the theory does not consider network additions, it is possible that adding emotionally meaningful ties occurs as part of a similarly active and deliberate process, thereby contributing to mental health. Conversely, confidants with a lower emotional significance may be added because of less willful processes, such as getting a formal caregiver following health declines. Thus, the current findings underscore the validity of adding new relationships that match older adults’ preferences of emotionally meaningful relationships.
The effects of network losses were pronounced only when losing frequently contacted relationships, while losing less-often contacted confidants had the same effect as not losing them at all. This finding may have a similar explanation as the effect of adding high quality confidants, and similarly underscore a distinction between voluntary processes and those occurring against one's will. Less frequently contacted ties may have been lost due to their lesser importance, reflecting a desire to focus on the more meaningful ties, as suggested by the Socioemotional Selectivity Theory (Carstensen, Reference Carstensen2006). Thus, losing these ties had no mental health repercussions. Losing frequently contacted confidants, on the other hand, may have been contradictory to the desire to focus on the meaningful relationships. These confidants may have been lost in a non-voluntary process, such as due to illness or death. These losses go beyond the effect of spousal loss, as the models controlled for becoming widowed. Somewhat surprisingly, mental health was not related to the emotional closeness of lost confidants. This may indicate that losing someone who was frequently contacted leaves a gap in daily life, regardless of the emotional content of the interactions.
The two mental health indicators in the current analysis, perceived quality of life and depressive symptoms, differed slightly in their social network predictors. While both were related to the emotional closeness of new ties, the addition of new confidants was related only to the quality of life measure, whereas depressive symptoms were related also to network losses. This can attest to differences between the positive and negative aspects of mental health, as they are overlapping but different aspects of the same concept (Keyes, Reference Keyes2007). It may be that depressive symptoms, which represent the negative aspects of mental health, are more sensitive to losses (Kennedy et al., Reference Kennedy, Foy, Sherazi, McDonough and McKeon2007). Positive mental health, on the other hand, may be more sensitive to gains and improvements in one's life (Lyubomirsky et al., Reference Lyubomirsky, King and Diener2005). This emphasizes the need for a fuller account of mental health when considering social relationship transitions, and calls for further joint exploration of its different aspects.
The main limitation of the current study is the issue of endogeneity, and it is possible that the findings reflect some degree of mental health influencing social network turnover. For example, people with worse mental health may be less prone to create new ties of high quality (Kennedy et al., Reference Kennedy, Foy, Sherazi, McDonough and McKeon2007). Future studies can shed more light on this issue by using three time points or a different methodology. Nevertheless, this limitation does not impair the value of identifying internal dynamics in social changes among older adults and their mental health associations. In addition, the current study focused on the dynamic aspects of the network, and does not consider the stable confidants which were present at both measurements. Therefore, the results provide a partial account of social networks over time, as the emotional closeness and contact frequency of stable ties may also have mental health repercussions. We note, in this regard, that supplementary analyses that included the stable aspects came up with similar patterns for the changed confidants. Future studies should thus explore the inter-relationships of the changing and stable aspects of social networks in later life.
In conclusion, the results from the present study indicate the positive mental health implications of adding emotionally close new confidants to older adults’ social milieus, and the negative effects of losing frequently contacted confidants. The practical significance of these findings lies in highlighting the importance of the content of older adult's changing relationships. Practitioners are advised to pay attention to the quality of these relationships, as lost or new ties of high quality can have mental health consequences. The findings suggest the need for social interventions that promote emotionally meaningful new ties or strengthen the emotional relationships with distant ties, and the adoption of such interventions as potential avenues of improving mental health in old age.
Conflict of interest
None.
Description of authors’ roles
E. Schwartz designed the study, constructed the analytic sample, performed the statistical analyses, and wrote the final manuscript. H. Litwin gave critical comment and edited the final manuscript.
Acknowledgments
The SHARE data collection has been primarily funded by the European Commission through FP5 (QLK6-CT-2001-00360), FP6 (SHARE-I3: RII-CT-2006-062193, COMPARE: CIT5-CT-2005-028857, SHARELIFE: CIT4-CT-2006-028812) and FP7 (SHARE-PREP: No. 211909, SHARE-LEAP: No. 227822, SHARE M4: No. 261982). Additional funding from the German Ministry of Education and Research, the Max Planck Society for the Advancement of Science, the U.S. National Institute on Aging (U01_AG09740-13S2, P01_AG005842, P01_AG08291, P30_AG12815, R21_AG025169, Y1-AG-4553-01, IAG_BSR06-11, OGHA_04-064, HHSN271201300071C) and from various national funding sources is gratefully acknowledged (see www.share-project.org).