


1. Introduction
1.a. Statement of the problem
The Devonian–Carboniferous transition has long attracted attention owing to its link with one of the mass extinctions in the Earth's history, known as the Hangenberg Event (HE), which took place close to the Middle praesulcata Chron (late Famennian).
The HE is characterized by a strong diversity reduction of pelagic and hemipelagic faunas. This Event caused the extinction of more than 45% of marine genera (comp. Walliser, Reference Walliser and Walliser1996; Sepkoski, Reference Sepkoski and Walliser1996): most ammonoid groups disappeared (House, Reference House1985; Becker, Reference Becker1993), one conodont genus disappeared during and shortly after the Event, and about 50% of pelagic ostracod species also became extinct (Blumenstengel, Reference Blumenstengel1993). In contrast to the pelagic and hemipelagic faunas, neritic shallow-water organisms appear to have not been strongly affected. A gradual transition, rather than a sharp break, close to the Event boundary has been observed within corals, brachiopods, benthic ostracods, shallow-water conodonts and shallow-water bivalves (e.g. Simakov et al. Reference Simakov, Bless, Bouckaert, Conil, Gagiev, Kolesov, Onoprienko, Poty, Razina, Shilo, Smirnova, Streel and Swennen1983; Amler, Reference Amler1993). There were also miospore events, related to a progressive reduction of the swamp-margin environment during late Famennian time (Streel, Reference Streel and Königshof2009), that partly correspond to, and immediately succeeded, the HE. Recently the significance of the HE has been further enhanced by reports of higher than previously thought vertebrate extinction levels (over 50% of diversity) and restructuring of worldwide ecosystems (Sallan & Coates, Reference Sallan and Coates2010).
The HE is also characterized by an abrupt lithological change, observed in many sections within the pelagic facies realm. For instance, in the northern Rhenish Massif (Germany), the uppermost Famennian nodular limestone is sharply separated from the overlying Hangenberg Black Shale horizon, which is composed of a few tens of centimetres of black shale, which gives way upwards to the Hangenberg Sandstone and Shale that contains a high content of silt (Kaiser et al. Reference Kaiser, Becker, Steuber and Aboussalam2011). However, in many other sections ‘the Hangenberg-equivalent black shale’ is grey and silt material is missing. The Hangenberg Black Shale (HBS), though, is not universally developed, especially in shallow-marine environments, where only relatively weak sedimentary responses have been observed (e.g. Kalvoda & Kukal, Reference Kalvoda and Kukal1987; Steenwinkel, Reference Steenwinkel1993). Moreover, this latest Devonian Event in some places is also reflected in stratigraphic (partly erosional) gaps and/or condensed sequences recording a general drop in carbonate input (Matyja & Stempień-Sałek, Reference Matyja and Stempień-Sałek1994).
Some authors suggest correlation of the HE with a terminal Famennian short glacial episode, recognized in North America (Brezinski, Cecil & Skema, Reference Brezinski, Cecil and Skema2010), in South America (Isaacson et al. Reference Isaacson, Hladil, Shen, Kalvoda, Grader, Feist, Talent and Daurer1999, Reference Isaacson, Diaz-Martinez, Grader, Kalvoda, Babek and Devuyst2008) and in South Africa (Streel & Theron, Reference Streel and Theron1999). This cooling episode and glacigenic deposits were contemporaneous with a global sea-level drop. Other authors suggest correlation of the HE with globally synchronous regression and anoxia (initiated in the Middle praesulcata Chron), followed by a global transgression (marking the base of the Carboniferous), to explain the rapid facies changes, high contents of chalcophile elements and mass extinction (e.g. House, Reference House1985, Reference House2002; Walliser, Reference Walliser and Walliser1996). Widespread deposition of black marine shales has also been attributed to an increase in the influx of terrestrial organic matter. Vegetation on land that resembled modern extensive forests occurred first in Late Devonian time with the appearance of large tree-like plants such as Archaeopteris (comp. Meyer-Berthaud, Scheckler & Wendt, Reference Meyer-Berthaud, Scheckler and Wendt1999). A more extensive and deeper root system probably allowed these to colonize drier parts of floodplains and coastal lowlands and so transformed terrestrial, freshwater and marine ecosystems. Widespread wildfires, connected with O2 level increase (Scott & Glasspool, Reference Scott and Glasspool2006), also assumed widespread ecological importance at the end of the Devonian (Rowe & Jones, Reference Rowe and Jones2000), leading to increased soil erosion and nutrient supply to the oceans.
Multicausal explanations for the extinction events of this time have also been suggested as the anoxic event is not universally developed and some geochemical features of the HE are not present at all, or are even opposite, and evidence for isotopic shifts close to the Devonian/Carboniferous (D/C) boundary is equivocal (Kaiser, Steuber & Becker, Reference Kaiser, Steuber and Becker2008; Kaiser et al. Reference Kaiser, Becker, Steuber and Aboussalam2011). Therefore, Kaiser et al. (Reference Kaiser, Becker, Steuber and Aboussalam2011) suggested that the term multiphase Hangenberg crisis interval is more appropriate than the Hangenberg Event.
Much activity is currently directed towards more precise documentation of the Hangenberg crisis interval (e.g. Korn et al. Reference Korn, Belka, Fröhlich, Rücklin and Wendt2004; Brand, Legrand-Blain & Streel, Reference Brand, Legrand-Blain and Streel2004; Kaiser et al. Reference Kaiser, Steuber, Becker and Joachimski2006, Reference Kaiser, Becker, Spaletta and Steuber2009, Reference Kaiser, Becker, Steuber and Aboussalam2011; Marynowski & Filipiak, Reference Marynowski and Filipiak2007; Kaiser, Steuber & Becker, Reference Kaiser, Steuber and Becker2008; Azmy, Poty & Brand, Reference Azmy, Poty and Brand2009; Filipiak & Racki, Reference Filipiak and Racki2010; Marynowski et al. Reference Marynowski, Zatoń, Rakociński, Filipiak, Kurkiewicz and Pearce2012; De Vleeschouwer et al. Reference De Vleeschouwer, Rakociński, Racki, Bond, Sobień and Claeys2013; Myrrow et al. Reference Myrow, Ramezani, Hanson, Bowring, Racki and Rakociński2014). The advances in fine-scale stratigraphic studies of marine sedimentary sequences have been dependent upon integration of information from a wide range of stratigraphic techniques, in particular those combining high-resolution microfossil biostratigraphy with different instrumental methods, e.g. geochemical (Weissert, Joachimski & Sarnthein, Reference Weissert, Joachimski and Sarnthein2008) and petrophysical analyses (e.g. magnetic susceptibility measurements). Most previous investigations concentrated, however, on deeper marine facies where the Hangenberg crisis interval is manifested by the presence of HBS, often overlain by sandstones (e.g. Caplan & Bustin, Reference Caplan and Bustin1999; Kaiser et al. Reference Kaiser, Becker, Steuber and Aboussalam2011), and synchronous in widely separated regions. Their presence is explained by short-term global climatic fluctuations at the end of the Devonian Period.
By contrast, relatively shallow-water sequences have rarely been studied comprehensively (Kaiser et al. Reference Kaiser, Steuber, Becker and Joachimski2006), and few records of organic, inorganic and rock magnetic proxies have been obtained.
This paper describes the latest Famennian – earliest Tournaisian sedimentary history of a relatively shallow carbonate ramp environment within the Pomeranian Basin (NW Poland), where few changes in depositional conditions are observed close to the D/C boundary. This is in order to constrain the nature of the HE in such facies, where the HBS horizon is not developed. The Chmielno–1 borehole section, in which a complete sequence of the uppermost Famennian – lowermost Tournaisian has been recognized, was sampled in detail in order to establish a high-resolution biostratigraphic framework throughout this interval. As some geochemical proxies have become useful tools for both palaeoenvironmental reconstructions and stratigraphic correlations, we have employed some complementary techniques to infer the redox, sea-level and palaeoclimatic history of the Pomeranian Basin. Among the different methods available, the inorganic (major and trace elements and stable isotopes) and organic geochemistry are the most appropriate in this context. Analysis of the magnetic properties of rocks was also used to trace changes in terrigenous supply along the section: this may serve as an indicator of sea-level and climate fluctuations.
1.b. Geological setting and studied section
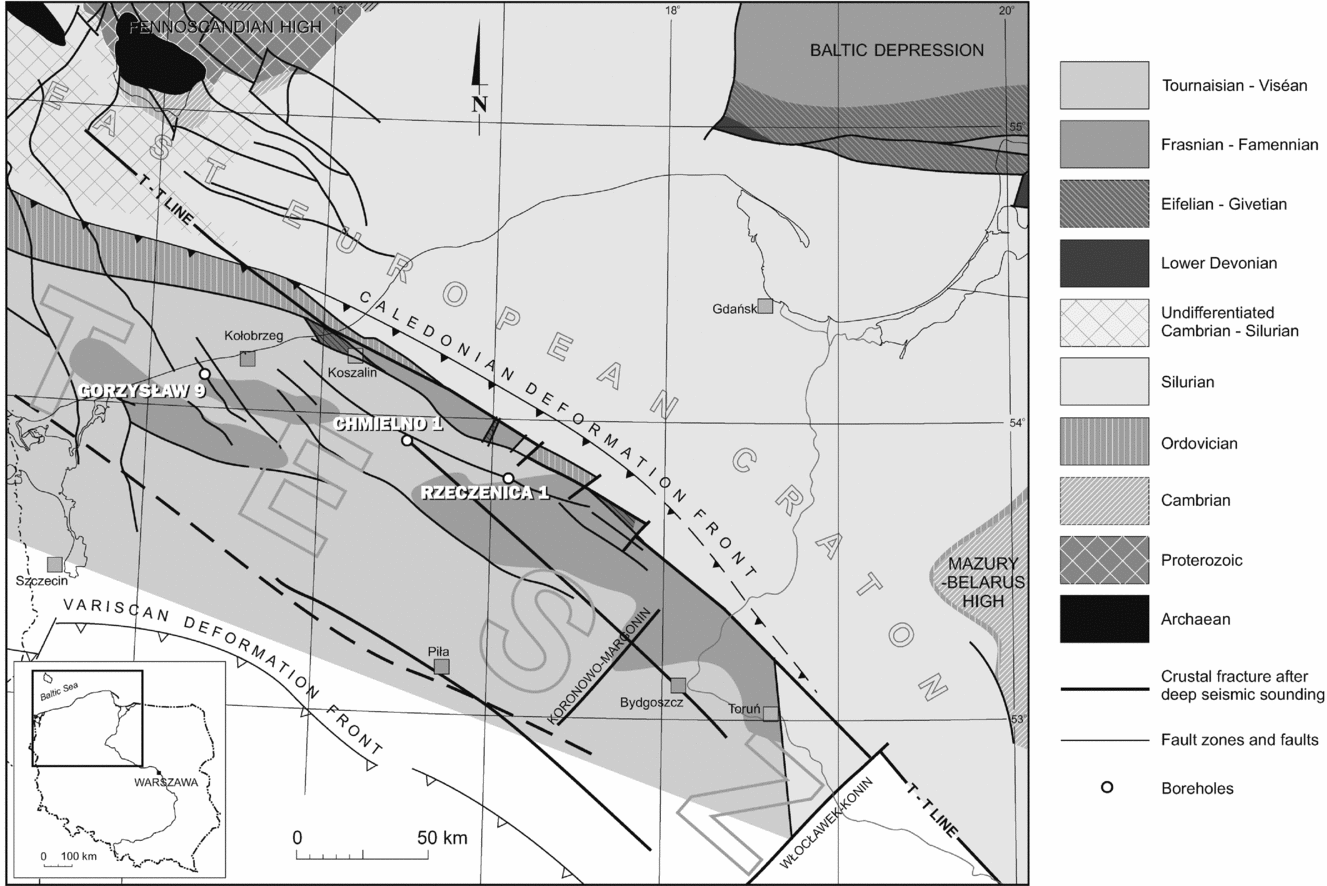
The Chmielno–1 borehole section is located in the northwestern part of Poland, in the Pomerania region. This area, buried under the thick Permian and Mesozoic/Cenozoic-age sequences of the Polish Basin, was, during its Devonian and Mississippian history, situated within the Trans-European Suture Zone (TESZ), and located along the margin of the stable East European Craton to the north and northeast, and the Variscan-influenced areas to the southwest (Fig. 1).
Simplified sub-Pennsylvanian geological map of northwestern Poland (Pomerania area) with location of selected boreholes; modified after Matyja (Reference Matyja, Matyja and Poprawa2006). TESZ – Trans-European Suture Zone.

The major palaeogeographic elements that affected the Devonian and early Carboniferous sedimentary evolution of the Pomeranian Basin were land areas representing uplifted parts of the East European Craton: the Fennoscandian High extending in the north, outside Poland, and the Mazury–Belarus High, situated in the east (Ziegler, Reference Ziegler1990; Fig. 1). The sedimentary evolution and lithofacies pattern of the Devonian and Mississippian Pomeranian Basin followed these main structural outlines and were generally associated with a gradual northward and eastward expansion of the marine basin, towards the East European Craton. However, the present-day extent of Devonian and Carboniferous deposits to the north and northeast is sharply delineated by the NW–SE-striking tectonic line corresponding to the margin of the East European Craton (Fig. 1) and does not reflect the natural northern and eastern limit of the Pomeranian Basin. Devonian and Mississippian deposits must have originally extended far onto the East European Craton, taking into account the spatial and temporal reconstructions of the facies pattern (Matyja, Reference Matyja, Aretz, Herbig and Somerville2008, figs 5–12; Matyja, Reference Matyja2009, figs 5–15). The extent of the Pomeranian Basin to the southwest is approximately coincident with the Variscan Deformation Front as suggested by Dadlez (Reference Dadlez1997).
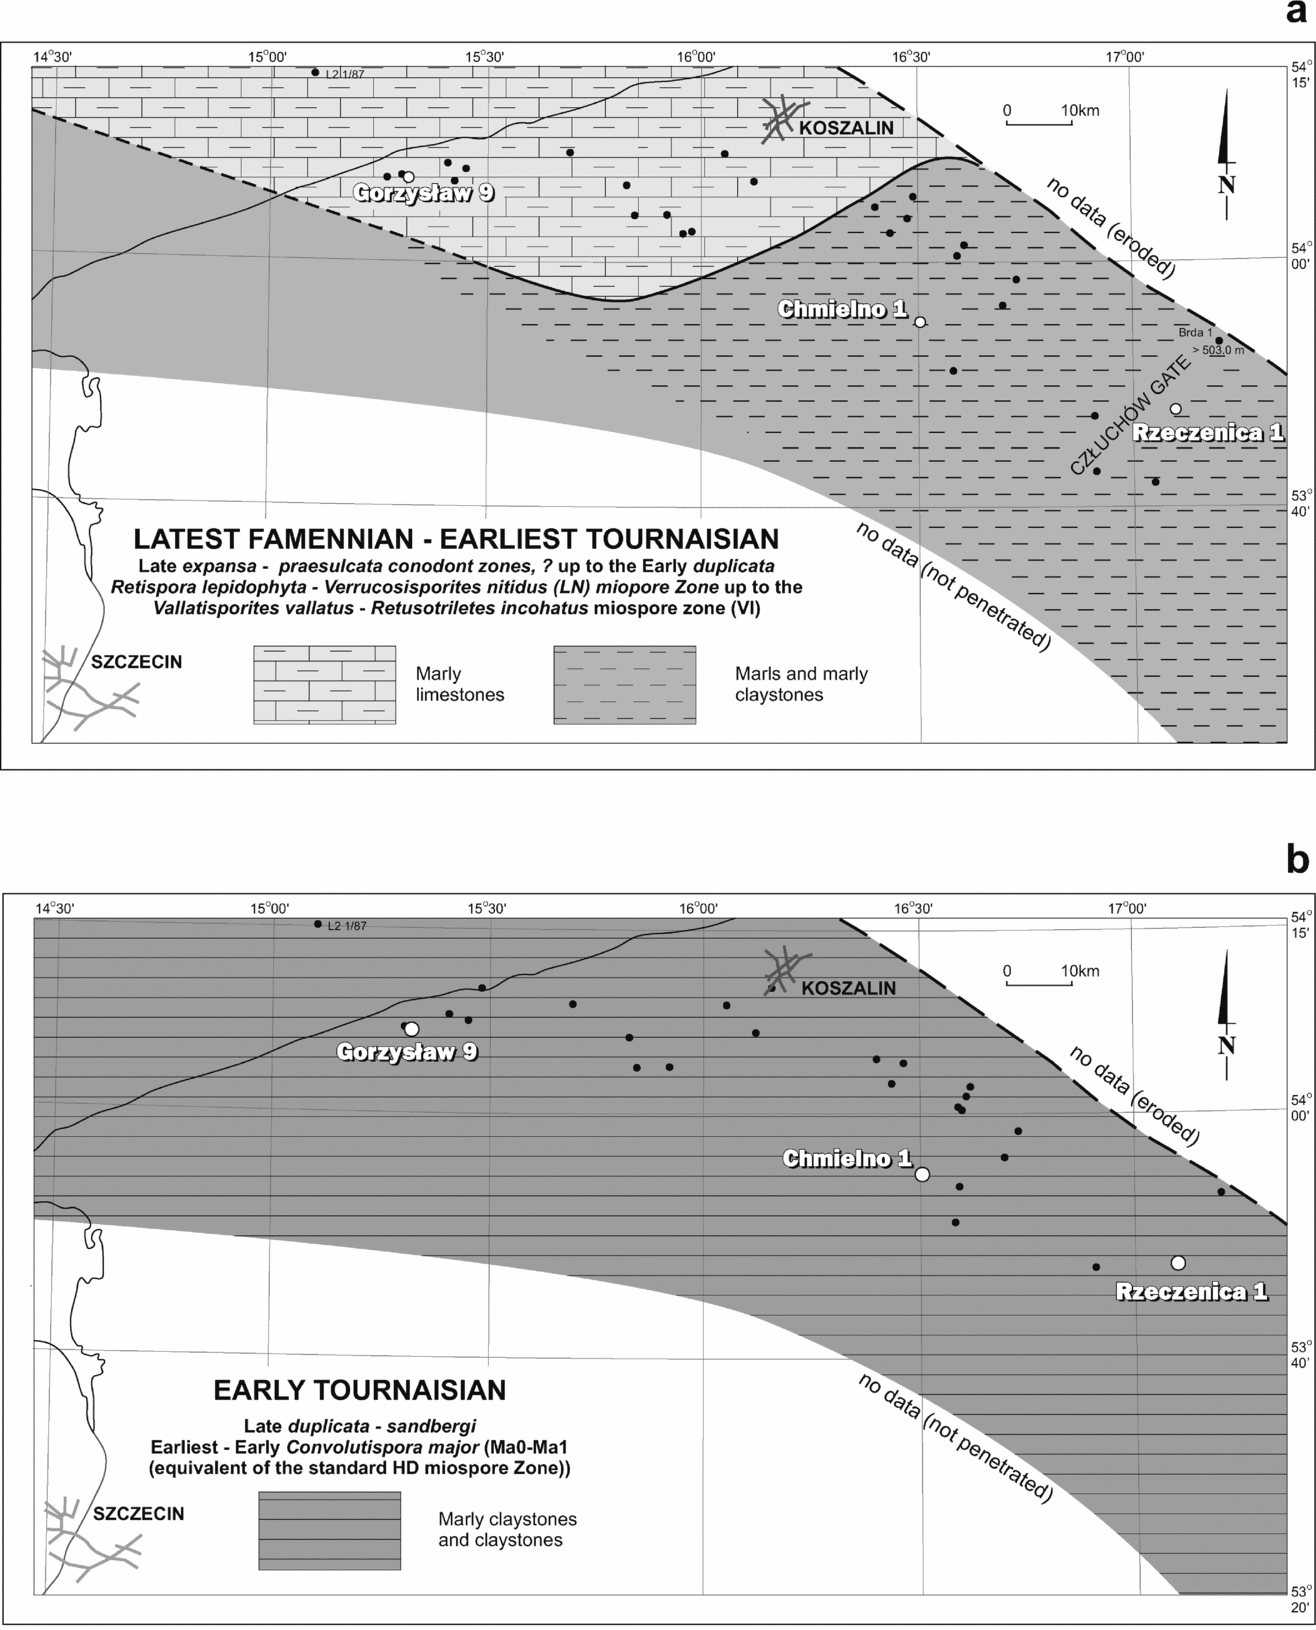
The upper part of the Famennian and lower part of the Tournaisian deposits in the Pomerania area belong to the Sąpolno Calcareous Shale Formation (Matyja, Reference Matyja1993), which is a succession of open-marine carbonate and clayey deposits (Fig. 2a, b), formed below wave base and probably corresponding to a relatively shallow carbonate ramp environment (Matyja, Reference Matyja, Matyja and Poprawa2006). The D/C boundary interval is marked, however, by monotonous, thin-bedded, dark grey marls, marly claystones and claystones, with only thin marly lime mudstone intercalations, which show a general absence of fauna (Matyja, Reference Matyja1993, Reference Matyja2009; Matyja & Stempień-Sałek, Reference Matyja and Stempień-Sałek1994). The skeletal abundance is restricted to entomozoid and conodont fragments. Only well-preserved miospores – land-derived palynomorphs – are common. Though the studied deposits in the Chmielno–1 section show a generally similar monotonous lithological pattern (Fig. 3), based on detailed core observations and geophysical logs we observed that the uppermost Famennian part of the section is more calcareous than the lowermost Tournaisian part, which is dominated by claystones.
Lithofacies pattern for the latest Famennian – earliest Tournaisian (a) and early Tournaisian (b) in northwestern Poland; modified after Matyja (Reference Matyja, Aretz, Herbig and Somerville2008, Reference Matyja2009).

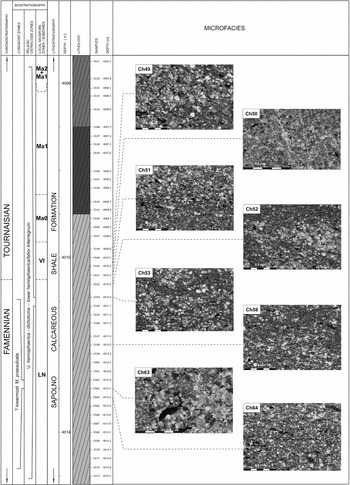
Microfacies across the Devonian/Carboniferous boundary interval in the Chmielno–1 borehole section – an example of a monotonous succession where the Hangenberg Black Shale horizon is not developed; constituent grains as well as rock fabrics allow recognition of grey marls (Ch 64, Ch 58, Ch 53, Ch 52, Ch 51, Ch 49) and more or less marly limestones (Ch 63, Ch 50) with relatively high amounts of silt and organic matter.

2. Materials and methods
The Chmielno-1 borehole section was sampled for biostratigraphy, microfacies observations, mineralogy and geochemistry as well as for magnetic susceptibility measurements. Ninety-three samples (Ch 1–Ch 93) at ~ 20 cm intervals were collected from the depth range 3999.0–4019.0 m.
2.a. Biostratigraphical analysis
Claystones and marly claystones as well as marlstones and marly limestones were sampled for conodonts and palynomorphs, considered among the leading fossil groups in terms of biostratigraphical utility. Thirty-two core samples (Ch 37–Ch 68) were processed from the depth range of 4007.2–4014.0 m for conodonts, and standard procedures were employed (e.g. Stone, Reference Stone and Austin1987; Barnes et al. Reference Barnes, Zhang, Jeppson, Fredholm, Varker, Swift, Merrill, Dorning and Austin1987; Merill et al. Reference Merrill, Swift, Ryley, Barnes, O’Brien, Varker, Stone, Saunders, Fredholm, Jeppson and Austin1987), using acetic and monochloroacetic acids to dissolve samples and extract conodonts.
Thirty-six samples (Ch 33–Ch 68) were processed for palynomorphs from almost the same core depth interval (4006.1–4014.0 m). Standard laboratory procedures were employed (Wood, Gabriel & Lawson, Reference Wood, Gabriel, Lawson, Jansonius and McGregor1996). Samples were crushed and immersed in hydrochloric acid to remove carbonates. Subsequently, the mineral matter was dissolved in hydrofluoric acid, and the organic residues were oxidized using fuming nitric acid. This was followed by heavy liquid flotation using a solution of zinc chloride of a specific weight of 2.2 g cm−3. Three slides were prepared from each residue (in total 87 slides), using elvacite or glycerine jelly. Twenty-eight samples were palynologically productive and almost all of these contained adequate palynological material for biostratigraphical analysis. The palynological slides and residues are housed at the Polish Geological Institute – National Research Institute in Warsaw.
2.b. Microscopy and geochemistry
Eighteen thin-sections were used for microfacies observations (Ch 31, Ch 32, Ch 36, Ch 40, Ch 41, Ch 42, Ch 44, Ch 48, Ch 49, Ch 50, Ch 51, Ch 52, Ch 53, Ch 56, Ch 58, Ch 63, Ch 64 and Ch 79).
Mineralogical identifications of the detrital fraction and measurements of a few tens of pyrite framboids in five polished samples (Ch 31, Ch 42, Ch 48, Ch 56 and Ch 79) were made under a Leo Scanning Electron Microscope with back-scattered electron (BSE) detector at the Polish Geological Institute – National Research Institute (Warsaw, Poland).
Major and trace elements were determined on eight selected samples by X-ray fluorescence (XRF). Analyses were performed on a Philips PW 2400 spectrometer with 10% accuracy at the Central Chemical Laboratory of the Polish Geological Institute – National Research Institute (Warsaw, Poland).
Twenty whole-rock samples of marly mudstones and claystones, from the interval 3999.0–4018.2 m, were analysed for carbon and oxygen stable isotopes in the Light Stable Isotopes Laboratory of the Institute of Geological Sciences and Institute of Palaeobiology, Polish Academy of Sciences (Warsaw, Poland).
The carbonate powder for analysis was extracted with a microdrill and decomposed under a vacuum in 100% orthophosphoric acid for 24 hours at 25°C. Released CO2, after freezing it out from the separation line, was analysed on a Finnigan MAT Delta Plus gas mass spectrometer. The standard error of the spectrometer measurements was 0.02‰. All carbon isotope values are reported in per mil relative to the Vienna Pee Dee Belemnite (V–PDB). The precision (reproducibility of replicate analyses) of both carbon and oxygen isotope analyses was usually better than ±0.1‰. Data are normalized to the V–PDB scale using National Bureau of Standards NBS-19 (δ18 O = −2.20‰ and δ13C = 1.95‰).
Total carbon contents (TC), total inorganic carbon contents (TIC) and total sulphur contents (TS) were measured for 17 samples by using an Eltra CS–500 IR-analyser with a TIC module. TC and TIC contents were determined by using an infrared cell detector on CO2 gas. Total organic carbon (TOC) was calculated as being the difference between the TC and TIC results. Calibration was made by means of the Eltra standards, with analytical precision and accuracy being better than ±2% for the TC data and ±3% for the TIC data.
Sixteen cleaned and powdered samples were Soxhlet-extracted with dichloromethane in pre-extracted thimbles. The extractable organic matter (EOM) was further separated by thin layer chromatography (TLC) using pre-washed plates coated with silica gel (Merck, 20 × 20 × 0.25 cm). Prior to separation, the TLC plates were activated at 120°C for one hour and were then loaded with the dichloromethane soluble fraction and developed with n-hexane. Aliphatic hydrocarbon (Rf 0.6 to 1.0), aromatic hydrocarbon (Rf 0.05 to 0.6) and polar compound (Rf 0.0 to 0.05) fractions were eluted and extracted from the silica with dichloromethane. The aliphatic and aromatic fractions of all the samples were then analysed in further detail by gas chromatography–mass spectrometry (GC–MS). Analyses were performed at the Faculty of Earth Sciences, University of Silesia in Sosnowiec.
The GC–MS analyses were carried out with an Agilent 6890 Series Gas Chromatograph interfaced to an Agilent 5973 Network Mass Selective Detector and Agilent 7683 Series Injector (Agilent Technologies, Palo Alto, CA). A 0.5 μL sample was introduced into the cool on-column injector under electronic pressure control, with helium (6.0 Grade) being utilized as the carrier gas at a constant flow rate of 2.6 mL min−1. The GC separation was on either of two fused-silica capillary columns:
-
(1) J&W HP5–MS (60 m × 0.32 mm i.d., 0.25 μm film thickness) coated with a chemically bonded phase (95% polydimethylsiloxane and 5% diphenylsiloxane). The GC oven temperature was programmed from 40°C (isothermal for one minute) to 120°C at a rate of 20°C min−1, then to 300°C at a rate of 3°C min−1, the final temperature being held for 35 min.
-
(2) J&W DB35–MS (60 m × 0.32 mm i.d., 0.25 μm film thickness) coated with a chemically bonded phase (65% polydimethylsiloxane and 35% diphenylsiloxane). The GC oven temperature was programmed from 50°C (isothermal for one minute) to 120°C at a rate of 20°C min−1, then to 300°C at a rate of 3°C min−1, with the final temperature being held for 45 min.
The GC column outlet was connected directly to the ion source of the mass spectrometer and the GC–MS interface was kept at 280°C, whilst the ion source and the quadrupole analyser were at 230°C and 150°C, respectively. Mass spectra were recorded from m/z 45–550 (0 to 40 min) and m/z 50–700 (above 40 min), with the mass spectrometer being operated in the electron impact mode (ionization energy 70 eV).
The abundances of the selected polycyclic aromatic hydrocarbons (PAHs) were calculated by comparisons of peak areas for internal standards (9-phenylindene) with the peak areas of the individual hydrocarbons obtained from the GC–MS ion chromatograms. Analyses were performed at the Faculty of Earth Sciences, University of Silesia in Sosnowiec.
2.c. Rock magnetic measurements
Rock magnetic measurements were performed in the Palaeomagnetic Laboratory of the Polish Geological Institute – National Research Institute in Warsaw, and at the Institute of Geophysics, Polish Academy of Sciences in Warsaw. Magnetic susceptibility (MS) for 93 samples (sampled every 0.2 m, if possible) from the Chmielno–1 section was measured on a Kappabridge KLY–2 (Geofyzika, Brno) at a frequency of 920 Hz and a sensitivity of 4 × 10⁻⁸ SI. The results obtained were normalized to the sample weight and expressed in m3 kg−1. In order to characterize the magnetic mineralogy, anhysteretic remanent magnetization (ARM) and isothermal remanent magnetization (IRM) of all of the samples were measured. These parameters are dependent on the ferromagnetic grain sizes and concentrations. ARM was applied by means of an AF demagnetizer (Molspin Ltd, United Kingdom). An alternating field of 100 mT was superimposed on a direct field of 0.1 mT. IRM was imparted with a pulse magnetizer MMPM1 (Magnetic Measurements, United Kingdom) in a magnetic field of 1.5 T. Additionally, backfield IRM of 0.3 T was imparted antiparallel and the S-ratio was calculated (S = IRM0.3T/IRM1.5T). Remanent magnetization was measured with a JR–6A spinner magnetometer (Agico, Brno), and temperature dependence of MS was tested on a KLY–3/CS–3/CS device (Agico, Brno).
4. Interpretation and discussion
4.a. High-resolution biostratigraphy: new results and regional implications
The uppermost Famennian and lowermost Tournaisian deposits in the relatively shallow-marine Pomeranian Basin (NW Poland) have been regarded as monotonous clayey deposits that are practically unfossiliferous (Matyja, Reference Matyja1993, Reference Matyja2009). A stratigraphic gap close to the D/C boundary was suggested in some sections (Rzeczenica–1 and Gorzysław–9) by conodont and miospore data as the equivalents of the Middle and Upper praesulcata, sulcata and duplicata conodont zones, as well as the western European lepidophyta–explanatus (LE), lepidophyta–nitidus (LN) and verrucosus–incohatus (VI) miospore zones, were missing (Matyja & Turnau, Reference Matyja and Turnau1989; Matyja & Stempień-Sałek, Reference Matyja and Stempień-Sałek1994). It was suggested that this stratigraphic gap resulted from some chemical or hydrodynamic factors rather than from any tectonic uplift of the Pomeranian Basin floor (Matyja, Reference Matyja1993).
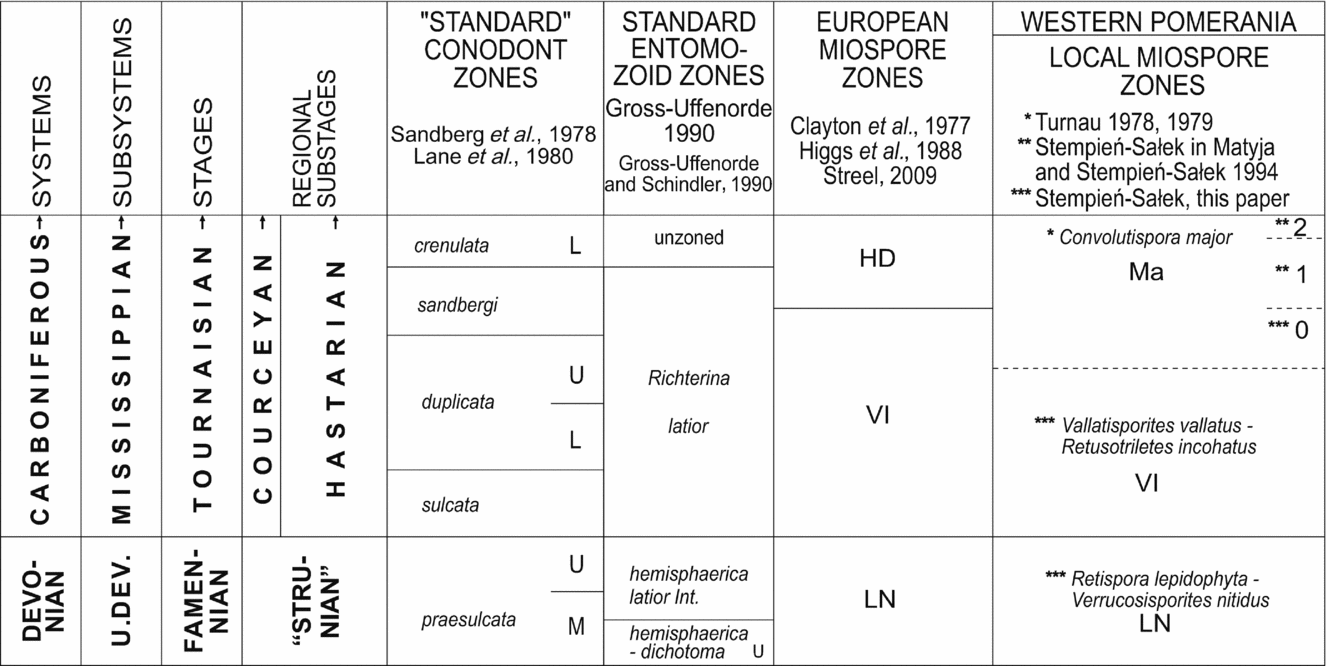
The uppermost Famennian and lowermost Tournaisian part of the Chmielno–1 section shows a similar monotonous lithological development to those recognized in the Rzeczenica–1 and Gorzysław–9 sections. However, the Chmielno–1 section has yielded the first complete sequence of uppermost Famennian and lowermost Tournaisian miospore zones recorded in the Pomerania area, with the recognition of two standard western European miospore zones, the lepidophyta–nitidus (LN) and verrucosus–incohatus (VI), as well as the local equivalent (the Convolutispora major Zone) of the HD Zone (Fig. 4).
The biostratigraphic results obtained are, in general, consistent with biostratigraphic data from the Holy Cross Mts (Filipiak, Reference Filipiak2004). However, our palynological material comprises mainly numerous, stratigraphically important, land-derived miospores, and marine phytoplankton is present in very restricted amounts (about 10%), whereas phytoplankton from the uppermost Famennian in the Holy Cross Mts is much more abundant and diverse, with only the early Carboniferous marking the beginning of a phytoplankton collapse (Filipiak, Reference Filipiak2005; Filipiak & Racki, Reference Filipiak and Racki2010).
4.b. Reconstruction of depositional conditions
Taking into account all bulk geochemical and trace metal data, with generally low TOC and total sulphur values, and low values of trace metal indicators (Tables 2, 4) and of biomarker data, the general conclusion is that during the sedimentation of the D/C interval (including the HE period) in the Pomeranian Basin, the bottom-water redox conditions were generally oxic/dysoxic, with periods of short-term anoxia/euxinia. These intermittent anoxic/euxinic conditions persisted into earliest Tournaisian time with little change in depositional conditions.
The results obtained do not question previous data concerning anoxic/euxinic conditions during HBS sedimentation (e.g. Caplan & Bustin, Reference Caplan and Bustin1999; Rimmer, Reference Rimmer2004; Rimmer et al. Reference Rimmer, Thompson, Goodnight and Robl2004; Marynowski & Filipiak, Reference Marynowski and Filipiak2007; Marynowski et al. Reference Marynowski, Zatoń, Rakociński, Filipiak, Kurkiewicz and Pearce2012). We consider that the generally oxic conditions in the Chmielno–1 section are of local importance and are connected with the shallow clay carbonate environment. However, the occurrence of biomarkers – although in low concentrations – characteristic of water column euxinia (Fig. 13b) suggests that euxinic waters from the deeper part of the basin entered the shallower areas as numerous transgressive pulses during the generally regressive stage (see Section 4.c). Periodic recurrence of H2S-rich waters, where euxinic conditions were present in the photic zone of the water column, are a potential cause for the near absence of conodonts and of other fauna (Fig. 5; Matyja & Stempień-Sałek, Reference Matyja and Stempień-Sałek1994) during this period. Short intermittent pulses of anoxia/euxinia in mainly oxic/dysoxic bottom-water conditions have been recorded previously using molecular proxies (e.g. Kenig et al. Reference Kenig, Hudson, Sinninghe Damsté and Popp2004), and according to our data from the D/C boundary of the Pomeranian Basin such proxies seem to be the only useful tool in deciphering euxinic periods in generally oxic sedimentary basins.
4.c. Sea-level changes
Many authors attributed the Hangenberg mass extinction to rapid, high-amplitude sea-level changes. Some Famennian–Tournaisian sea-level curves have been constructed (Johnson, Klapper & Sandberg, Reference Johnson, Klapper and Sandberg1985; Ross & Ross, Reference Ross, Ross, Ross and Haman1987; Bless, Reference Bless1993; Isaacson et al. Reference Isaacson, Hladil, Shen, Kalvoda, Grader, Feist, Talent and Daurer1999). The sea-level curve shown by Johnson, Klapper & Sandberg, (Reference Johnson, Klapper and Sandberg1985) remains the most commonly used and reliable standard for sea-level change during the Devonian. Johnson, Klapper & Sandberg (Reference Johnson, Klapper and Sandberg1985) suggested the existence of a long-term regressive trend in late Famennian time, which dominated T-R Cycle IIe, with distinct transgressive pulses in the Early and Late expansa conodont chrons at the inception of the T-R Cycle IIf. The regressive phase of Cycle IIf was placed in the Middle praesulcata conodont Chron (Johnson, Klapper & Sandberg, Reference Johnson, Klapper and Sandberg1986; Sandberg et al. Reference Sandberg, Gutschick, Johnson, Poole and Sando1986), which corresponds to the southern hemisphere glaciations within the LN miospore Chron (Streel, Reference Streel and Königshof2009).
This overall regression, characterized by frequent sedimentary gaps and condensed sequences, was interrupted by a short transgressive pulse matching the deposition of the HBS horizon (Bless et al. Reference Bless, Becker, Higgs, Paproth and Streel1993). Moreover, Flajs & Feist (Reference Flajs and Feist1988), as well as Paproth, Feist & Flajs (Reference Paproth, Feist and Flajs1991) distinguished the next two minor transgressive pulses, which have also been interpreted as parts of Cycle IIf: the first pulse below the D/C boundary coincides with the Upper praesulcata Chron, whereas the second was observed above the D/C boundary and lasted until the middle of the sulcata conodont Chron ( = VI miospore Chron), followed by a slight decrease in sea level, that continued until the beginning of the duplicata conodont Chron.
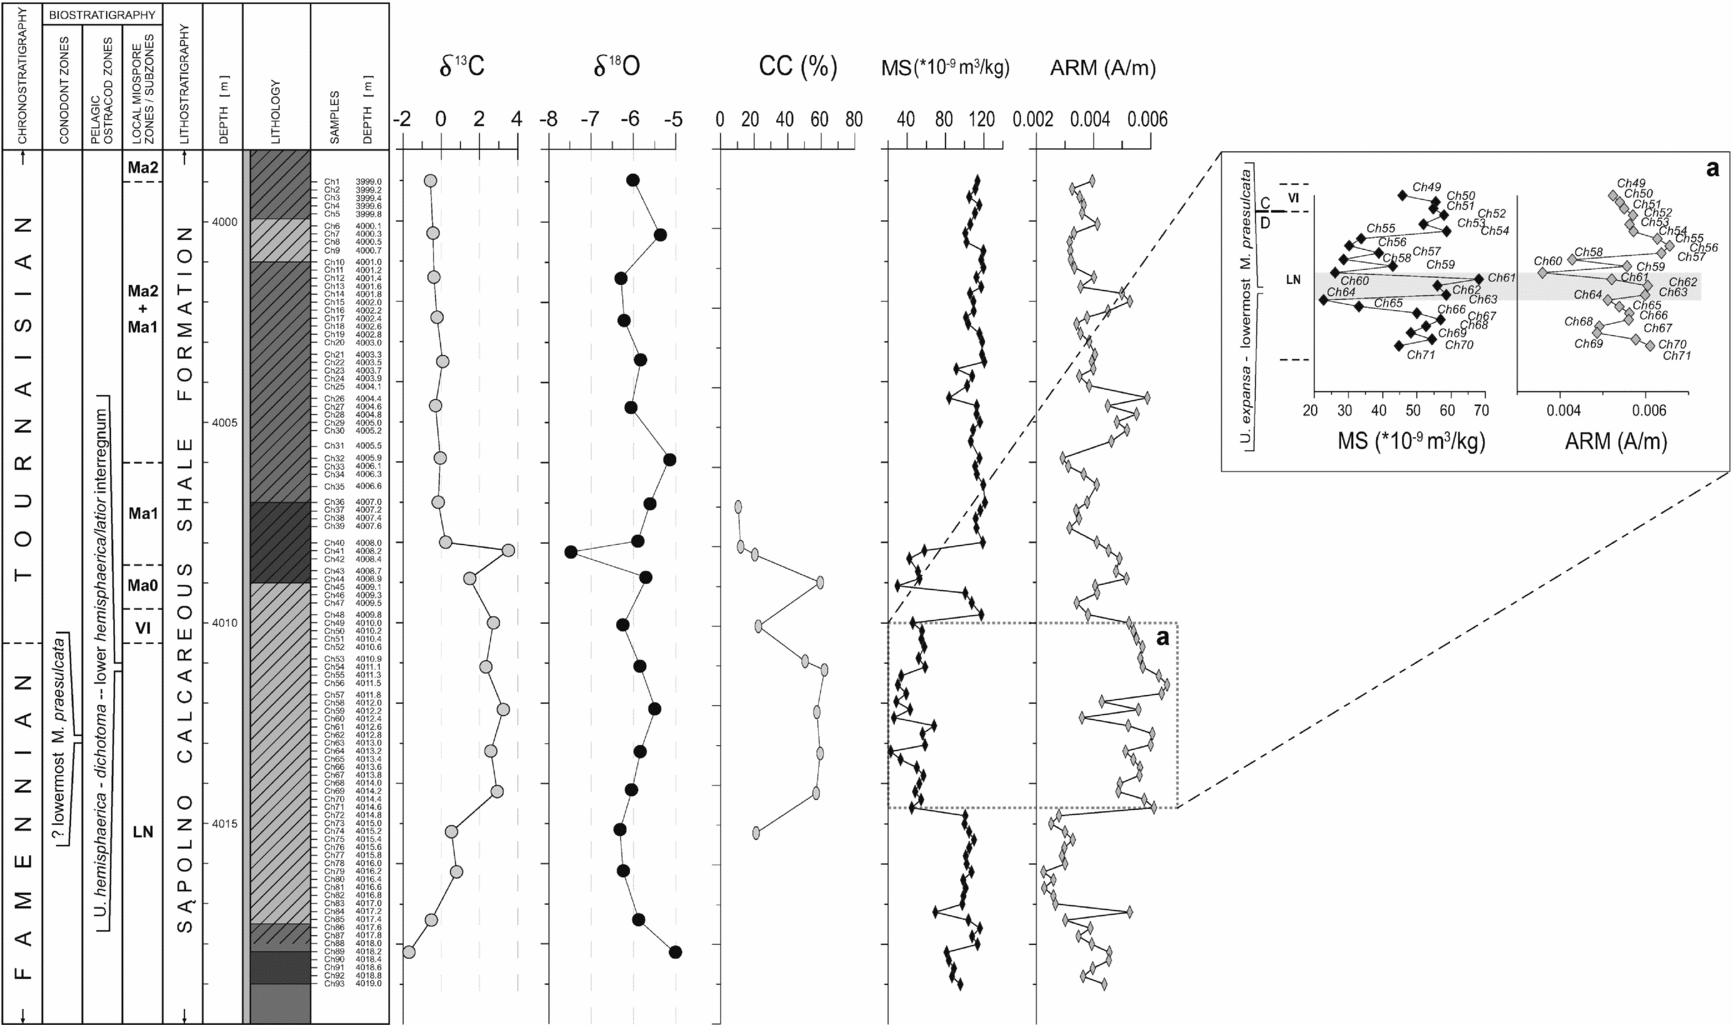
The strong variation observed in magnetic properties of rocks in the Chmielno–1 section suggest that in the lower part of the LN miospore Zone, between samples Ch 72 and Ch 93 (Fig. 11), a positive MS anomaly and a corresponding decrease in the concentration of fine magnetite (low ARM) most probably reflect relatively high sea level, connected with increased input of fine-grained material, indicating the beginning of regression. In addition, this level is characterized by increased values of TOC and TS content and lack or a very low content of carbonates (Fig. 12). However, there is no clearly distinguishable black shale level in the Chmielno–1 section; the most probable equivalent occurs in its lower part, especially given that according to recently published data by De Vleeschouwer et al. (Reference De Vleeschouwer, Rakociński, Racki, Bond, Sobień and Claeys2013), transgressive conditions prevailed during sedimentation of the HBS. Moreover, although sedimentation of the deposits of the Chmielno–1 section took place in a generally shallow basin, indicators of euxinic short-term pulses (isorenieratane derivatives) are more frequent in the lower part of the section.
A decrease in the MS values is observed in the middle part of the section, including the upper part of the LN miospore Zone and the VI Zone, across a wide interval between samples Ch 49 and Ch 71. MS decrease and ARM increase indicates regression and low sea level, perhaps of global importance, which may have persisted into early Tournaisian time (VI miospore Chron). It is consistent with the regressive phase of T-R Cycle IIf of Johnson, Klapper & Sandberg (Reference Johnson, Klapper and Sandberg1985), and may be connected with the late Famennian (‘Strunian’) glacial episodes (Streel et al. Reference Streel, Caputo, Loboziak and Melo2000; Isaacson et al. Reference Isaacson, Diaz-Martinez, Grader, Kalvoda, Babek and Devuyst2008; Caputo et al. Reference Caputo, Melo, Streel, Isbell, Fielding, Frank and Isbell2008; Brezinski et al. Reference Brezinski, Cecil, Skema and Stamm2008; Brezinski, Cecil & Skema, Reference Brezinski, Cecil and Skema2010). Here, the regression stage is accompanied by increased production of carbonates and reduction in fine-grained sediment input. MS decreases upwards in samples Ch 64–Ch 67, accompanied by a decrease in ARM concentration, and this might be interpreted as a record of a minor transgressive pulse. A rapid positive shift in samples Ch 61–Ch 64 may be a trace of a sudden transgression, which in other areas resulted in the deposition of HBS deposits. The high sea-level stage ended with an abrupt regression that is noted in MS and ARM decreases between samples Ch 60 and Ch 61.
The decrease in the MS value at the boundary between the uppermost Famennian and lowermost Tournaisian was reported from the Southern Chinese sections (Zhang, Wang & Hu, Reference Zhang, Wang and Hu2000), where the sedimentation took place in a carbonate ramp environment with a negligible supply of land-derived detrital material. In that type of ‘starving’ environment, reduction in MS corresponds with a decrease in sea level. According to Zhang, Wang & Hu (Reference Zhang, Wang and Hu2000), if the supply of terrigenous material is small, the MS is controlled by the authigenic mineral content (magnetite, haematite, pyrrhotite, siderite). In that case, sea-level rise will move/change the local environmental sedimentation conditions (redox, exposure, salinity) to a more favourable one for magnetic mineral crystallization, which should result in an increase in MS. If we accept the interpretation of Zhang, Wang & Hu (Reference Zhang, Wang and Hu2000), which does not contradict the postulated regressive nature of the carbonate deposits in the middle part of the Chmielno–1 section, then the MS and ARM changes in the carbonate interval dominated by magnetite may be easily explained (Fig. 11a). In this case, the negative MS fluctuations should correspond to the regressive stages, which correlate with an increased carbonate content in the profile (Fig. 11a). The regression stage is manifested also by low TOC and average TS content (Fig. 12).
The uppermost part of the section, with elevated MS values, corresponds to the global transgression period and high sea level of the early Tournaisian. It is accompanied here, however, by increased fine-grained material input into the basin. Perhaps two processes overlap here: global sea-level changes and the local delivery of material, as a result of local Pomeranian tectonic activity events. Our data suggest that some local factors, such as tectonic mobility of the hinterland (the East European Craton) and the unstable floor of the Pomeranian Basin, were the possible causes of observed variations and relative sea-level changes (comp. Matyja, Reference Matyja1993, Reference Matyja, Aretz, Herbig and Somerville2008, Reference Matyja2009).
The above scenario of sea-level falls and rises in the Pomeranian Basin during latest Famennian – earliest Tournaisian time do not conflict with the general scenario described by Johnson, Klapper & Sandberg (Reference Johnson, Klapper and Sandberg1985). However, we agree with Bless et al. (Reference Bless, Becker, Higgs, Paproth and Streel1993), Flajs & Feist (Reference Flajs and Feist1988) and Paproth, Feist & Flajs (Reference Paproth, Feist and Flajs1991), as well as with Kaiser and her co-authors (Kaiser et al. Reference Kaiser, Steuber, Becker and Joachimski2006, Reference Kaiser, Becker, Steuber and Aboussalam2011) that the sea-level changes close to the D/C boundary were more complex than previously suggested by Johnson, Klapper & Sandberg (Reference Johnson, Klapper and Sandberg1985, Reference Johnson, Klapper and Sandberg1986).
4.d. Climatic changes
Most of the Devonian is generally accepted as a time of global greenhouse climatic conditions without any evidence for the development of a southern hemisphere cryosphere and associated continental ice-sheets. Palaeotemperatures estimated for the early Famennian, for example, are generally comparable with temperatures ranging between 30 and 32°C, derived from δ18O apatite, and temperatures from 32 to 36°C, calculated from δ18O calcite (Joachimski et al. Reference Joachimski, Van Geldern, Breisig, Buggisch and Day2004). Long before the overall change to Late Palaeozoic icehouse conditions, however, the Late Devonian greenhouse interval was suddenly interrupted by a terminal Famennian short glacial episode, recognized in North America (Brezinski, Cecil & Skema, Reference Brezinski, Cecil and Skema2010), in South America (Isaacson et al. Reference Isaacson, Hladil, Shen, Kalvoda, Grader, Feist, Talent and Daurer1999, Reference Isaacson, Diaz-Martinez, Grader, Kalvoda, Babek and Devuyst2008) and in South Africa (Streel & Theron, Reference Streel and Theron1999). This cooling episode and glacigenic deposits are contemporaneous with a global sea-level drop, responsible for the deposition of the Hangenberg Shale/Sandstone of Europe.
A decrease in MS similar to that in the Chmielno–1 section, preceding the appearance of carbonates, and occurring simultaneously with a positive carbon isotope anomaly (Fig. 11), has been observed in the centre of the Western Illinois Basin (Clark et al. Reference Clark, Day, Ellwood, Harry and Tomkin2009; Day et al. Reference Day, Witzke, Rowe, Elwood, Whalen, Osadetz, Richards, Kabanov, Weissenberger, Potma, Koenigshof, Suttner, Kido and Silva2013). This change was linked by Clark et al. (Reference Clark, Day, Ellwood, Harry and Tomkin2009) with a transition from the Devonian greenhouse interval to the Devonian–Carboniferous interval of climatic cooling and glacial eustacy at the time of the HE (Day et al. Reference Day, Witzke, Rowe, Elwood, Whalen, Osadetz, Richards, Kabanov, Weissenberger, Potma, Koenigshof, Suttner, Kido and Silva2013). MS changes related to transgressive episodes are also recorded in the Lower expansa and Lower/Middle praesulcata zones. All those data indicate that the postulated climate change took place at the base of the Devonian T-R Cycle IIf (sensu Johnson, Klapper & Sandberg, Reference Johnson, Klapper and Sandberg1985). However, according to Heider et al. (Reference Heider, Bock, Hendy, Kennett, Matzka and Schneider2001), lower MS values correspond with increased production of biogenic CaCO3 during the relatively warm intervals in the Quaternary.
It is considered (Latta et al. Reference Latta, Anastasio, Hinnov, Elrick and Kodama2006) that the best indicator of climate change in monotonous deep-sea sediments is an ARM parameter, not confounded by diagenetic or paramagnetic minerals, but reflecting the presence of small magnetite particles, indicative of distant atmospheric dust transport. Their presence varies, depending on changes in wind intensity or source region moisture. The value of ARM should be higher with stronger winds and/or a more arid climate.
If we accept the interpretation of Latta et al. (Reference Latta, Anastasio, Hinnov, Elrick and Kodama2006), and acknowledge that dominant magnetic parameters (with negligible diagenetic influence) reflect primary detrital supply, then elevated ARM values in the Chmielno–1 section (Fig. 11) should correspond to a fine magnetite grain concentration, and indicate the presence of more or less distinct episodes of aeolian material supply. Clear ‘pseudo-cyclic’ magnetite concentration (ARM) changes, especially in high MS intervals of the Chmielno–1 section, might be interpreted as reflecting climate fluctuations, variations in temperature or precipitation (Streel, Reference Streel, Feist, Talent and Daurer1999), responsible for the supply of terrigenous minerals to the basin.
According to Streel (Reference Streel, Feist, Talent and Daurer1999), heavy rainfall event(s) in the LE miospore Chron (preceding the HE) likely washed away large amounts of terrigenous material, while slightly weaker rains during the LN Chron were mainly responsible for the deposition of silt during the formation of the HBS horizon. In this case, sharp increases in MS and ARM in the LN miospore Chron (samples Ch 61–Ch 64), might be interpreted as a result of increased terrigenous supply caused by intensive rainfall.
The increase of terrestrial material in some levels of uppermost Devonian ocean deposits (Marynowski & Filipiak, Reference Marynowski and Filipiak2007; Filipiak & Racki, Reference Filipiak and Racki2010; this work) could also be connected with wildfire intensity increase, and in consequence growth of erosion on land.
5. Final remarks
A complete sequence of the uppermost Famennian – lowermost Tournaisian, from the standard lepidophyta–nitidus (LN) miospore Zone, through the vallatus–incohatus (VI) up to the local Pomeranian Convolutispora major Zone (equivalent of the standard hibernicus– distinctus (HD) Zone), has been recognized for the first time within the Pomeranian Basin (NW Poland). The D/C transition interval in the Chmielno–1 section investigated is marked by monotonous dark grey marls, marly claystones and claystones. Although the stratigraphically important HBS is not developed here, some important microscale environmental perturbations were observed in a wide interval between the LN and the lowermost local Convolutispora major miospore zones (= lower part of HD standard miospore Zone).
Geochemical features of the Chmielno–1 section indicate that, during sedimentation of D/C deposits including the equivalent of the HBS interval, the bottom-water redox conditions were generally oxic, but with periods of intermittent short-term euxinia. We believe that oxic conditions during the HE sedimentation in the section investigated seem to be of local importance and are connected with a generally shallow, clay and carbonate environment. Periodic recurrence of H2S-rich waters, where euxinia was present in the photic zone of the water column, may be the reason for the near absence of conodonts and other fauna during this period of time.
The elevated PAH concentrations (tracers of palaeo-biomass burning) detected in several samples within the LN miospore Zone may also be a response to the HE. This is evidence of widespread wildfires which occurred on the hinterland area in latest Devonian time as a result of O2 level increase.
Analyses of magnetic properties of the rocks indicate that in the lower part of the LN miospore Zone a positive MS anomaly, and a corresponding decrease in the concentration of fine magnetite, most probably record relatively high sea level, connected with an increased silt input and the beginning of regression.
A decrease in MS occurs in the middle part of the section comprising the upper part of the LN miospore Zone and the VI Zone. Both the MS decrease and magnetite concentration increase in this horizon correspond to regression and low sea level, perhaps of global importance, which may have lasted up to early Tournaisian time (VI miospore Chron). This is consistent with the regressive phase of T-R Cycle IIf of Johnson, Klapper & Sandberg (Reference Johnson, Klapper and Sandberg1985) and may be connected with the late Famennian (‘Strunian’) glacial episodes (Streel et al. Reference Streel, Caputo, Loboziak and Melo2000; Isaacson et al. Reference Isaacson, Diaz-Martinez, Grader, Kalvoda, Babek and Devuyst2008; Caputo et al. Reference Caputo, Melo, Streel, Isbell, Fielding, Frank and Isbell2008; Brezinski et al. Reference Brezinski, Cecil, Skema and Stamm2008; Brezinski, Cecil & Skema, Reference Brezinski, Cecil and Skema2010). The regression stage is accompanied by increased production of carbonates and a decrease in fine-grained sediment input. Minor transgressive and regressive pulses were observed within this interval.
The uppermost part of the section, with high MS values, corresponds to the global transgression and high sea-level period dominating in early Tournaisian time. It is accompanied by increased fine-grained material input into the basin. Possibly two processes overlapped at this time: global sea-level changes and the local delivery of material, as a result of local tectonic events. ‘Pseudo-cyclic’ magnetite concentration changes, especially in high MS intervals of the Chmielno–1 section, might be interpreted as a trace of minor oscillations between wet and arid climate.
The sedimentary succession described and specific phenomena recognized close to the D/C boundary, such as fluctuations in water column euxinia, wildfire evidence, perturbations of the carbon cycle reflected in positive carbon excursions and relative sea-level changes, display a pattern partly similar to that observed in many areas of Europe and even in Poland, although the HBS horizon within the LN miospore Zone, the important latest Famennian correlative horizon, is not developed here.
Some important microscale environmental perturbations recognized in the Chmielno–1 section have been observed not only within the LN miospore Zone but also in a wide interval between the LN and the lowermost local Convolutispora major miospore zones (= lower part of the HD standard miospore Zone). Several matters related here to interpretations of the D/C Event/crisis interval need to be further clarified or at least confirmed on broader stratigraphic and geographical scales. It is still questionable whether the recognized event(s) were connected with the HE, which possibly was more complex and multi-phased then has been suggested, or whether it was a series of regionally limited, post-Hangenberg events.
Acknowledgements
We are deeply grateful to Paweł Filipiak (Faculty of Earth Sciences, University of Sosnowiec) for discussion and valuable remarks on palynostratigraphy and to Anna Becker for discussion of geophysical logs. Jan Turczynowicz is acknowledged for assistance with all figures, and Leszek Giro for assistance with all SEM analyses. This work has been partly financed by PGI–NRI Project: 61.2901.0910.00.0 (H.M.) and NCN Grant: 2011/01/B/ST10/01106 (L.M.). This study contributes to IGCP Project No. 580 ‘Application of magnetic susceptibility to Palaeozoic sedimentary rocks’ and No. 596 ‘The climate change and biodiversity patterns in Mid-Palaeozoic’. Special thanks go to Jan Zalasiewicz (University of Leicester, Great Britain) who took care of linguistic problems in the first version of this manuscript. The authors thank Leona Chadimova (née Koptikova) and an anonymous reviewer for constructive reviews, which improved this paper.




3. Results and comments
3.a. Biostratigraphic results
The transition from the Devonian to the Carboniferous is contained within two conodont zones (the Famennian Siphonodella praesulcata and Tournaisian Siphonodella sulcata zones) and two miospore interval zones (the Famennian Retispora lepidophyta – Verrucosisporites nitidus (LN) and Tournaisian Vallatisporites verrucosus – Retusotriletes incohatus (VI) zones) of the western European scheme (Streel et al. Reference Streel, Higgs, Loboziak, Riegel and Steemans1987; Higgs, Clayton & Keegan, Reference Higgs, Clayton and Keegan1988; Streel, Reference Streel and Königshof2009).
However, only one conodont sample was positive.
The preservation of palynomorphs, mainly land-derived miospores as well as marine phytoplankton present in very restricted amounts, is generally good.
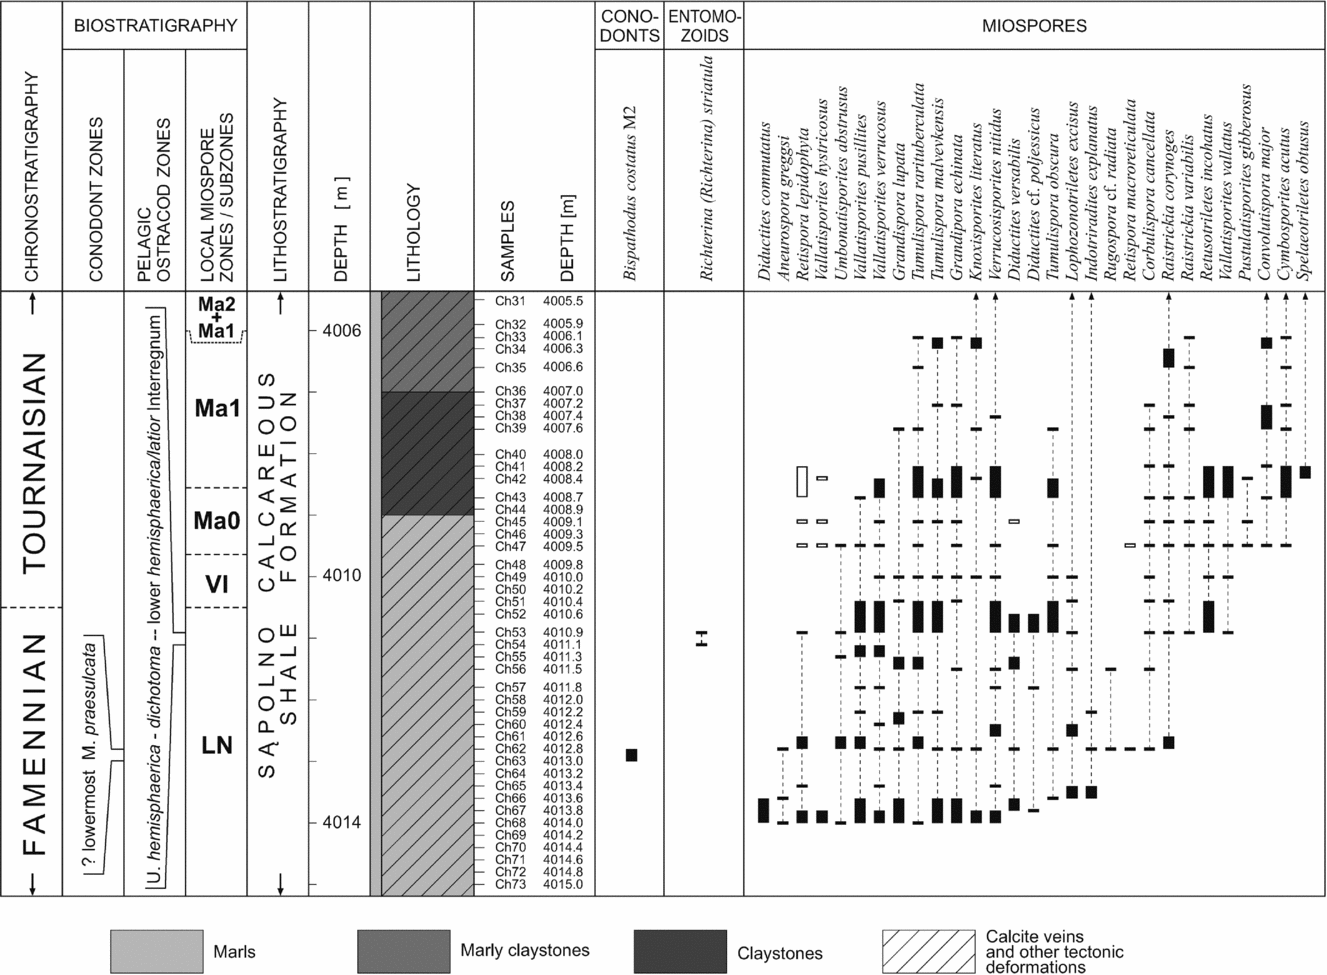
Three miospore zones/assemblages were recognized in the Chmielno–1 section close to the D/C boundary: two standard western European zones – the uppermost Famennian Retispora lepidophyta – Verrucosisporites nitidus (LN) Zone and the lowermost Tournaisian Vallatisporites verrucosus – Retusotriletes incohatus (VI) Zone and, higher, the Tournaisian local Convolutispora major (Ma) Zone (established by Turnau, Reference Turnau1978, Reference Turnau1979) with the two subzones Ma0 and Ma1 (sensu Stempień-Sałek in Matyja & Stempień-Sałek, Reference Matyja and Stempień-Sałek1994; Stempień-Sałek, Reference Stempień-Sałek2002; Figs 4, 5). The assignment to miospore zones was based on the presence of the index species and characteristic assemblages. The following miospore zones and assemblages were identified.
Correlation of the miospore zonal schemes for the uppermost Famennian and lower Tournaisian with the standard conodont and entomozoid zonations.
Distribution of the most important miospores, individual conodonts and entomozoacean ostracods in the uppermost Famennian – lower Tournaisian part of the Chmielno–1 succession; solid bars indicate certain ranges of species; empty bars indicate uncertain ranges of species, probably redeposited from older deposits.
3.a.1. Retispora lepidophyta – Verrucosisporites nitidus (LN) Zone
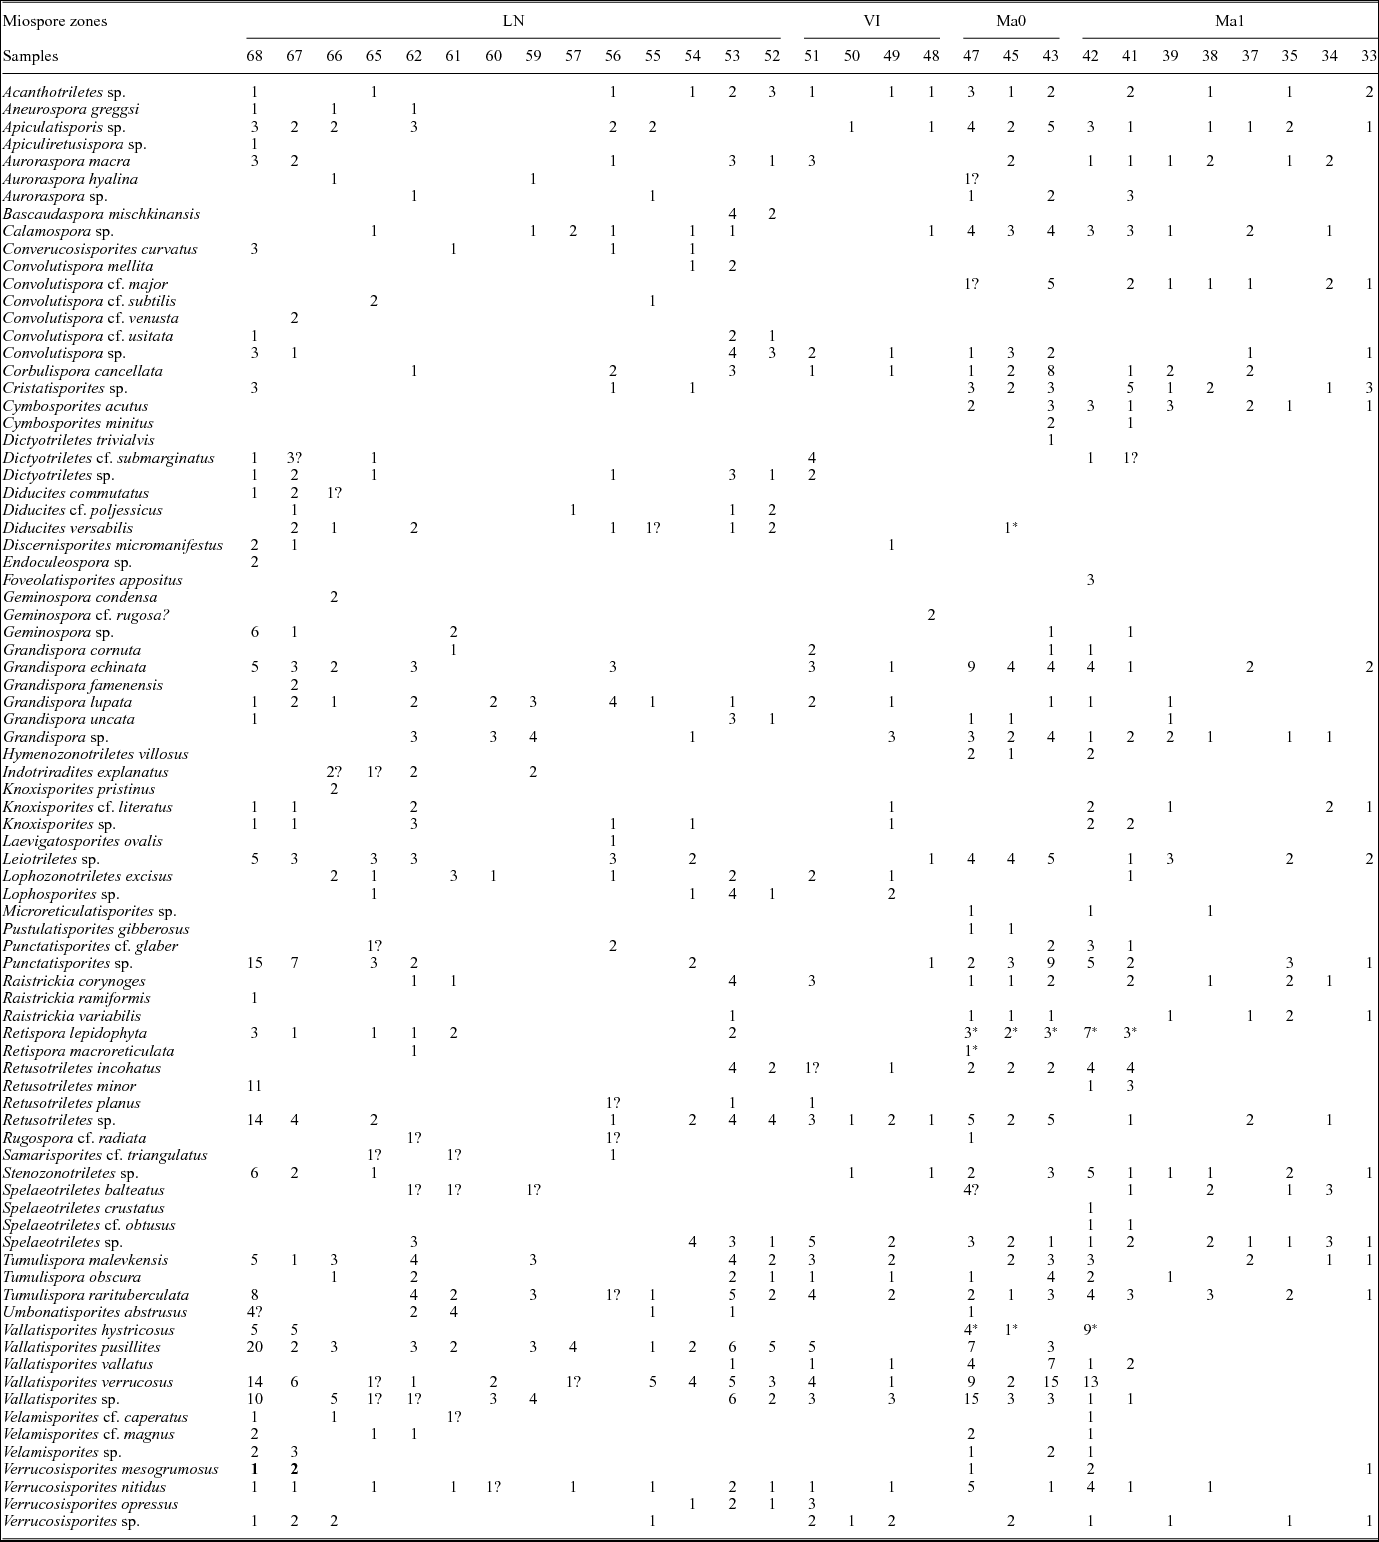
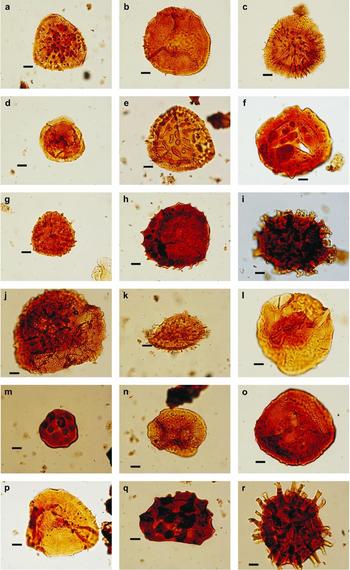
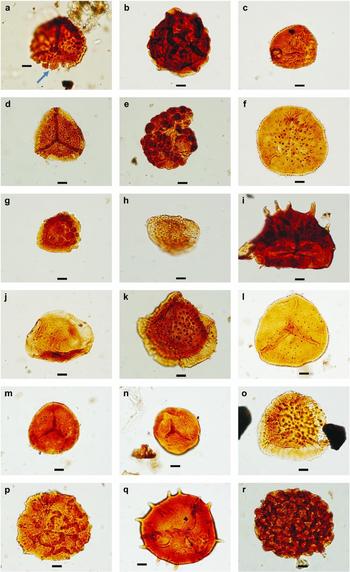
The miospore assemblage of the LN Zone (samples Ch 68–Ch 52) is diverse, and contains several specimens of the nominal species Retispora lepidophyta and Verrucosisporites nitidus, accompanied by Aneurospora greggsi, Auroraspora macra, Corbulispora cancellata, Diducites commutatus, Diducites cf. poljessicus, Diducites versabilis, Grandispora echinata, Grandispora lupata, Indotriradites explanatus, Knoxisporites literatus, Lophozonotriletes excisus, Raistrickia corynoges, Raistrickia variabilis, Retispora macroreticulata, Rugospora cf. radiata, Tumulispora malevkensis, Tumulispora obscura, Tumulispora rarituberculata, Umbonatisporites abstrusus, Vallatisporites hystricosus, Vallatisporites pusillites, Vallatisporites verrucosus and Velamisporites magnus (Table 1; Figs 5–7).
Distribution and frequency of miospore species; probable reworked miospores are asterisked
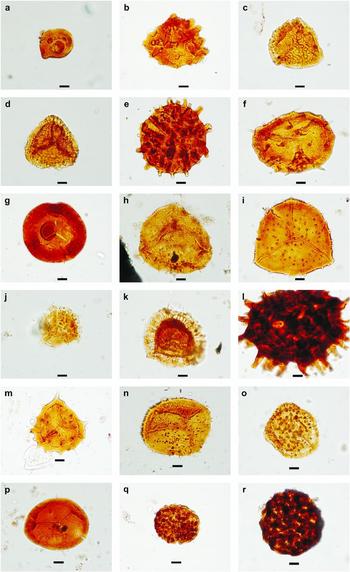
Characteristic miospores of the Retispora lepidophyta – Verrucosisporites nitidus (LN) Zone; Chmielno–1 section; scale bar 10 μm. (a, c) Vallatisporites pusillites (Kedo) Dolby & Neves, Reference Dolby and Neves1970; (a) sample Ch 62, (c) Ch 67. (b) Grandispora lupata Turnau, Reference Turnau1975; sample Ch 67. (d) Auroraspora macra Sullivan, Reference Sullivan1986; sample Ch 67. (e) Vallatisporites verrucosus Hacquebard, Reference Hacquebard1957; sample Ch 68. (f) Tumulispora rarituberculata (Luber) Potonié, Reference Potonié1966; sample Ch 68. (g) Grandispora famenensis (Naumova) Streel, Reference Streel1974; sample Ch 67. (h) Grandispora uncata (Hacquebard) Playford, Reference Playford1971; sample Ch 68. (i) Raistrickia ramiformis (Kedo) Avchimovitch & Higgs in Avchimovitch et al. Reference Avchimovitch, Byvsheva, Higgs, Streel and Umnova1988; sample Ch 68. (j) Retispora macroreticulata (Kedo) Byvsheva, Reference Byvsheva, Menner and Byvsheva1985; sample Ch 62. (k) Umbonatisporites abstrusus (Playford) Clayton, Reference Clayton1971; sample Ch 62. (l) Diducites cf. poljessicus (Kedo) van Veen, Reference Van Veen1981; sample Ch 67. (m) Tumulispora malevkensis (Kedo) Turnau, Reference Turnau1978; sample Ch 62. (n) Retispora lepidophyta (Kedo) Playford, Reference Playford1976; sample Ch 62. (o) Indotriradites explanatus (Luber) Playford, Reference Playford1991; sample Ch 62. (p) Grandispora echinata Hacquebard, Reference Hacquebard1957; sample Ch 62. (q) Lophozonotriletes excisus Naumova, Reference Naumova1953; sample Ch 65. (r) Raistrickia corynoges Sullivan, Reference Sullivan1986; sample Ch 62.
Characteristic miospores of the Retispora lepidophyta – Verrucosisporites nitidus (LN) Zone; scale bar 10 μm. (a) Vallatisporites sp., abnormal specimen with bulbous appendages with thin echinae spines (see black arrow); sample Ch 62. (b) Corbulispora cancellata (Waltz) Bharadwaj & Venkatachala, Reference Bharadwaj and Venkatachala1961; sample Ch 60. (c) Umbonatisporites abstrusus (Playford) Clayton, Reference Clayton1971; sample Ch 61. (d) Vallatisporites pusillites (Kedo) Dolby & Neves, Reference Dolby and Neves1970; sample Ch 59. (e) Verrucosisporites nitidus Playford, Reference Playford1964; sample Ch 57. (f, l) Grandispora lupata Turnau, Reference Turnau1975; (f) sample Ch 60, (l) Ch 53. (g) Tumulispora malevkensis (Kedo) Turnau, Reference Turnau1978; sample Ch 61. (h) Retispora lepidophyta (Kedo) Playford, Reference Playford1976; sample Ch 61. (i) Grandispora cornuta Higgs, Reference Higgs1975; sample Ch 61. (j) Auroraspora hyalina (Naumova) Streel, Reference Streel1974; sample Ch 59. (k) Indotriradites explanatus (Luber) Playford, Reference Playford1991; sample Ch 59. (m, n) Retusotriletes incohatus Sullivan, Reference Sullivan1964; (m) sample 53, (n) Ch 52. (o) Vallatisporites verrucosus Hacquebard, Reference Hacquebard1957; sample Ch 52. (p) Bascaudaspora mischkinansis Byvscheva (Byvscheva); sample Ch 53. (q) Grandispora uncata (Hacquebard) Playford, Reference Playford1971; sample Ch 52. (r) Convolutispora mellita Hoffmeister, Staplin & Malloy, Reference Hoffmeister, Staplin and Malloy1955; sample Ch 53.
Raistrickia corynoges and Corbulispora cancellata appear in the middle part of the LN Zone, whereas Raistrickia variabilis, Retusotriletes incohatus and Vallatisporites vallatus appear in its upper part (Table 1; Fig. 5).
Typical, very well-preserved Devonian species such as Diducites versabilis, Retispora lepidophyta, Aneurospora greggsi, Diducites cf. poljessicus and Rugospora cf. radiata (comp. Streel, Reference Streel and Königshof2009) are noted for the last time in samples Ch 52, Ch 53, Ch 62 and Ch 56, respectively, within the upper part of the LN Zone (Fig. 5). However, species characteristic only for the Devonian, like Retispora lepidophyta, Diducites versabilis, Retispora macroreticulata and Vallatisporites hystricosus, were found within the Tournaisian Convolutispora major Zone (Table 1; Fig. 5); these specimens are not very well preserved and were probably redeposited from older strata.
According to Streel (Reference Streel and Königshof2009), the complete extinction of the typical Devonian species Retispora lepidophyta took place immediately below the base of the Carboniferous and it corresponds to the boundary between the LN and VI zones. The rare occurrence of Retispora lepidophyta in the LN Zone is in agreement with results from the Holy Cross Mountains (Filipiak, Reference Filipiak2004; Marynowski & Filipiak, Reference Marynowski and Filipiak2007), as well as with results from western Europe and Belarus (Clayton et al. Reference Clayton, Coquel, Doubinger, Gueinn, Loboziak, Owens and Streel1977; Avchimovitch, Turnau & Clayton, Reference Avchimovitch, Turnau and Clayton1993; Higgs et al. Reference Higgs, Streel, Korn and Paproth1993; Streel, Reference Streel and Königshof2009).
Within the LN miospore Zone, simple conodont species as well as entomozoid ostracods have also been found. The presence of the conodont species Bispathodus costatus (Branson), obtained from sample Ch 62 (Fig. 5), indicates the uppermost part of the Lower praesulcata conodont Zone or the lowermost part of the Middle praesulcata conodont Zone (Ziegler & Sandberg, Reference Ziegler, Sandberg and Clark1984; Streel, Reference Streel and Königshof2009). Żbikowska (Reference Żbikowska1992) reported the rare pelagic entomozoid Richterina (Richterina) striatula (Richter) at the depth of 4010.9–4011.1 m (samples Ch 53–Ch 54), in the uppermost part of the LN Zone (Fig. 5). The last occurrence of this species is noted in the Lower hemisphaerica/latior Interregnum (Gross-Uffenorde, Lethiers & Blumenstengel, Reference Gross-Uffenorde, Lethiers and Blumenstengel2000), which corresponds to the upper part of the Middle and Upper praesulcata conodont zones (Fig. 4). R. striatula was also found by Olempska (Reference Olempska1997) in the Holy Cross Mts (central Poland) in the praesulcata conodont Zone.
3.a.2. Vallatisporites vallatus – Retusotriletes incohatus (VI) Zone
The basis for distinguishing the Tournaisian VI Zone (samples Ch 51–Ch 48) is the presence of Retusotriletes incohatus and Vallatisporites vallatus, and the lack of typical Famennian species (Streel, Reference Streel and Königshof2009; Figs 5, 8a–f).
Characteristic miospores of the Vallatisporites vallatus – Retusotriletes incohatus (VI) assemblage zone (a–f) and local Convolutispora major (Ma) Zone (g–s); scale bar 10 μm. (a) Tumulispora malevkensis (Kedo) Turnau, Reference Turnau1978; sample Ch 51. (b) Lophozonotriletes excisus Naumova, Reference Naumova1953; sample Ch 51. (c, d, j) Vallatisporites vallatus Hacquebard, Reference Hacquebard1957; (c) sample Ch 51, (d) Ch 49, (j) Ch 47. (e) Raistrickia corynoges Sullivan, Reference Sullivan1986; sample Ch 51. (f) Grandispora cornuta Higgs, Reference Higgs1975; sample Ch 51. (g) Tumulispora obscura Staplin & Jansonius, Reference Staplin and Jansonius1964; sample Ch 43. (h, m) Cymbosporites acutus (Kedo) Byvscheva, Reference Byvsheva, Menner and Byvsheva1985; (h) sample Ch 47, (m) Ch 42. (i, n) Grandispora lupata Turnau, Reference Turnau1975; (i) sample Ch 43, (n) Ch 42. (k) Vallatisporites pusillites (Kedo) Dolby & Neves, Reference Dolby and Neves1970; sample Ch 43. (l) Raistrickia variabilis Dolby & Neves, Reference Dolby and Neves1970; sample Ch 43. (o) Vallatisporites verrucosus Hacquebard, Reference Hacquebard1957; sample Ch 42. (p) Retusotriletes incohatus Sullivan, Reference Sullivan1964; sample Ch 42. (q) Verrucosisporites nitidus (Naumova) Playford, Reference Playford1964; sample Ch 42. (r) Convolutispora major (Kedo) Turnau, Reference Turnau1978; sample Ch 37.
However, the VI Zone is poorly defined in northwestern Europe, the two nominal species being present below the base of the zone (Streel, Reference Streel and Königshof2009). The lower boundary of the VI Zone is defined using quantitative criteria: it is an acme zone.
3.a.3. Convolutispora major (Ma) local Zone
The Convolutispora major (Ma) local Zone was established by Turnau (Reference Turnau1978) and divided into subzones by Stempień-Sałek (in Matyja & Stempień-Sałek, Reference Matyja and Stempień-Sałek1994). The lower boundary of the Ma Zone is marked by the appearance of Cymbosporites acutus, Convolutispora major and Pustulatisporites gibberosus, accompanied by Corbulispora cancellata, Grandispora echinata, Grandispora lupata, Knoxisporites literatus, Raistrickia corynoges, Retusotriletes incohatus, Tumulispora malevkensis, Tumulispora obscura, Tumulispora rarituberculata, Umbonatisporites abstrusus, Vallatisporites pusillites, Vallatisporites verrucosus, Vallatisporites vallatus and Verrucosisporites nitidus (Table 1; Fig. 8g–r). The lowermost part of the Convolutispora major Zone (Ma0 Subzone) is probably equivalent to the upper part of the western European VI Zone (Fig. 4). The Ma1 Subzone is marked by the first appearance of Speleotriletes obtusus, accompanied by miospore species known in the Ma0 Subzone, and the disappearance of Vallatisporites pusillites as well as the absence of Umbonatisporites abstrusus. Diverse conodont species noted within the Ma1 miospore Subzone (Matyja & Stempień-Sałek, Reference Matyja and Stempień-Sałek1994) indicate the sandbergi conodont Zone (Fig. 4). The Ma1 Subzone together with the Ma2 Subzone are equivalents to the western European Kraeuselisporites hibernicus – Umbonatisporites distinctus (HD) Zone (Fig. 4).
3.b. Microscopic observation
Eighteen thin-sections were used in microfacies observations of monotonous, thin-bedded, dark grey marls, marly claystones and claystones. Unexpectedly, these rocks are also microfacially almost undifferentiated (Fig. 3). Constituent grains as well as rock fabrics allow recognition of grey marls and more or less marly limestones with relatively high amounts of silt and organic matter.
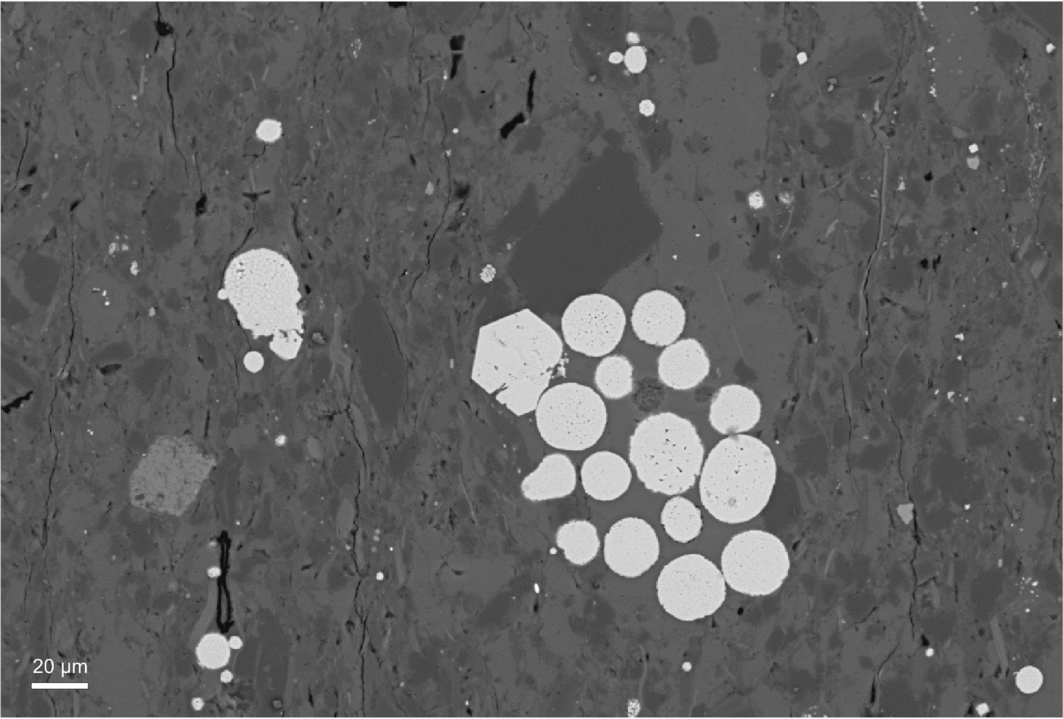
Scanning electron microscope (SEM) analyses revealed mainly calcite and a commonly iron-rich calcite–dolomite mass dominating in all of the thin-sections. In the lowermost interval some clay minerals are present and rare pyrite framboids. Higher in the section the silt fraction (potassium feldspars, aluminosilicates (micas), biotite, apatite, grains of zircon, rutile and monazite) is more common, sometimes double, especially in places where quartz grains can also be seen. Pyrite framboids and partly disintegrated framboidal spherules occur throughout the samples. The pyrite framboids have a relatively wide range of diameters from 8 μm to 30 μm, and large framboids (diameter above 10 μm) are the most common type as is characteristic for pyrite formed within sediment, beneath an oxygenated water column (Bond, Wignall & Racki, Reference Bond, Wignall and Racki2004). Significant framboidal pyrite accumulations were detected, mainly in the lower Tournaisian samples, where they occur as scattered clusters (Fig. 9), being a result of organic matter transformation.
SEM image of sample Ch 42 (Ma1 miospore Zone) with large pyrite framboidal spherules, probably being a result of organic matter transformation.
3.c. Diagenetic overprint
Diagenesis is a major concern in Palaeozoic rocks, which may have been affected by intense recrystallization and a strong overprint. Detailed analysis of the geochemical signatures of specific diagenetic phases, however, is beyond the scope of this study.
To control our results, we compare our carbon isotope records, based on the analysis of whole-rock samples, with high-resolution carbon isotope records (Buggish & Joachimski, Reference Buggisch and Joachimski2006), also based on the analysis of whole-rock carbonates, as well as with the data of Brand, Legrand-Blain & Streel (Reference Brand, Legrand-Blain and Streel2004) and Kaiser, Steuber & Becker (Reference Kaiser, Steuber and Becker2008). The observed positive shift in δ13C in the Chmielno–1 section coincides with a positive shift observed in many sections worldwide, although its amplitude varies from section to section. A diagenetic overprint seems not to be strongly developed in the Chmielno–1 section, although carbonates were cemented and partly recrystallized during diagenesis.
Chemical and mineralogical changes (see Schneider et al. Reference Schneider, De Wall, Kontny and Bechstädt2004 a) in the sediment, or late diagenetic processes in carbonates, are believed to significantly affect the MS signal. On the other hand, MS analysis of Upper Devonian diagenetically altered carbonates (Riquier et al. Reference Riquier, Averbuch, Devleeschouwer and Tribovillard2010) showed that the post-depositional increase in small grains of authigenic minerals does not affect the original MS signal in the rock.
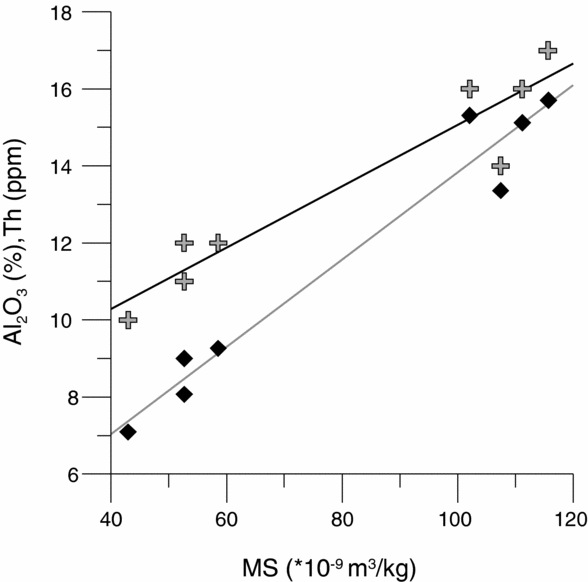
To test the origin of the MS signal, Al, Ti as well as (independent of diagenesis) Th and Zr concentrations were used as proxies of the terrigenous fraction of the rock (e.g. Calvert & Pedersen, Reference Calvert and Pedersen1993; Bertrand et al. Reference Bertrand, Charlet, Charlier, Renson and Fagel2008; Riquier et al. Reference Riquier, Averbuch, Devleeschouwer and Tribovillard2010). High, positive correlation coefficients (Fig. 10) between MS and Al2O3 – 0.98, TiO2 – 0.98, Th – 0.95 and Zr – 0.53 (element concentrations derived from chemical analyses) indicate primary minerals and reflect the detrital terrigenous sedimentary input into the basin. Since no gradual changes in lithology or bedding were observed, clustering of values differentiates between marly lime mudstones and claystones. It seems that the possible influence of diagenetic minerals on MS is negligible and we treat MS as an indicator of primary detrital input in the following sections.
Correlation graph between magnetic susceptibility (MS) and some geochemical proxies: Al2O3 (diamonds), r = 0.98 and Th (crosses), r = 0.95. Two clusters of values illustrate the lack of gradual lithological changes along the section.
Thermal maturity level of organic matter in the Upper Devonian of the Pomerania area has been estimated using the CAI (conodont colour alteration index) (Narkiewicz, Grotek & Matyja, Reference Narkiewicz, Grotek, Matyja and Narkiewicz1998). Regional recovery of conodonts with a CAI 3 indicates that temperatures did not exceed a maximum of 130°C.
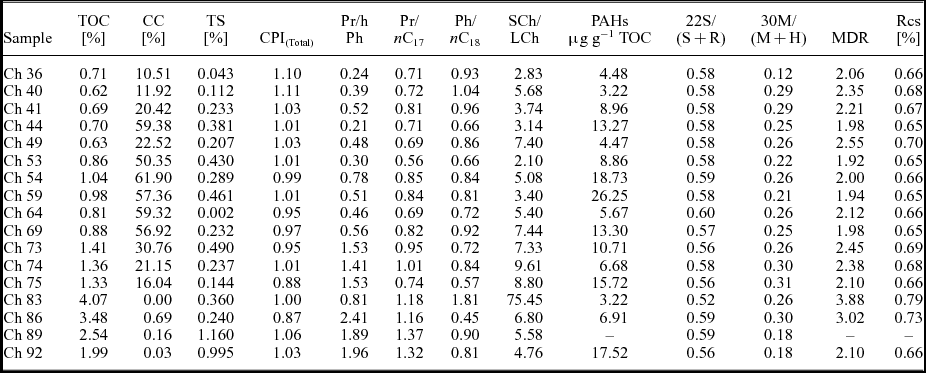
The values of maturity parameters based on hopane distribution such as the 22S/(S+R) homohopane parameter or 30M/(M+H) hopane to moretane ratio are provided in Table 2, and all are characteristic for samples which are within the oil window range. The homohopanes have reached equilibrium and the values obtained are very similar for all samples (Table 2) and are characteristic of the main phase of oil generation (Peters, Walters & Moldowan, Reference Peters, Walters and Moldowan2005). Moreover, less thermally stable hopanes with a ββ-configuration were not detected. One of the most useful molecular maturity parameters in marine carbonates is the methylodibenzothiophene ratio (MDR), which is based on the ratio of the more thermally stable 4-methylodibenzothiophene to the less stable 1-methylodibenzothiophene. MDR can be calculated on vitrinite reflectance (Rcs) values according to the formula proposed by Radke & Willsch (Reference Radke and Willsch1994). The Rcs values obtained are in the range of 0.65–0.70% and clearly indicate the initial phase of hydrocarbon generation for the samples investigated. Vitrinite reflectance values interpreted from interpolation were slightly higher (0.8–0.9%) for the Chmielno–1 section (Narkiewicz, Grotek & Matyja, Reference Narkiewicz, Grotek, Matyja and Narkiewicz1998; Grotek, Matyja & Skompski, Reference Grotek, Matyja, Skompski and Narkiewicz1998), but values are still within the oil window. Despite the maturity range, there was no visible evidence of hydrocarbon migration manifested by oil or solid bitumen concentrations in streaks and geodes.
Bulk geochemical data and basic molecular parameters
TOC – total organic carbon; CC – carbonate content; TS – total sulphur; CPI – carbon preference index; Pr – pristane; Ph – phytane; SCh/LCh – short-chain to long-chain n-alkanes ratio: (nC17+nC18+nC19)/(nC27+nC28+nC29)
PAHs = BaA+BbFl+BeP+BaP+Cor where BaA = benzo[a]anthracene, BeP = benzo[e]pyrene, BbFl = benzo[b]fluoranthene, BaP = benzo[a]pyrene, Cor = coronene
22S/(S+R) – C3122R/(22R+22S) homohopanes ratio
30M/(M+H) – C30 moretane to (moretane+hopane) ratio
MDR = 4-MDBT/1-MDBT (Radke, Welte & Willsch, Reference Radke, Welte, Willsch, Leythaenser and Rullkötter1986)
Rcs = 0.51+0.073MDR (Radke & Willsch, Reference Radke and Willsch1994)
The diagenetic overprint and thermal transformation of the sequence investigated is not sufficiently high to preclude biomarker, isotope and trace metal analyses.
3.d. Stable isotope analysis
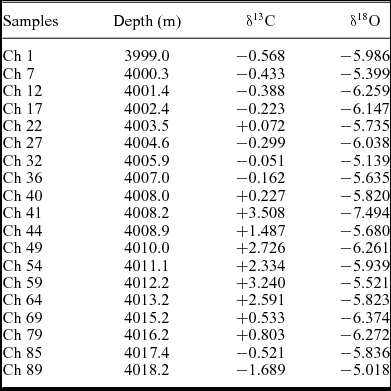
The carbonate and oxygen isotopic composition of the Chmielno–1 section is shown in Table 3 and Figure 11. The range of the carbonate δ13C values changes from −1.69‰ (sample Ch 89) to +3.51‰ (sample Ch 41). The first positive excursion in δ13C values, with an amplitude of +0.80‰, is observed in sample Ch 79, in the lower part of the LN Zone. δ13C values increase up to +2.59‰ in sample Ch 64. The next positive shift, with a value of +3.24‰, coincides with the upper part of the LN miospore Zone (sample Ch 59). δ13C values stay at a relatively high level (between +2.33‰ and 2.73‰) during the uppermost LN and lowermost VI miospore zones, with a maximum value (+3.51‰) in the lowermost Ma1 Subzone (sample Ch 41), which is generally represented by claystones (Table 3; Fig. 11). δ13C values decrease to +0.23‰ higher in the Ma1 Subzone (sample Ch 40), and then stay at a low level (with negative values) in the upper part of the Ma1 and in the lower part of the Ma2 subzones.
Bulk carbon and oxygen isotope values
Distribution of rock magnetic properties, and carbon and oxygen isotope ratios across the uppermost Famennian – lower Tournaisian part of the section; MS – magnetic susceptibility; ARM – anhysteretic remnant magnetization; CC – carbonate content. (a) Details; note reverse correlation between MS and CC.
A positive δ13C excursion close to the D/C boundary interval has been noted in many sections worldwide (e.g. Brand, Legrand-Blain & Streel, Reference Brand, Legrand-Blain and Streel2004; Buggisch & Joachimski, Reference Buggisch and Joachimski2006; Kaiser, Steuber & Becker, Reference Kaiser, Steuber and Becker2008). It appears, however, that the development of several positive excursions in the δ13C values observed in the Chmielno–1 section were prevalent for the entire interval from the LN to the Ma1 miospore zones (Fig. 11), and were not only within the LN Zone.
The oxygen isotope record in the section documents values between −5.02‰ and −6.37‰ with only one value as low as −7.49‰ (sample Ch 41). A decrease in δ18O values begins close to the base of the LN Zone, culminates in the earliest Tournaisian (Ma1 Subzone) and returns to the preceding latest Famennian level.
The stratigraphic distribution of the δ13C and δ18O values documents opposing trends. The interval of elevated δ13C values coincides with that of reduced δ18O values. Careful analysis reveals that the gradual increase in δ13C and the marked decrease in δ18O values take place between the LN and the lowermost Ma1 Subzone (depth 4008–4018 m).
The interval of elevated δ13C values coincides with that of reduced values of MS, but has a higher concentration of fine-grained magnetite (ARM). More careful analysis reveals that the gradual increase in δ13C is between 4018 and 4013 m of the section and the marked decline in the MS (and ARM increase) occurs until around 4015 m. Increase in the isotope values in the depth interval of 4015–4011 m (Fig. 11) coincides with a decrease in susceptibility, and magnetite concentration increases (increase in ARM). The boundary between the VI and Ma0 zones and the lowermost part of the Ma1 Zone (HD in the standard zonation) show a significant increase in MS values associated with a decrease in δ13C values (Fig. 11).
The pattern described suggests that environmental changes reflected in the isotopic record of carbonates preceded increased detrital material supply to the basin.
3.e. Organic geochemistry
3.e.1. Bulk, molecular and trace element data
Bulk geochemical parameters, including TOC, TS and carbonate contents, and parameters based on normal and branched alkanes, hopanes and dibenzothiophenes are given in Table 2 and shown on Figure 12. The abundance of TOC for the uppermost Famennian and lowermost Tournaisian sedimentary rocks from the Chmielno–1 section was in the range of 0.62 to 4.07%, and this seemingly correlates with the carbonate content (Table 2; Fig. 12).
Composite plot of the Chmielno–1 section showing organic carbon (TOC), total sulphur (TS), carbonate content (CC) and pyrolytic polycyclic aromatic hydrocarbon (PAH) concentrations.
Such amounts differ from those obtained from the much deeper basin in the Kowala section (Holy Cross Mts, Poland) where the HBS reached values of up to 20% of TOC (Marynowski & Filipiak, Reference Marynowski and Filipiak2007), and claystones from the lower Tournaisian contain TOC values higher than 6% (Marynowski et al. Reference Marynowski, Kurkiewicz, Rakociński and Simoneit2011). Total sulphur contents are three times lower than those of the Kowala HBS (Marynowski et al. Reference Marynowski, Zatoń, Rakociński, Filipiak, Kurkiewicz and Pearce2012) and Tournaisian shale (Marynowski et al. Reference Marynowski, Kurkiewicz, Rakociński and Simoneit2011). Rimmer (Reference Rimmer2004) and Rimmer et al. (Reference Rimmer, Thompson, Goodnight and Robl2004) also noted much higher TOC contents near the D/C boundary, reaching c. 15%. However, on the other hand, Kaiser et al. (Reference Kaiser, Steuber, Becker and Joachimski2006) recorded only slightly elevated TOC values for the HBS from the Kronhofgraben (Carnic Alps) and Hasselbachtal (Rhenish Massif) sections (1.5–2%), and no evidence of TOC enrichment for the Grüne Schneid (Carnic Alps) section (values below 0.5%).
In the Chmielno–1 section marlstones are generally organic-poor in the upper part of the LN Zone and slightly enriched in TOC in the lower LN Zone, which is also manifested in the total sulphur content (Fig. 12).
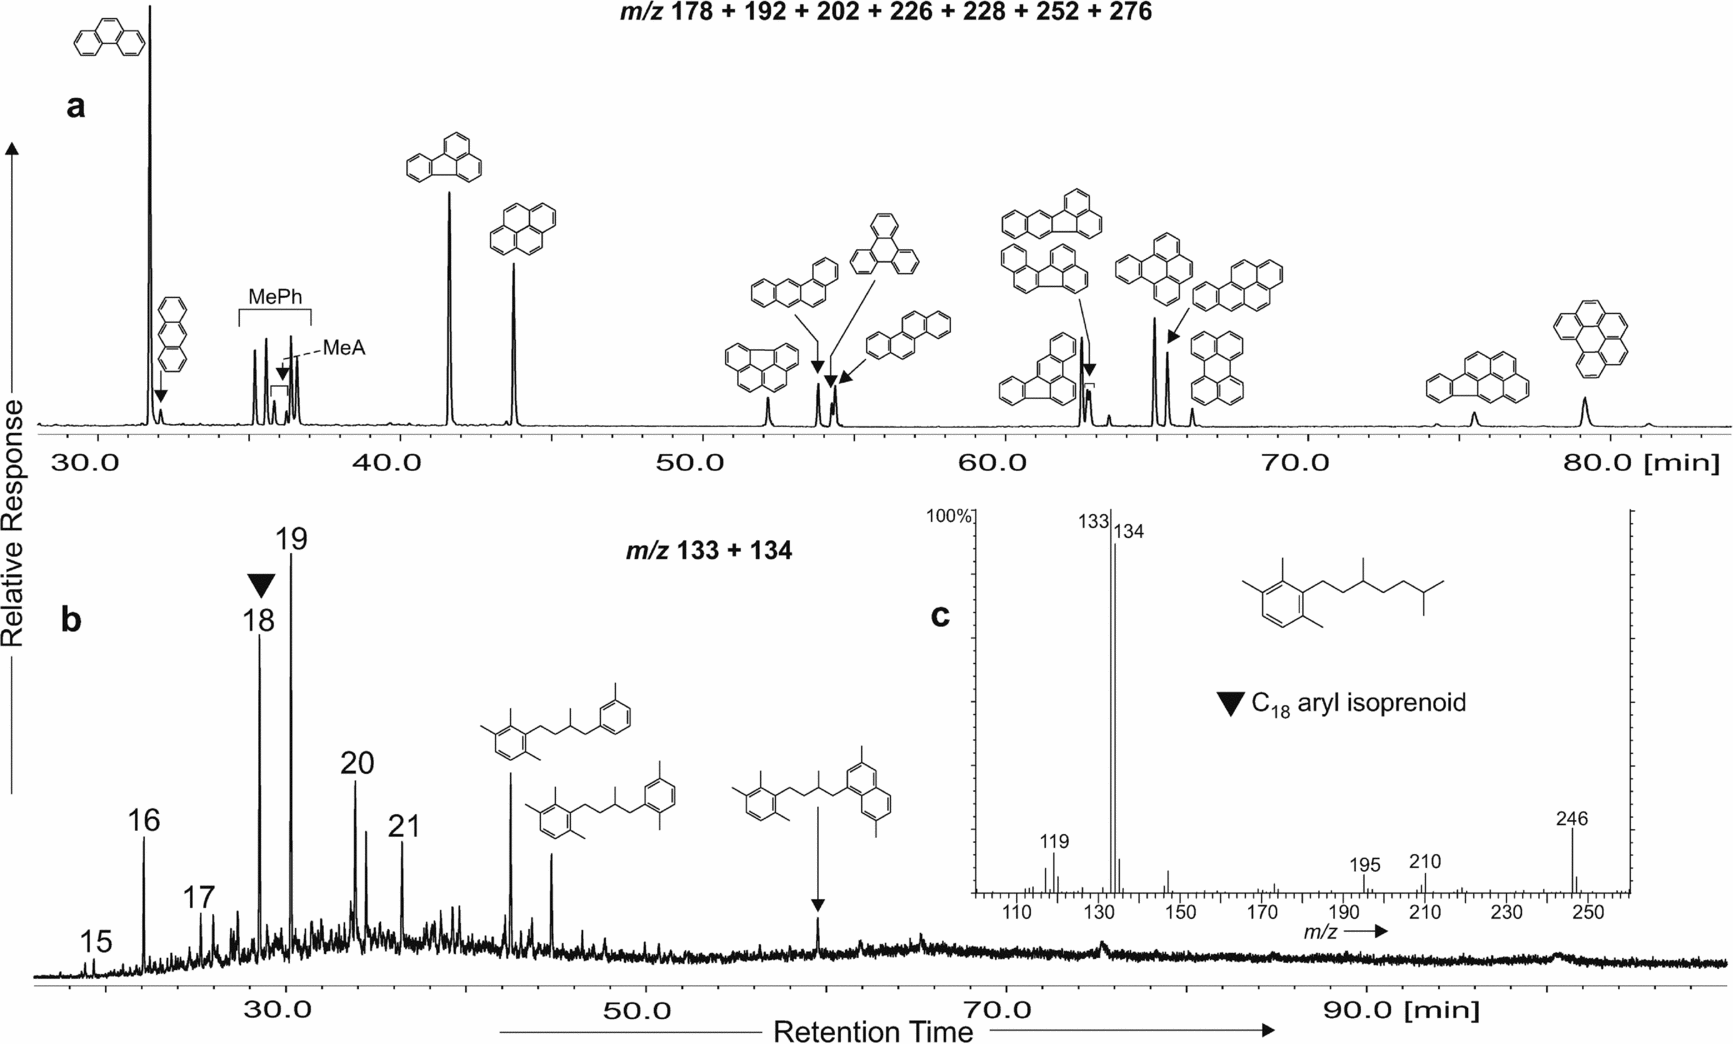
N-alkane carbon preference index (CPI) values were approximately 1, suggesting a lack of or low terrestrial input, which is also supported by the short- to long-chain n-alkane (SCh/LCh) ratio values of > 2 indicating a preponderance of the low molecular weight n-alkanes (Table 2), generally characteristic of marine organic matter (e.g. Peters, Walters & Moldowan, Reference Peters, Walters and Moldowan2005). Pristane to phytane ratio (Pr/Ph) values were lower than 0.6 for most of the samples from the upper part of the section (Table 2), which could suggest more oxic conditions but also could be connected with carbonate sedimentation (Didyk et al. Reference Didyk, Simoneit, Brassel and Eglinton1978; Peters, Walters & Moldowan, Reference Peters, Walters and Moldowan2005), especially if the hopane distribution is distinctive for oxic conditions without elevated concentrations of homohopanes with C32+ carbon atoms (Peters, Walters & Moldowan, Reference Peters, Walters and Moldowan2005). A low concentration of steranes versus hopanes in the samples investigated is characteristic of oxygen-rich bottom waters with extensive bacterial reworking of sedimentary organic matter (Marynowski, Narkiewicz & Grelowski, Reference Marynowski, Narkiewicz and Grelowski2000). In samples from the uppermost Devonian part of the section (Ch 53–Ch 92) low amounts of aryl isoprenoids have been detected, ranging from C15 to C21, together with some short-chain di- and triaromatic compounds (Fig. 13b, c), most probably diagenetic products of isorenieratene and its diaryl derivatives (Koopmans et al. Reference Koopmans, Köster, Van Kaam-Peters, Kenig, Schouten, Hartgers, De Leeuw and Sinninghe Damsté1996). This observation may suggest the occurrence of water column euxinia (Summons & Powell, Reference Summons and Powell1987) during sedimentation of the Upper Devonian part of the section (between samples Ch 89 and Ch 49). However, isorenieratane or any other long-chain diaryl-isoprenoids have not been detected in any sample, which could be connected with mainly oxic bottom-water conditions with only intermittent (seasonal?) transgressions of euxinic waters (these compounds are very unstable during weathering/oxidation; Marynowski et al. Reference Marynowski, Kurkiewicz, Rakociński and Simoneit2011; see also Schwark & Frimmel, Reference Schwark and Frimmel2004). Such distribution is in agreement with the occurrence of large pyrite framboids measured in the section, which indicates prevalence of oxic–dysoxic bottom-water conditions. Likewise, the ‘maturity effect’ leading to preferential degradation of long-chain diaryl isoprenoids cannot be ruled out (Requejo et al. Reference Requejo, Allan, Creany, Gray and Cole1992).
Summed mass chromatograms for (a) m/z 178+192+202+226+228+252+276 showing the distribution of major PAHs in sample Ch 54, (b) m/z 133+134 showing distribution of aryl isoprenoids (numbers identify the individual carbon number of pseudohomologues) and short-chain diaryl isoprenoids in sample Ch 64 and (c) mass spectrum of C18 aryl isoprenoid. MePh – methylphenanthrenes; MeA – methylanthracenes. A DB-35MS column was used.
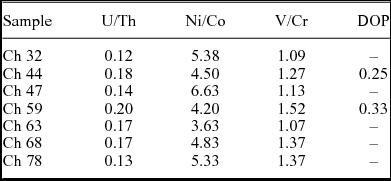
To reconstruct depositional conditions during latest Devonian – early Carboniferous sedimentation in the Chmielno–1 section, different trace metal ratios were calculated (Table 4). These ratios have previously been used in studies of different Late Devonian basins, and it was shown that they are good environmental indicators of bottom-water conditions (e.g. Racki et al. Reference Racki, Racka, Matyja, Devleeschouwer, Racki and House2002; Bond, Wignall & Racki, Reference Bond, Wignall and Racki2004; Rimmer et al. Reference Rimmer, Thompson, Goodnight and Robl2004; Hartkopf-Fröder et al. Reference Hartkopf-Fröder, Kloppisch, Mann, Neumann-Mahlkau, Schaefer, Wilkes, Becker and Kirchgasser2007; Racka et al. Reference Racka, Marynowski, Filipiak, Sobstel, Pisarzowska and Bond2010; Marynowski, Filipiak & Zatoń, Reference Marynowski, Filipiak and Zatoń2010; Marynowski et al. Reference Marynowski, Zatoń, Rakociński, Filipiak, Kurkiewicz and Pearce2012; Bond et al. Reference Bond, Zatoń, Wignall and Marynowski2013). According to data summarized in Racka et al. (Reference Racka, Marynowski, Filipiak, Sobstel, Pisarzowska and Bond2010), values of all calculated indicators for the Chmielno–1 section are characteristic of oxic conditions. Values of the U/Th ratio for all Devonian and Carboniferous samples are < 0.75 – the value established as the boundary between oxic and dysoxic conditions in shales (Jones & Manning Reference Jones and Manning1994) – and < 1.00 – the boundary value established for carbonates (Wignall & Twitchett Reference Wignall and Twitchett1996). Similarly, in the case of the V/Cr ratio, all results are below 2, indicating oxygen-rich bottom waters. The Ni/Co ratio results are more ambiguous. Three samples (Ch 32, Ch 47, Ch 78) are characterized by values typical of conditions depleted in oxygen (but not anoxic conditions – values between 5 and 7) while for the rest of the samples values are below 5, indicating an oxic environment.
Trace metal ratios and degree of pyritization (DOP) values estimated from the TOC–TS–Fe diagram (according to Dean & Arthur, Reference Dean and Arthur1989)
3.e.2. Wildfire evidence
Elevated PAH concentrations (tracers of palaeo-biomass burning) in several samples (Ch 54, Ch 59, Ch 75 and Ch 92), which are within the LN miospore Zone, and which may be a response to the Hangenberg crisis interval, have been detected (Fig. 12). The PAH concentrations are very similar (between 15–30 μg g−1 TOC; Fig. 12; Table 2) to those measured for the HBS horizon at Kowala (Marynowski et al. Reference Marynowski, Zatoń, Rakociński, Filipiak, Kurkiewicz and Pearce2012). Among the PAHs, three- four- and five-ring aromatics dominate with significant concentrations of compounds originating from rapid high-temperature processes such as benzo[a]anthracene, benzo[a]pyrene, benzo[e]pyrene, anthracene or methylanthracenes (Fig. 13a) (for comparison see e.g. Finkelstein et al. Reference Finklestein, Pratt, Curtin and Brassell2005; Marynowski & Filipiak, Reference Marynowski and Filipiak2007; Nabbefeld et al. Reference Nabbefeld, Grice, Summons, Hays and Cao2010). The occurrence of elevated concentrations of PAHs in all strata types of the LN miospore Zone is evidence of wildfires which occurred in the hinterland area.
Evidence of wildfire records close to the HE are well documented from the several sections in Europe and North America (Rowe & Jones, Reference Rowe and Jones2000; Scott & Glasspool, Reference Scott and Glasspool2006; Marynowski & Filipiak, Reference Marynowski and Filipiak2007; Prestianni et al. Reference Prestianni, Decombeix, Thorez, Fokan and Gerrienne2010), based on charcoal occurrence and elevated concentrations of unsubstituted PAHs. Such PAHs have been documented from the D/C Kowala section (Poland), with the highest concentrations just below and above the HBS horizon (Marynowski & Filipiak, Reference Marynowski and Filipiak2007). Recently, significant PAH amounts have also been found in the middle part of the HBS in the Kowala quarry (Marynowski et al. Reference Marynowski, Zatoń, Rakociński, Filipiak, Kurkiewicz and Pearce2012). The Chmielno–1 section represents another site with wildfire documentation near the D/C boundary, demonstrating the regional scale of this phenomenon.
3.f. Rock magnetism
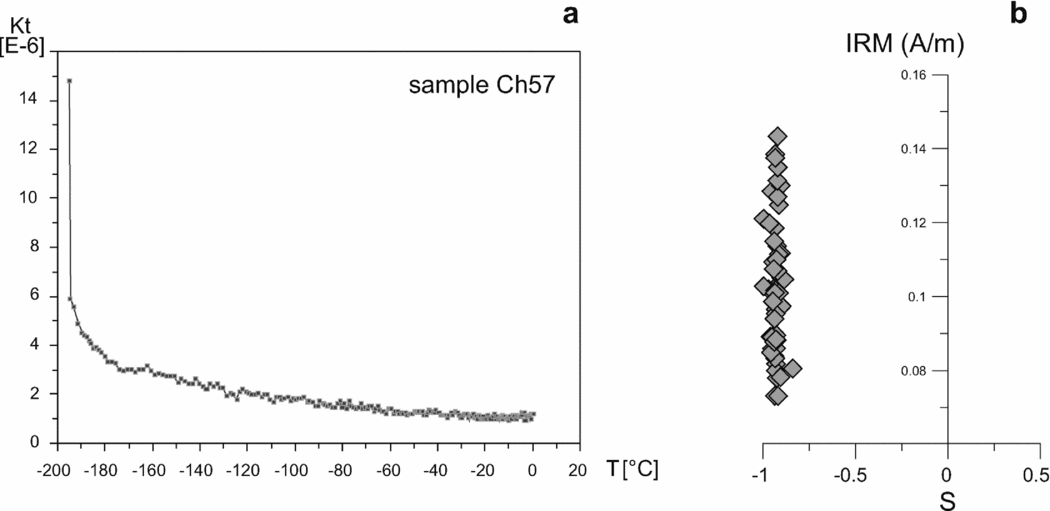
The average value of MS in the section is relatively high and reaches 88.58 × 10⁻⁹ m3 kg−1 (min. value 22.73; max. value 121.31 × 10⁻⁹ m3 kg−1). These values, together with the lack of a positive correlation (r = −0.66) between MS and ARM (magnetic concentration parameter), suggest that the dominant carriers of MS are paramagnetic (clay?) minerals (Hrouda & Kahan, Reference Hrouda and Kahan1991). Moreover, MS changes with temperature (tested on eight samples) revealed a significant drop during the temperature increase from −200°C to 0°C (Fig. 14a). Such behaviour indicates the presence of paramagnetic minerals in the samples. Additionally, higher amounts of aluminium (Al2O3) and titanium (TiO2) as well as Th and Zr were noted in the lowermost and upper parts of the section and co-vary in general with the MS changes.
Rock magnetic properties across the Devonian–Carboniferous boundary interval. (a) Magnetic susceptibility drop at lower temperatures indicates paramagnetic mineral behaviour; (b) cross-plot between S-ratio and IRM. Values close to −1 indicate low coercive minerals (magnetite) dominating in the ferromagnetic spectrum.
S-ratio is believed to be a simplified measure of low coercive- (magnetite) versus high coercive- (haematite) mineral contents. Close to –1 S-ratio values suggest that the main ferromagnetic mineral in the section studied is low coercive magnetite (Fig. 14b). Elevated S-ratio values and positive anomalies in the ARM curve, corresponding generally with reduced values of MS, indicate an increased concentration of fine-grained magnetite. The paramagnetic susceptibility signal is diluted by calcium carbonate content (the correlation coefficient between MS and carbonate content, calculated from TIC, is negative and equal to −0.76).
Three parts of the section with different rock magnetic properties can be distinguished (Fig. 11). The lowermost part (samples Ch 72–Ch 93 = depth 4014.8–4019.0 m) shows MS values of around 98.79 (× 10−9 m3 kg−1). The lack of significant correlation between MS and ARM indicates that paramagnetic minerals are the main carriers of magnetic susceptibility in this interval.
In the middle part of the profile (samples Ch 40–Ch 71 = depth 4008.0–4014.6 m) significantly lower values of MS (46.54 × 10⁻⁹ m3 kg−1, on average), together with high values of ARM, are present. This interval is characterized by a strong, positive correlation between MS and ARM, which indicates that ferromagnetic minerals are the dominant carriers of magnetic susceptibility.
In the highest part of the section (samples Ch 1–Ch 39 = depth 3999.0–4007.6 m), MS values are the highest and relatively the most stable in the entire profile (average 110.88 × 10⁻⁹ m3 kg−1). The lack of a positive correlation between MS and ARM indicates that the MS carriers are paramagnetic minerals. This is consistent with SEM analysis documenting terrigenous minerals as well as iron sulphides.