INTRODUCTION
Organic wastes which are often rich in plant nutrients as well as organic carbon (C) are widely used as soil amendments to improve soil physical properties (Khaleel et al. Reference Khaleel, Reddy and Overcash1980; Aggelides & Londra Reference Aggelides and Londra2000; Mantovi et al. Reference Mantovi, Baldoni and Toderi2005; Mbarki et al. Reference Mbarki, Labidi, Mahmoudi, Jedida and Abdelly2008; Ippolito et al. Reference Ippolito, Barbarcik, Paschke and Brobst2010), soil nutrient content (Sikora & Yakovchenko Reference Sikora and Yakovchenko1996; Naeini & Cook Reference Naeini and Cook2000; Cherif et al. Reference Cherif, Ayari, Ouzari, Marzorati, Brusetti, Jedidi, Hassen and Daffonchio2009; Van Eekeren et al. Reference Van Eekeren, De Boer, Bloem, Schouten, Rutgers, De Goede and Brussaard2009; Lehrsch et al. Reference Lehrsch, Brown, Lentz, Johnson-Maynard and Leytem2014) and disease suppression (Tilston et al. Reference Tilston, Pitt and Groenhof2002; Péres-Piqueres et al. Reference Péres-Piqueres, Edel-Hermann, Alobouvette and Steinberg2006). As such their application to land can both represent a valuable resource in agriculture, with the potential to improve agricultural sustainability provided that the loading of toxic metals is not excessive (Farrell & Jones Reference Farrell and Jones2009; Smith Reference Smith2009), and provide a useful route for disposal of otherwise unwanted materials (Slater & Frederickson Reference Slater and Frederickson2001; Lehrsch et al. Reference Lehrsch, Brown, Lentz, Johnson-Maynard and Leytem2014). With the directive from the European Union (EC Council Directive 1999) excluding green waste, such as garden waste amongst other organic wastes, from disposal by land-fill, there has been an increase in the amount of green waste being composted and applied to land. Similarly, with the intensification of the dairy industry leading to more cows being kept in housings, the faeces and urine become concentrated and can be relatively easily collected as manure and slurry. With increasing attention also being paid to the potential of soils to sequester C as a means of mitigating carbon dioxide (CO2) emissions to the atmosphere, there is significant interest in increasing soil C stocks, especially by the addition of relatively slow degrading materials. Whilst the recalcitrance of soil C is strongly influenced by physical protection for decay and accessibility to microbial and enzymatic attack (Dungait et al. Reference Dungait, Hopkins, Gregory and Whitmore2012), any treatment that adds C to soil is likely to contribute to sequestration to some extent because a fraction of it will be retained. Relative to studies on biochar as a means of sequestering C in soils, less attention has been paid to the potential for C sequestration of potentially more readily available organic wastes, such as composted green waste and livestock slurry.
Recommended compost applications are typically in the range 30–35 t/ha (WRAP 2015). In the UK, approximately 2 mt (dry matter) cattle slurry is produced annually, with highly variable composition depending on management systems and the contents of bedding and forage. It is applied at rates determined by the need to minimize the potential for soluble nitrogen (N) and dissolved organic C leaching to ground and surface waters and gaseous emissions, and to keep nuisance and offensive odours within tolerance limits (Pain et al. Reference Pain, Clarkson, Phillips, Klarenbeek, Misselbrook and Bruins1991; Defra 2009; Misselbrook et al. Reference Misselbrook, Del Prado and Chadwick2013; Ball et al. Reference Ball, Griffiths, Topp, Wheatley, Walker, Rees, Watson, Gordon, Hallett, McKenzie and Nevison2014). In the present work, the effects of repeated applications of compost and slurry to arable plots with a particular focus on the effects of amendments on soil C and N contents have been investigated. The work reported here is based on a medium-term (7 years) field experiment that was established with different rates of compost and slurry application. The objectives were to assess the contributions these amendments could make to soil C and N contents, to assess the effects on crop production and to determine the effects on soil biological processes of repeated additions of large quantities of organic materials on the composition of and the processes undertaken by the soil biological community (Péres-Piqueres et al. Reference Péres-Piqueres, Edel-Hermann, Alobouvette and Steinberg2006; Abdullahi et al. Reference Abdullahi, Akunna, White, Hallett and Wheatley2008; Griffiths et al. Reference Griffiths, Ball, Daniell, Hallett, Neilson, Wheatley, Osler and Bohane2010; Paterson et al. Reference Paterson, Neilson, Midwood, Osborne, Sim, Thornton and Millard2011; Donn et al. Reference Donn, Neilson, Griffiths and Daniell2012). The quantities added amounted to >1000 t (dry weight) compost/ha over 7 years at the upper extreme, representing >100 t C/ha and nearly 2 t N/ha in total over the period. The results of quantitative assessments of soil C and N contents, microbial biomass and microbial respiration (C mineralization) and bacterial community structure assessment are reported here for the first time. This has been done using depth- and volume-specific soil samples, so that the C and N values can be expressed on a unit area basis unconfounded by differences in soil bulk density and the increase in soil depth that may result from surface applications of large quantities of organic materials (Hopkins et al. Reference Hopkins, Waite, McNicol, Poulton, MacDonald and O'Donnell2009).
MATERIALS AND METHODS
Site and soils
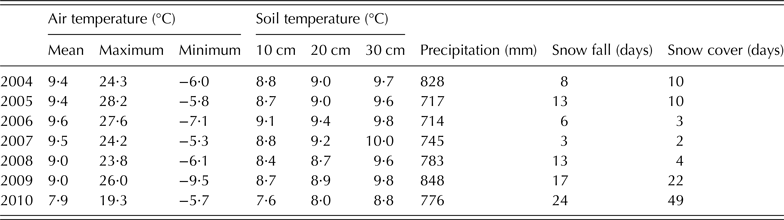
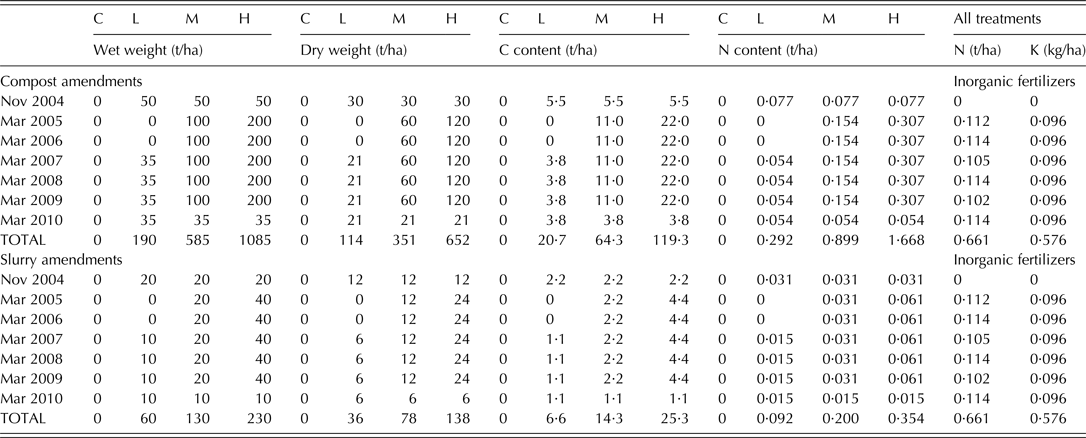
The field experiment was established in 2004 at Mid Pilmore on the James Hutton Institute site near Dundee, Scotland, UK (56°27′N, 3°4′W; 31 m asl) on a field that had been under arable cultivation for many years. The soil is a freely drained sandy-loam textured soil of the Carpow Association described in the Soil Survey of Scotland as a freely drained brown forest soil (Laing Reference Laing1976) and as a Dystric-Fluvic Cambisol in the World Reference Base (WRB) classification of soils (IUSS Working Group WRB 2015). Meteorological data are available from the Mylnefield weather station which is situated <650 m east of the experimental plots. The average annual rainfall is 660 mm and the mean annual temperature is 8·6 °C (30-year averages); the monthly average, maximum and minimum air temperatures, soil temperatures at 10, 20 and 30 cm depths, total monthly precipitation, the number of days of snowfall and the days of snow cover are reported in Table 1. All years of the experiment were slightly warmer and wetter than the 30-year averages except 2010, which was colder (Table 1). However, the 2010 mean temperature is dominated by a particularly cold December, which occurred after the crop was harvested (data not shown). The plots were 30 × 15 m2 on very gentle sloping (<5°) land with a southern aspect. They were cultivated with minimum tillage and sown annually with 180 kg seeds/ha spring barley (Hordeum vulgare L., cvar Optic). Supplementary N and potassium (K) were added annually as inorganic fertilizers (Table 2) and manganese (Mn) supplements were applied in 2007 and 2010 to all plots at the same rates. Herbicide and fungicide treatments were applied uniformly across all plots as required. The harvested grain yields were recorded in 2008, 2009 and 2010. The straw was baled and removed from the plots.
Summary of annual weather data

Compost and slurry additions and supplementary inorganic fertilizer additions to the Mid Pilmore plots

The supplementary inorganic fertilizer additions were the same for all plots.
C, control treatment receiving no organic amendments; L, M and H, low, medium and high amendments with municipal green compost or slurry from dairy cattle, respectively.
The plots were in randomized block design with seven treatments each replicated three times, with treatments applied annually between autumn 2004 and spring 2010 (Table 2). Briefly, there was a control treatment which received no organic amendments, and low, medium and high amendments with municipal green compost or slurry from dairy cattle. The actual amendment rates differed in some years (Table 2). The maximum compost amendments were determined by limits for N additions from waste application to land by the Scottish Environment Protection Agency, although the local availability of compost and slurry in some years meant that the maximum applications were not always possible (Table 2). The compost was derived from green waste (mostly garden waste) that met the British Standards Institution specification (WRAP 2011). The compost composition varied from year to year, but the mean dry matter content was 601 g/kg (s.d. = 35·5), the mean dry weight C concentration was 183 g/kg (s.d. = 17·9), the mean dry weight N concentration was 14 g/kg (s.d. = 0·7), and the mean C-to-N ratio was 13·1 (s.d. = 1·20). The relatively low C concentration was due to the presence of low C materials such as soil in the garden waste. The slurry was obtained from local dairy farms and its properties also varied from year to year, but the mean dry matter content was 46 g/kg (s.d. = 3·4), the mean dry weight C concentration was 424 g/kg (s.d. = 13·8), the mean dry weight N concentration was 42 g/kg (s.d. = 5·8), and the mean C-to-N ratio was 10·3 (s.d. = 1·53). Based on the total organic C and N contents in the 0–30 cm depth of soil of 69 t C/ha and 3·1 t N/ha (6·9 kg C/m2 and 0·31 kg N/m2), respectively, the gross total additions of C and N in the compost between 2004 and 2010 represented increases of 172, 93 and 30% relative to the initial soil C, and increases of 58, 29 and 9·4% relative to the initial soil N for the high, medium and low compost additions, respectively. For the slurry additions, the gross additional C amounts were 36, 21 and 9·6% relative to the initial soil C, and the gross additional N amounts were 11, 6·5 and 3·0% relative to the initial soil N for the low, medium and high additions.
Soil sampling and preparation
In late summer 2010, just before harvest, volume-specific soil samples were taken at three positions in each plot in two different ways. First, soil was collected from the 0–20 cm depth in a 20 × 20 cm2 hole dug with a trowel and then the soil from the 20–30 cm depth was collected from the same hole. The samples from the different depths were kept separate, but the soil samples from the different sampling sites within each plot were combined to give one composite soil sample for each depth (i.e. 42 samples comprising seven treatments × two depths × three replicates). These samples were used to determine most of the soil parameters (see below). A second lot of samples were collected that allowed the depth distribution of soil C and N at greater resolution. At three locations in each of the control, high compost and high slurry plots, a hole 30 cm deep was dug and soil samples from the 0–3, 3–6, 6–9, 9–12, 12–15, 15–18 and 18–21 cm depths were collected from the exposed vertical profiles using 5 × 5 × 5 cm2 metal boxes (Kubiena tins) inserted into the profile to give 125 cm3 soil samples. This procedure followed the method described by Hopkins et al. (Reference Hopkins, Waite, McNicol, Poulton, MacDonald and O'Donnell2009). Samples from the different sampling sites within each plot for the respective depths were combined to give composite samples for each plot and depth (i.e. 63 samples comprising three treatments × seven depths × three replicates).
In 2007, 200-g soil samples were collected from the 0–10 cm depth for bacterial community structure analysis every month from April to September inclusive. The samples were sieved to pass through a 4 mm sieve and 1·5-g sub-samples snap-frozen in liquid N and stored at −80 °C prior to extraction.
Soil physical measurements and sample preparation
Stones and fragments of plastic (which occurred occasionally in the compost treatments) were removed by hand from each sample and their volumes were used to correct soil bulk density estimates. All the soil samples were weighed in field-moist condition and sub-samples of approximately 30 g dry weight from 0–20 cm and 20–30 cm depths and sub-samples of approximately 5 g dry weight of the 3 cm incremental samples were dried in a fan assisted oven at 105 °C for 48 h. The mass difference was used to estimate water content and the dry weight of soil used to estimate soil bulk density. The remaining undried soil was divided into two approximately equal portions, one of which was stored refrigerated (3–5 °C) for no more than 7 days before soil microbial biomass was determined, and the other was air-dried for 4 days in an unheated glasshouse prior to chemical analysis.
Soil chemical analyses
Sub-samples of air-dried soils were ground in a mortar and pestle and the organic C and total N concentrations determined using a Shimadzu TOC-VCSN® carbon analyser (Shimadzu Scientific Instruments, Tokyo, Japan). Soil pH was determined in a 1:2·5 wt:vol. suspension of soil in water using a pH meter with glass electrode. For all analyses, two analytical replicates were used for each sub-sample.
Soil biological analyses
Sub-samples of the refrigerated soil samples from the 0–20 and the 20–30 cm depths of the control, high compost and high slurry addition treatments were used to determine soil microbial biomass and basal respiration rates. Soil microbial biomass was determined using the substrate (glucose)-induced respiration (SIR) rate (Anderson & Domsch Reference Anderson and Domsch1978) as adapted by Hopkins & Shiel (Reference Hopkins and Shiel1996) using micro-respiration chambers described by Heilmann & Beese (Reference Heilmann and Beese1992). Substrate-induced respiration data have not been converted to microbial biomass because of the lack of a consistent calibration factor for the conversion from SIR to biomass associated with recent large additions of organic materials (Sparling et al. Reference Sparling, Ord and Vaughan1981; Martens Reference Martens1995); thus, SIR data are expressed as a proxy for microbial biomass. The same chambers were used (without substrate addition) to determine the basal respiration rate over 96 h at 21 °C. A Varian 90-P gas chromatograph (Varian Medical Systems, Salt Lake City, UT, USA) fitted with a 1·32 m long × 3 mm internal diameter stainless steel-column packed with 80/100 mesh Porapak Q (Agilent Technologies LDA UK Ltd, Stockport, UK) porous polymer adsorber (and a thermal conductivity detector) was used to determine the CO2 produced in the SIR and the basal respiration assays.
Soil bacterial community structures were estimated as described in Deng et al. (Reference Deng, Zhang, Yin, Wang, Mitchell, Griffiths and Daniell2010). Briefly, 1 g of soil was suspended in 2 ml of 0·12 m sodium phosphate (NaHPO4) in 1% sodium dodecyl sulphate (SDS); 1 ml of this slurry was ‘bead-beaten’ at 30 Hz, 3 × 1·5 min2 (Retsch Mixer Mill MM300, Retsch, Haan, Germany ) in 96-well blocks (Qiagen, Hilden, Germany) with tubes kept on ice and rotated between pulses to ensure an even beating. Samples were then centrifuged at 5000 rpm for 5 min and the aqueous phase transferred to 96-well blocks. The samples were subjected to phenol/chloroform and chloroform extraction, precipitated with isopropanol/sodium acetate and washed with 70% ethanol. The resultant pellet was re-suspended in 50 µl of 10 mm Tris–HCl (pH 8·5) and treated with polyvinylpolypyrrolidone (PVPP) (Sigma, Dorset, UK) using Multiscreen HTS HV plates (Merck Millipore Corporation, Darmstadt, Germany) after the PVPP was equilibrated by repeated water addition (100 µl). Bacterial DNA was amplified from DNA extracts, using general bacterial primers. A nested polymerase chain reaction (PCR) approach was applied as insufficient DNA yield was obtained from soil samples with a single round of amplification; PCR was performed on extracted DNA targeting bacterial 16S rRNA gene using universal primers. For the first round of PCR amplification 16F27 (5′AGAGTTTGATCMTGGCTCAG 3′) (Lane Reference Lane, Stackebrandt and Goodfellow1991) and 1405R (5′CGGGCGGTGTGTACAAG 3′) (Pennanen et al. Reference Pennanen, Caul, Daniell, Griffiths, Ritz and Wheatley2004; MWG Biotech AG, Ebersberg, Germany) were used as primers. The final volume of the reaction mix (25 µl) was achieved by combining 24 µl of a ‘master mix’ which contained 2·5 units (U) DNA polymerase (Expand High Fidelity enzyme mix – Roche Diagnostics Ltd, Burgess Hill, UK), 5 pm of each primer, 0·5 mm final concentration of each nucleotide, 2·5 µl of Expand High Fidelity buffer (Roche Diagnostics Ltd) and 0·5 mg of bovine serum albumin (BSA) with 1 µl of extracted DNA as template. Polymerase chain reaction was performed with a DNA Engine Dyad thermocycler (MJ Research, Genetic Technologies, Miami, FL, USA), with an initial denaturation step of 95 °C for 5 min, followed by 35 cycles of 95 °C for 45 s, 54 °C for 45 s and 72 °C for 90 s; cycling was completed by a final extension period of 72 °C for 5 min. These amplification products were then subjected to a second PCR amplification using primers: 63F (5′CAGGCCTAACACATGCAAGTC 3′) (Marchesi et al. Reference Marchesi, Sato, Weightman, Martin, Fry, Hiom, Dymock and Wade1998) labelled with 6-FAM and 1087R (5′CTCGTTGCGGGACTTACCCC 3′) (Lane Reference Lane, Stackebrandt and Goodfellow1991) labelled with VIC (ABI). The second PCR was carried out using 1 µl of a tenfold dilution of first round product as template and a shortened elongation time of 1 min. Polymerase chain reaction products were visualized by agarose gel electrophoresis (1·5%) with tris-borate-ethylenediaminetetraacetic acid (TBE) as buffer. The nested PCR approach used gave bands of equal intensity as judged by agarose gel electrophoresis; 9·5 µl of PCR product was digested with 0·5 µl (5 U) of Alu I restriction enzyme (Promega Corporation, Southampton, UK) at 37 °C. Digests were then diluted tenfold and 1 µl mixed with 8·95 µl of formamide (ABI) and 0·05 µl of LIZ® labelled GS500 size standard (ABI). Samples were analysed on an ABI 3730 automated sequencer. Post-run analysis was performed using GeneMapper (ABI) to allow peak sizing and generation of a peak area for each identified peak. A fixed bin width of 5 bp was used as in preliminary analysis as this produced uniform and stable peak identification imposing a peak height threshold of 50 fluorescent units. Data were then processed in Microsoft Excel® to yield peak relative abundance with subsequent removal of peaks representing <1% of total fluorescence in each sample to reduce any effect of capillary loading. Hellinger transformation was performed to reduce the effect of dominant peaks (Blackwood Reference Blackwood, Cooper and Rao2006).
Statistical analyses
All results except bacterial community structure are expressed as the means of three replicates and standard error (s.e.) where appropriate. Before statistical analysis, normality or residuals and homogeneity of variances were checked and, where, necessary logarithmic transformations were applied to achieve normality. The data were analysed using analysis of variance (ANOVA) and significant differences were identified using the Tukey's post hoc Honestly Significant Difference at P < 0·05. Bacterial community analysis used six replicates and was assessed by a combination of Principal Component Analysis (PCA) and ANOVA analysis with Fisher's Least Significantly Difference (LSD) to detect differences. All statistical procedures were performed using GenStat 18th edition (VSN Hemel Hempstead, UK).
RESULTS
Barley yield
Barley yields (converted to 15% moisture content) varied between the years, but the effect of compost and slurry addition was to increase yields in comparison with the control (Fig. 1). The barley yield was increased significantly (P < 0·05) in 2008 with increasing compost addition compared with the control. For the slurry additions, there was a significantly (P < 0·05) positive effect on yield, but no significant difference between the rates of slurry addition (Fig. 1). Over the subsequent years, 2009 and 2010, compost addition continued to have a significantly (P < 0·05) positive effect on yield. However, differences between the rates of compost addition became insignificant so that by 2010 the low, medium and high compost addition treatments all had similar yields (Fig. 1). By 2010, the low compost treatment had received a total of 114 t compost/ha (on a dry weight basis), 20·9 t C/ha and 292 kg N/ha (Table 2) which, when considered alongside the supplementary fertilizers, is likely to have been sufficient to satisfy the crop demands for N and other nutrients over that period. The progressive loss of an effect of the high and medium compost addition rates between 2008 and 2010 indicates that an excess of compost relative to crop demand for nutrients had been applied (Fig. 1). A similar trend of increasing yields due to slurry additions and the loss of the differential effect between the low, medium and high additions over time was also observed, although the treatment effect was strongest in 2009 (Fig. 1).
Barley yields expressed at 15% moisture content for the different compost and slurry treatments. Each value is the mean of three replicates and the vertical bars are s.e.

Soil physical and chemical properties
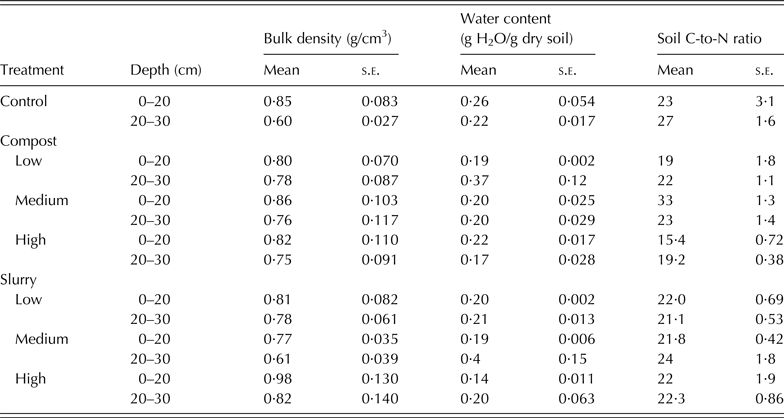
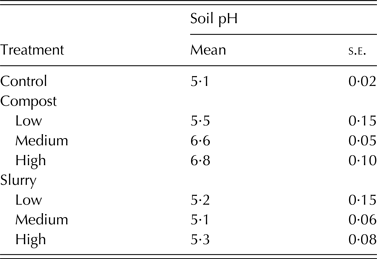
Soil bulk densities were relatively low (range 0·60–0·98 g/cm3) and, with few exceptions, the values for the 0–20 cm depth were similar to those for the 20–30 cm soil depth (Table 3). However, there were no consistent effects of the treatments on bulk density. The soil water contents varied (ranging from 0·14–0·37 g H2O/g dry soil), especially in the 20–30 cm depth. In contrast to the compost amendments, the slurry treatments had a significant (P < 0·05) effect of reducing water content in the 0–20 cm depth with increasing addition (Table 3). Compost addition led to progressive and significant (P < 0·05) increases in soil pH, but slurry additions had no effect on soil pH (Table 4).
Soil bulk density, water content and C-to-N ratios for the different compost and slurry treatments

Each value is the mean of three replicates. Soil samples were taken after 7 years of compost or slurry addition in late summer 2010.
Soil pH for the different compost and slurry treatments

Each value is the mean of three replicates. Soil samples were taken after 7 years of compost or slurry addition in late summer 2010.
Soil carbon content
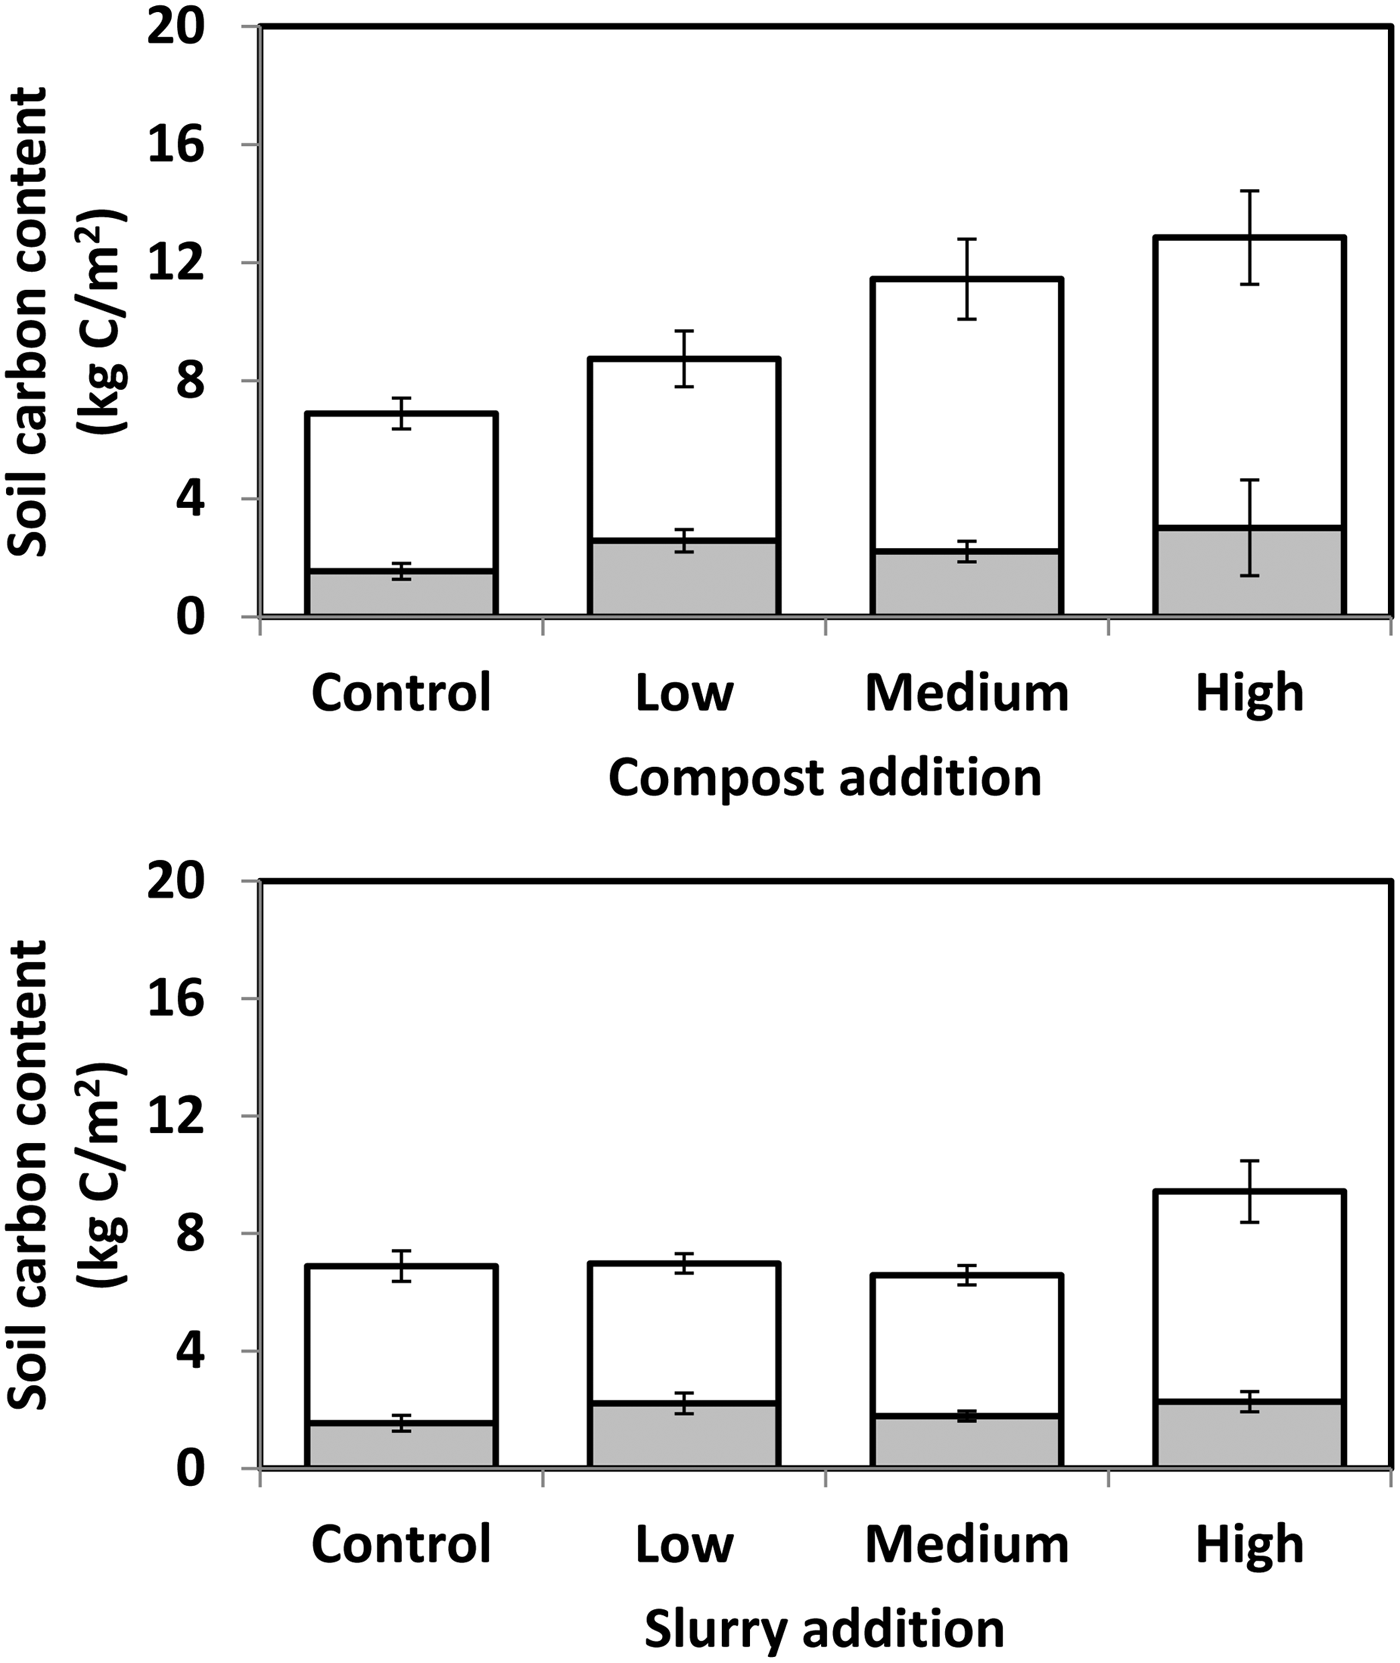
Compost addition had a significant (P < 0·05) effect on soil C content, particularly because of increased C in the 0–20 cm layer (Fig. 2). By 2010, the additional C in the 0–30 cm depth relative to the control soil were 1·9, 4·6 and 6·0 kg C/m2 for the low, medium and high compost additions, respectively. In contrast, the amounts of C added as compost by 2010 were 2·1, 6·4 and 11·9 kg C/m2 (20·9, 64·2 and 119·3 t C/ha), respectively, for the low, medium and high compost additions (Table 2). Thus, the amount of additional C in the soil was equivalent to 0·89, 0·71 and 0·50 of the C added as compost over the period 2008 to 2010 in the 0–30 cm soil depth for the low, medium and high compost additions, respectively. It was notable that the apparent losses of compost C during the experiment were proportionately greater at the higher addition rates. Comparable increases in total C following addition of composted biosolids have been reported by Mantovi et al. (Reference Mantovi, Baldoni and Toderi2005) and Ippolito et al. (Reference Ippolito, Barbarcik, Paschke and Brobst2010).
Soil carbon content in the 0–20 cm depth (open bars) and 20–30 depth (shaded bars) for the different compost and slurry treatments. Each value is the mean of three replicates and the vertical bars are s.e. Soil samples were taken after 7 years of compost or slurry addition in late summer 2010.

Slurry addition only had a significant (P < 0·05) effect on soil C content at the highest rate of addition and the effect was confined to the 0–20 cm depth (Fig. 2). The additional C in the 0–30 cm soil depth of the high slurry treatment was 2·5 kg C/m2 in 2010, whilst the total C addition in slurry between 2008 and 2010 was also 2·5 kg C/m2 (25·3 t C/ha; Table 2), thus the additional C was equivalent to the total amount of C added.
Soil nitrogen content
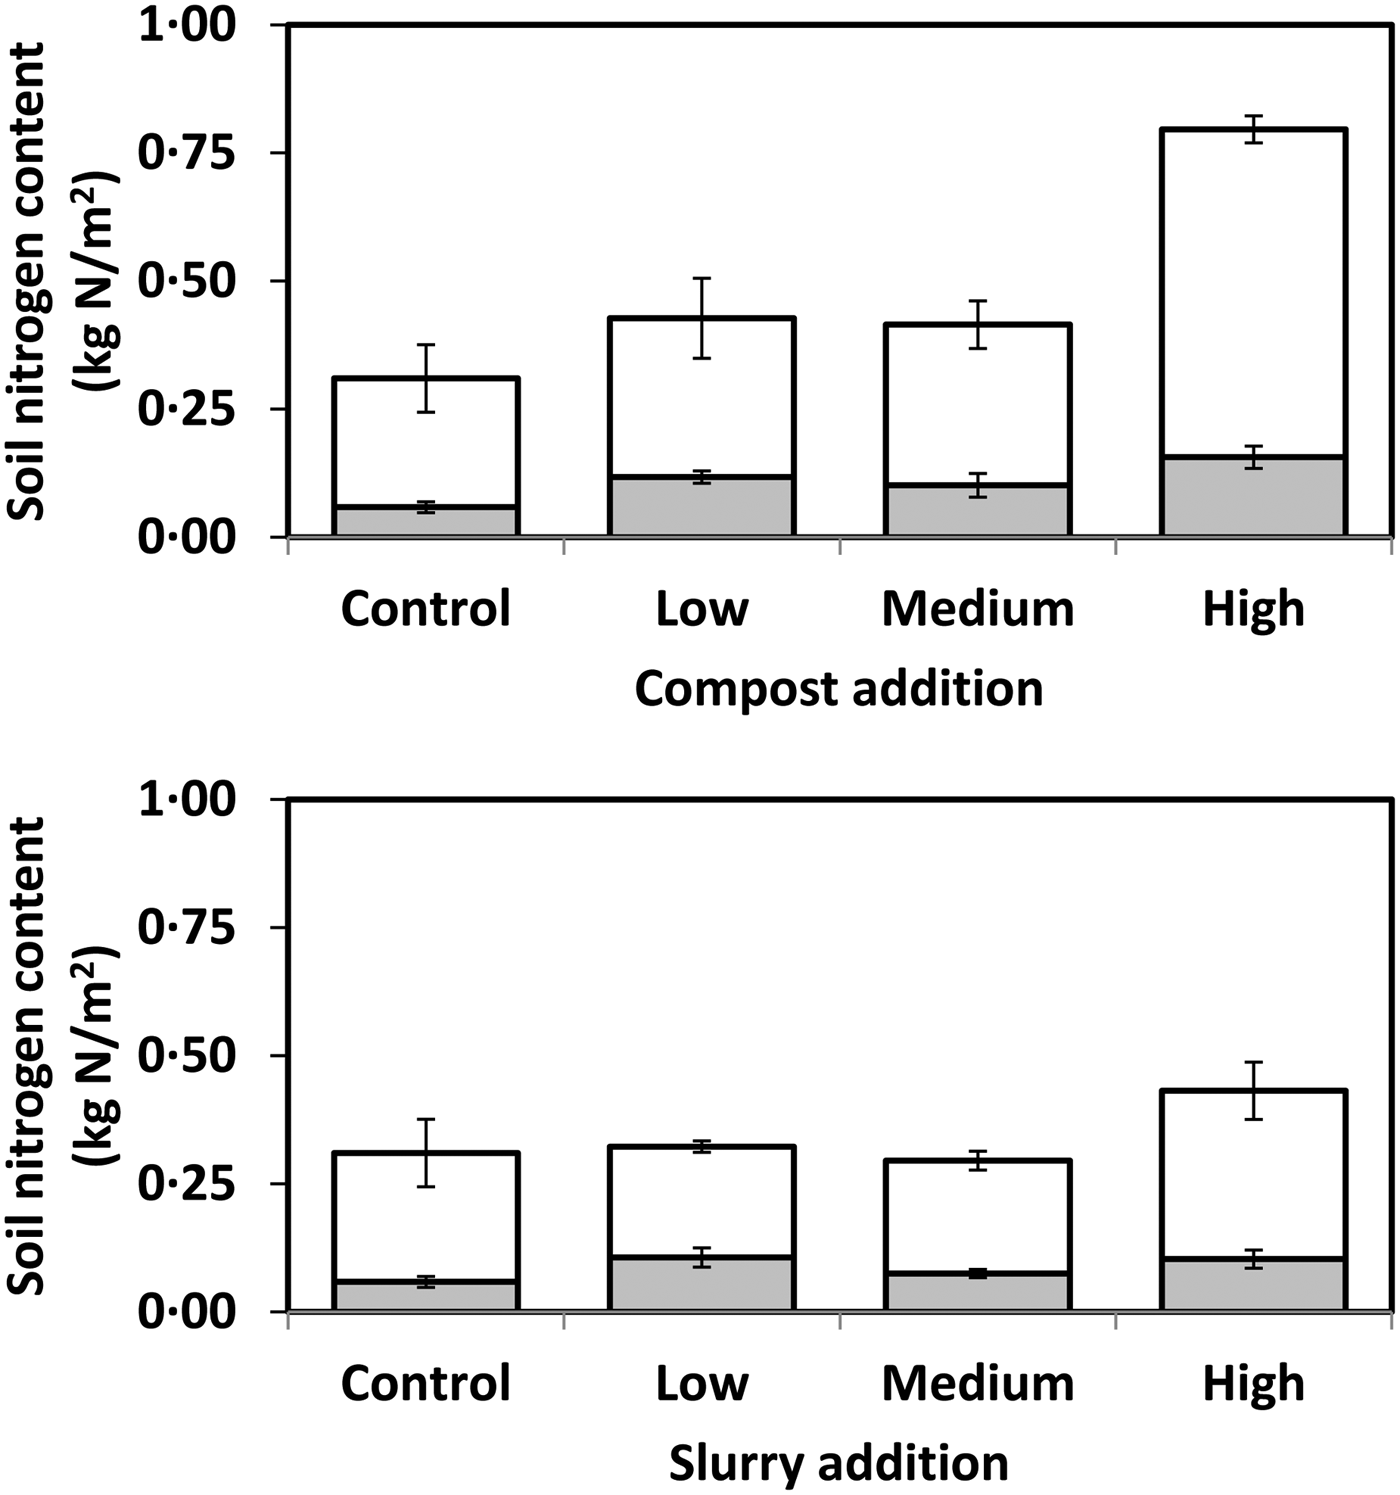
The effect of compost additions on soil N content followed the same trend as the C content, although there was no significant difference in total soil N between the low and medium compost additions. Relative to the control, the additional N content of the 0–30 cm depths of the soils were 0·12, 0·10 and 0·49 kg N/m2 in 2010, compared with additions in the compost of 0·29, 0·90 and 1·67 t N/ha, respectively, for the low, medium and high additions, or 0·92, 2·0 and 3·5 kg N/m2, respectively (Table 2; Fig. 3). The additional N was therefore equivalent to 0·13, 0·05 and 0·14 of the N added in compost.
Soil nitrogen content in the 0–20 cm depth (open bars) and 20–30 depth (shaded bars) for the different compost and slurry treatments. Each value is the mean of three replicates and the vertical bars are s.e. Soil samples were taken after 7 years of compost or slurry addition in late summer 2010.

Slurry addition only had a significant (P < 0·05) effect on soil N content at the highest addition (Fig. 3), as was seen for C (Fig. 2). The additional N in the 0–30 cm soil depth of the high slurry treatment was 0·12 kg N/m2 in 2010, whilst the total N addition in slurry between 2008 and 2010 was 3·5 kg N/m2 (0·354 t N/ha; Table 2), thus the additional N was equivalent to only about 0·03 of the added N.
Distribution of carbon and nitrogen with depth
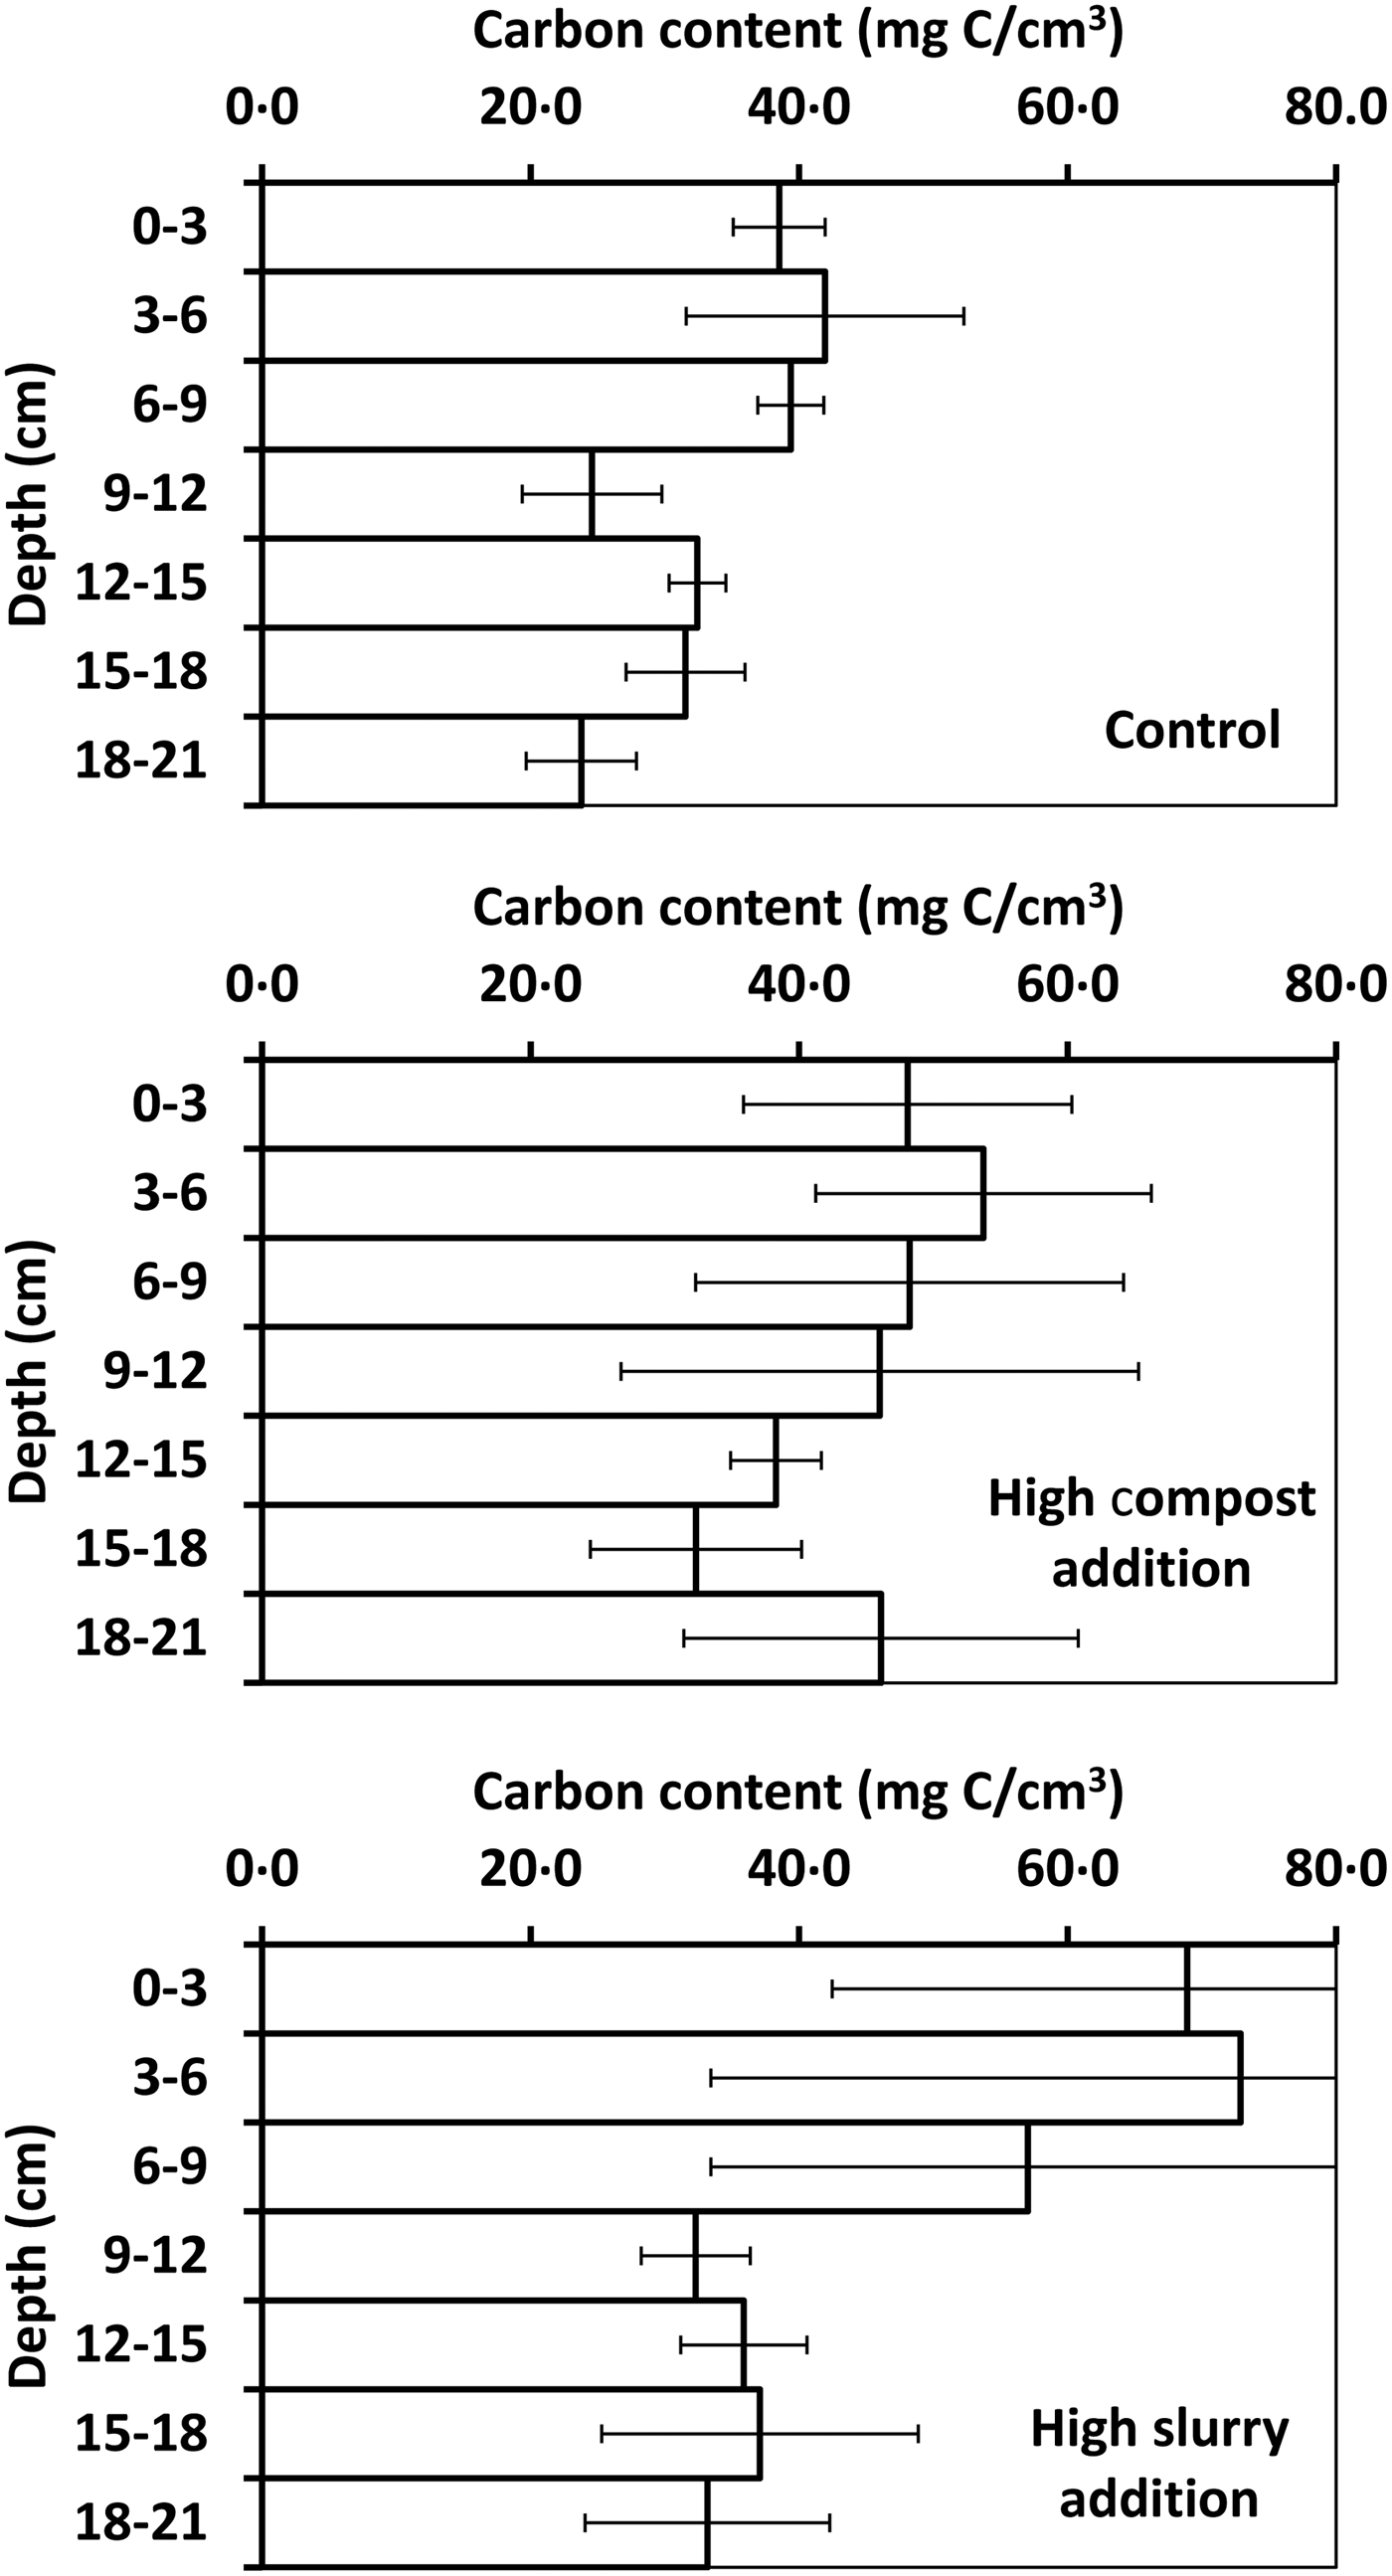
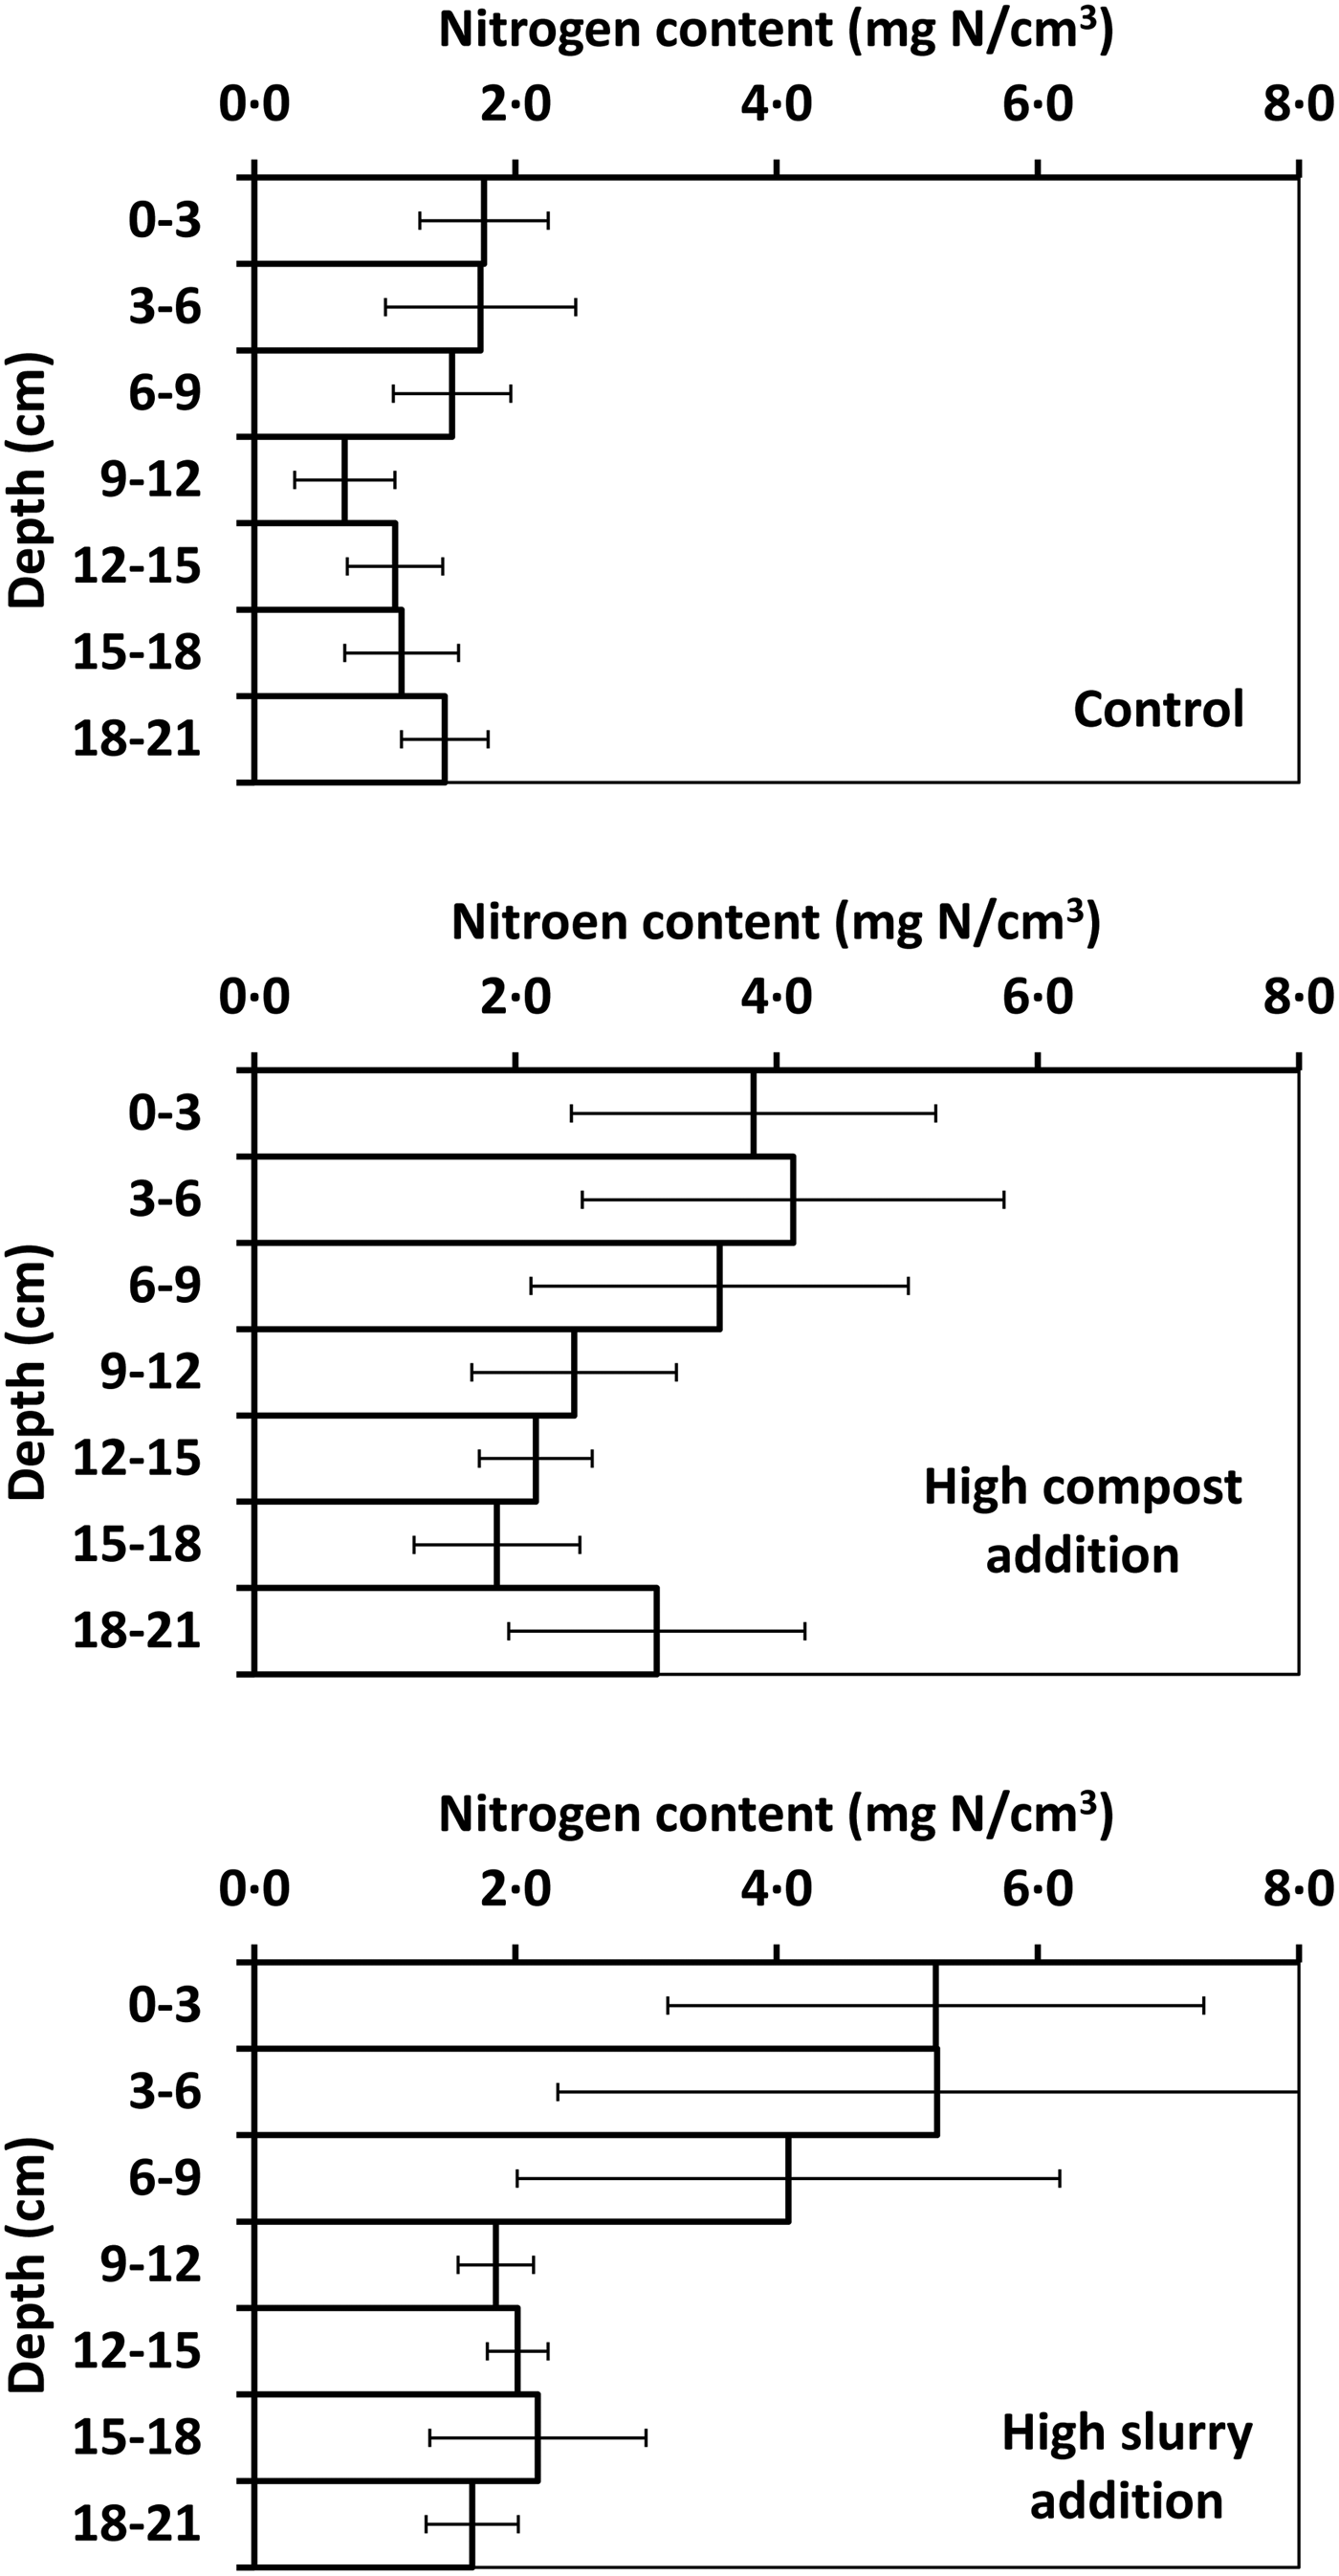
Carbon and N distribution down the profile followed each other closely (Figs 4 and 5). In the control, C and N were concentrated towards the surface (Figs 4 and 5), but the decline with depth between 0 and 21 cm was relatively gentle, consistent with the soil having been previously cultivated. In both the high compost and high slurry treatments, there was additional N near the soil surface, especially in the 0–10 cm depth and most notably for the slurry addition, but the large variances of the C and N estimates for the 3 cm depth slices meant that most of the differences were not significant (Figs 4 and 5).
Soil carbon content for 3 cm depth increments over 0–21 cm for the different compost and slurry treatments. Each value is the mean of three replicates and the bars are s.e. Soil samples were taken after 7 years of compost or slurry addition in late summer 2010.

Soil nitrogen content for 3 cm depth increments over 0–21 cm for the different compost and slurry treatments. Each value is the mean of three replicates and the bars are s.e. Soil samples were taken after 7 years of compost or slurry addition in late summer 2010.

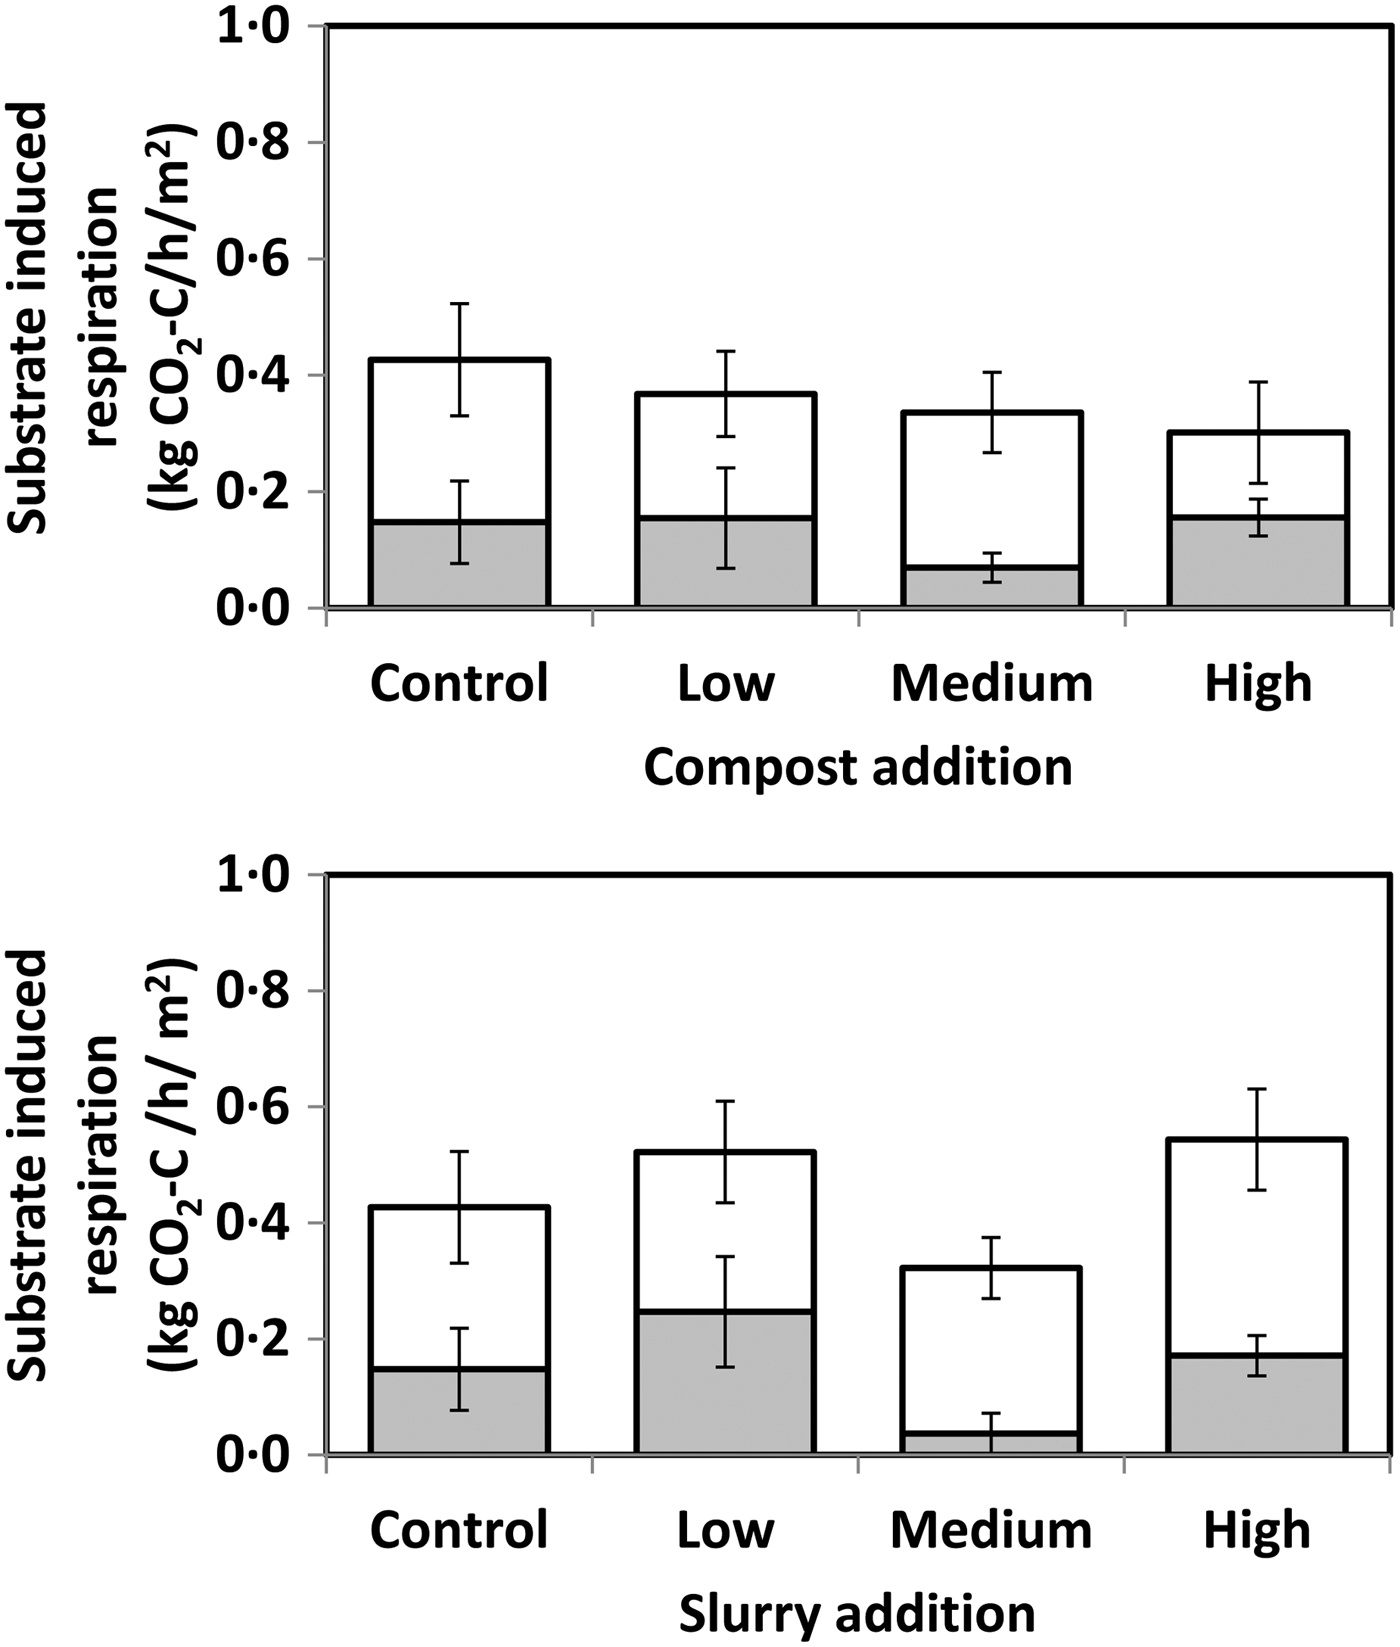
Substrate-induced respiration rate (proxy for soil microbial biomass) in the 0–20 cm depth (open bars) and 20–30 depth (shaded bars) for the different compost and slurry treatments. Each value is the mean of three replicates and the vertical bars are s.e. Soil samples were taken after 7 years of compost or slurry addition in late summer 2010.

Soil biological properties
The SIR (a proxy for soil microbial biomass) values declined significantly (P < 0·05) with increasing compost addition (Fig. 6). This was due to reduced SIR in the 0–20 cm depth, whilst the SIR for the 20–30 cm depth showed no significant effect of compost addition (Fig. 6). Slurry addition at the highest rate led to a significant increase (P < 0·05) in SIR in the 0–20 cm depth only. The SIR values for the whole 0–30 cm profile appeared to decline in the medium slurry addition relative to the low and high additions, but this was due to a very small (and possibly anomalous) SIR content in the 20–30 cm depth (Fig. 6).
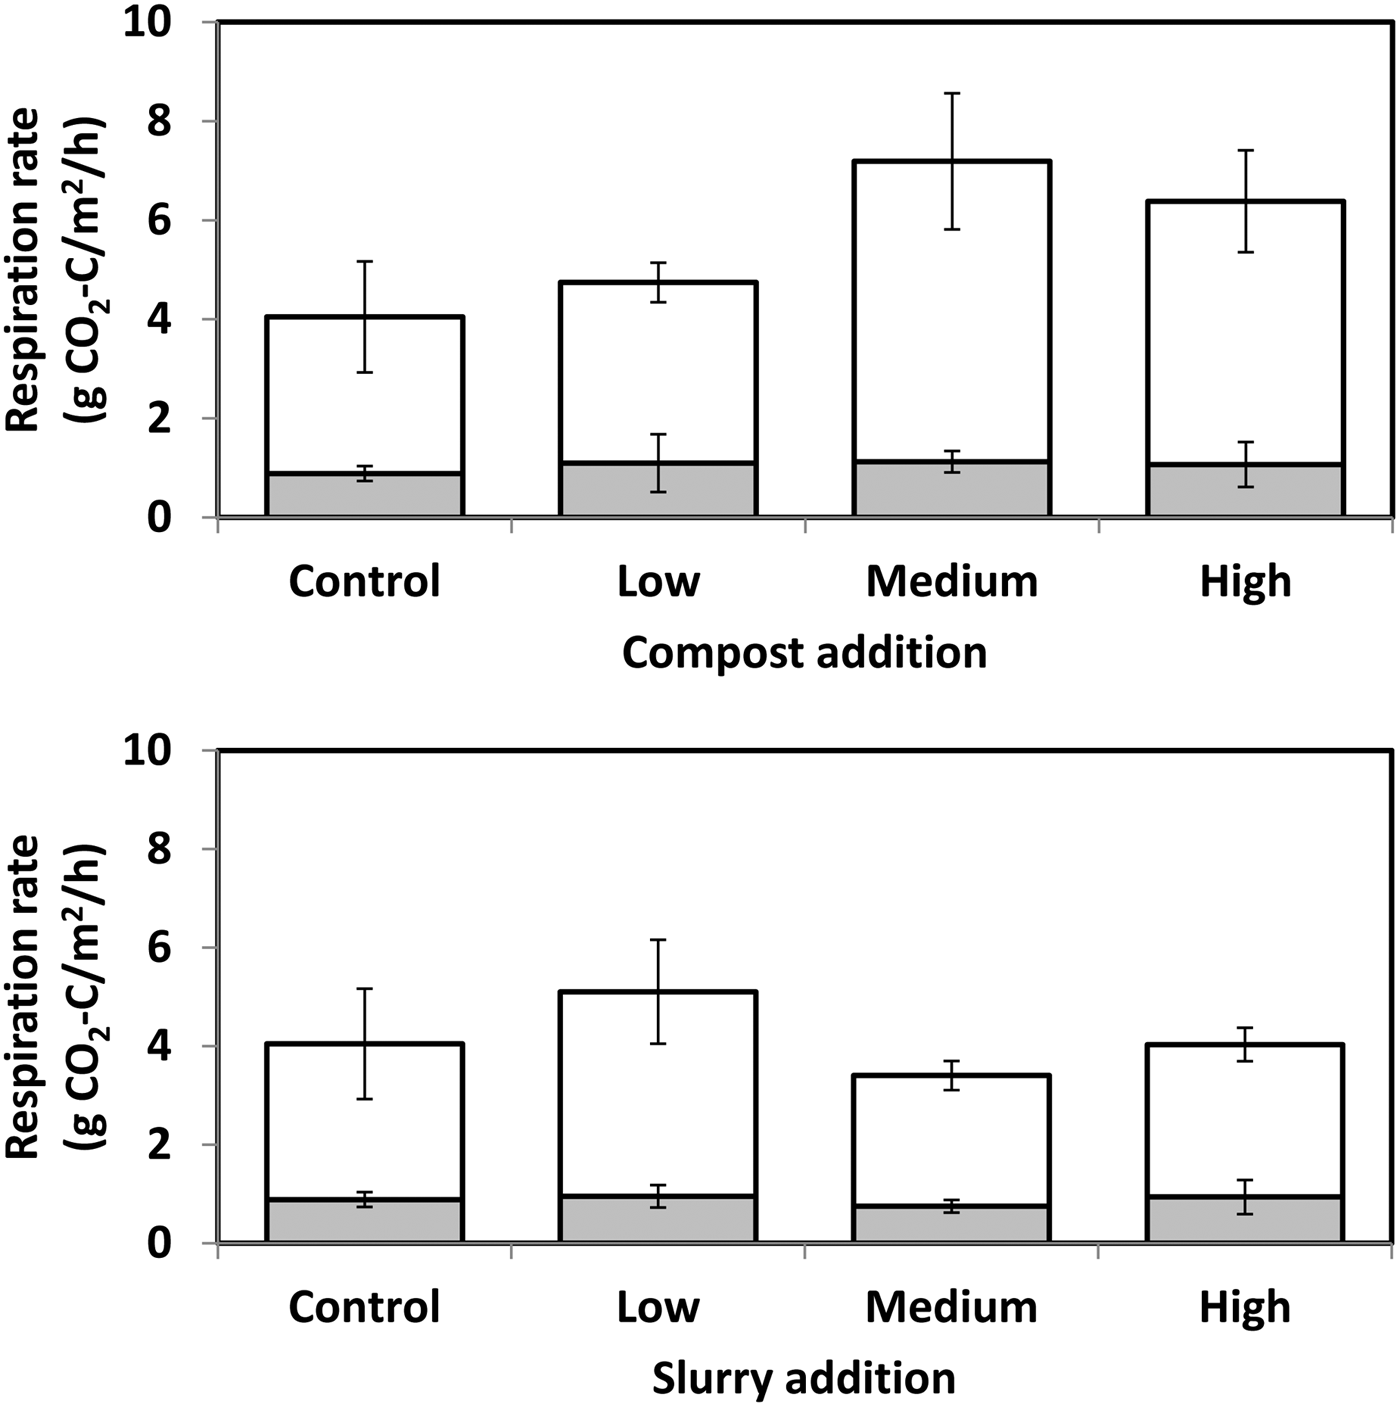
Respiration rate in the 0–20 cm depth was significantly (P < 0·05) increased by medium and high compost addition rates, but not by the low rate (Fig. 7). Compost had no significant effect on respiration in the 20–30 cm depth (Fig. 7). Slurry addition had no significant effect on respiration rate at any of the rates of application in either soil depth (Fig. 7).
Soil respiration rate in the 0–20 cm depth (open bars) and 20–30 depth (shaded bars) for the different compost and slurry treatments. Each value is the mean of three replicates and the vertical bars are s.e. Soil samples were taken after 7 years of compost or slurry addition in late summer 2010.

Soil bacterial community structure
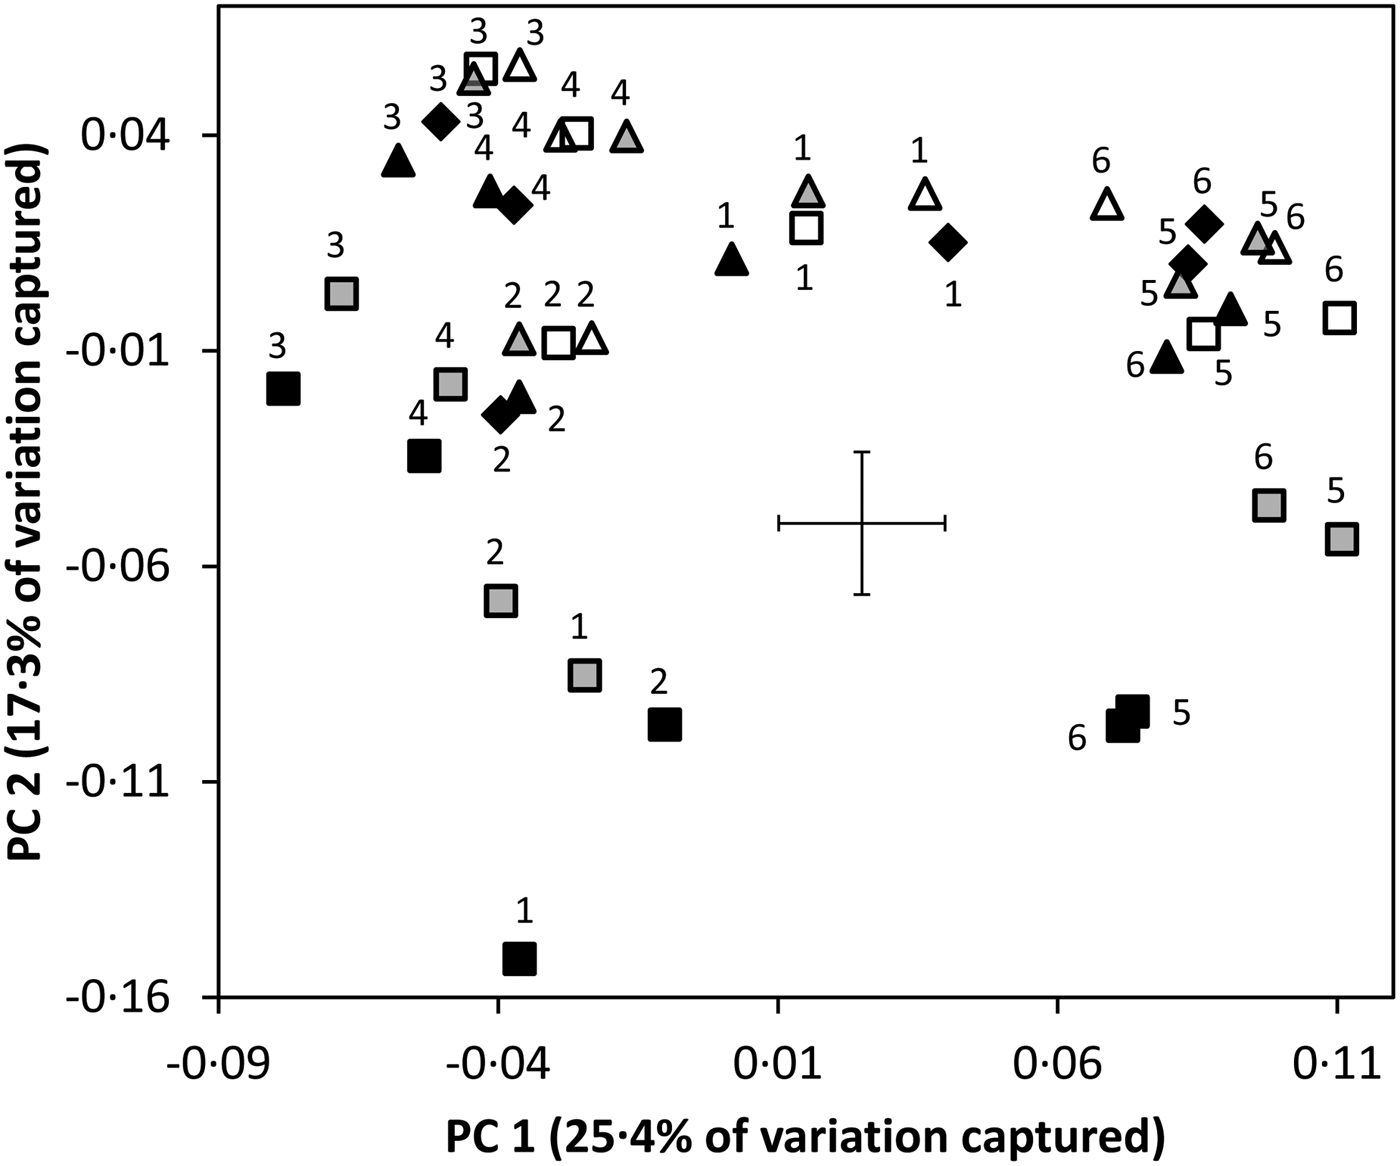
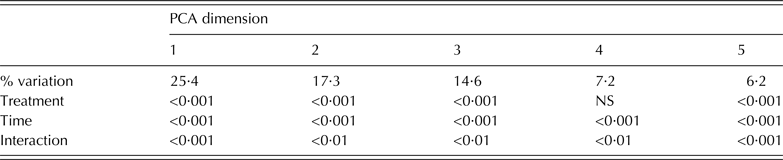
The soil bacterial community was altered significantly by both amendment additions and time of sampling, with an additional significant interaction between the two factors (Table 5). The first five dimensions of the PCA analysis captured >0·70 of the variation with similar effects observed across these dimensions (Table 5). The significant interactions between treatment and time (P < 0·001 and 0·01, respectively) are shown in Fig. 8. Significant treatment effects (P < 0·001 in both dimensions) are driven by shifts in the bacterial community associated with high compost addition. The time factor (P < 0·001 in both dimensions) is driven by a temporal shift in bacterial structure over the course of the year, stabilizing late in the crop cycle.
Principal Components Analysis for bacterial community structure showing the different treatment and time combinations. Each point represents the mean of six samples. Diamonds, control treatment; squares, compost; and triangles, slurry addition; for the amended samples open, grey and black symbols represent low, medium and high additions, respectively, and the numbers 1–6 monthly samples from April to September. The error bars represent the least significant difference at the P < 0·05 level. Soil samples were taken after 3 years of compost or slurry addition in late summer 2007.

Summary of Principal Component Analysis (PCA) for bacterial community structure for different compost and slurry treatments in 2007

Values indicate the significance values for treatment, time and the interaction between them for the first five dimensions of the analysis and the percentage variation captured in each of these dimensions.
DISCUSSION
For the purposes of further discussion, the low and medium slurry treatments will be not be considered in detail because their effects were small and, for as far as is possible, the high slurry treatment will be regarded as similar in terms of nutrient addition to the low compost treatment.
Effects on yield
The positive effect of compost on barley yield is likely to be due to a combination of effects on soil properties, including soil pH and physical properties. Although no consistent effect of compost on soil moisture content was detected in the samples taken in 2010, these measurements were a single point in time and cannot reflect accurately the soil water regime during the whole course of the experiment. Similarly, no consistent effect of compost on soil bulk density was detected, but this was probably because the soil bulk density even in the control soil was very low due to the sandy texture of the soil, the limited trafficking that the plots received and the fact that the soil samples were taken in the summer when the root biomass would have been at or close to its greatest; a large amount of root in the sample would have reduced the soil bulk density substantially. It is highly likely that bulk density measurements taken in the winter, when the influence of roots would have been minimal, would show an effect of the compost, and it is notable that Griffiths et al. (Reference Griffiths, Ball, Daniell, Hallett, Neilson, Wheatley, Osler and Bohane2010) did detect a reduction in soil bulk density with compost addition treatment at this site.
The most influential contributions that compost and slurry additions made to yield increases are likely to have been through a combination of additions of nutrients and changes to physical conditions, but the effects cannot be separated. The amounts of N added in compost were less than those added as fertilizers and it is therefore likely that the N in the compost will have contributed to the yield (Sikora & Yakovchenko Reference Sikora and Yakovchenko1996) alongside other nutrients (Mkhabela & Warman Reference Mkhabela and Warman2005). The fact that the effect of compost and, to a lesser extent, slurry addition on yield declined over successive years suggests either: (a) a season effect that depressed yield even in the presence of an adequate nutrient supply in the later years, although it is not obvious what that effect is, or (b) that the cumulative effects of the low and medium additions were great enough to match the effect of a single large addition (more likely in the case of the compost addition). Put another way, the results indicate that repeated addition of compost at about 200 t/ha/yr was more than required to optimize yield. By contrast in the slurry treatments, the fertilizer N additions were large by comparison with the N in the slurry and thus the treatment effects of the slurry were masked to some extent. The fact that the compost and slurry will have supplied N in complex organic forms which will have been mineralized gradually into plant-available inorganic forms during decomposition means that the supply of N to the crop is likely to have been extended over more than one season. The C:N ratio of the compost and slurry (approximately 10 and 13, respectively) are both well below the threshold of approximately 20 below which net mineralization of N would be expected (Harmsen & van Schreven Reference Harmsen and van Schreven1955), so it can be assumed that these amendments would have released N in plant-available forms during the whole period of the experiment.
Effects on soil carbon
Compost and slurry additions had obvious and completely expected effects on soil C and N contents, with increases detectable for both elements for all the compost treatments and the high slurry treatment. The additional C in the compost treatments declined as a proportion of the C added. This may be the result of one or more of the following factors. Firstly, at the higher compost rate, the compost may have been more susceptible to loss. In the east of Scotland, wind erosion of light fractions from the soil is a particular problem in the spring when ground cover is at its minimum (Grieve Reference Grieve2001). Large amounts of compost at the surface from previous years' applications may be subject to such loss. Secondly, the large compost additions may have saturated the capacity of the soil system to incorporate and stabilize the organic materials by for example burial, sorption to soil mineral colloids and encapsulation within aggregates, leaving a substantial amount of the organic C in the compost vulnerable to microbial degradation and loss as CO2. Thirdly, losses of C in drainage and run-off may also have contributed even though the rates of compost and slurry addition were set within permissible limits for environmentally acceptable water-borne losses. The respiration data, which showed increasing short-term rates with increasing compost addition, and the shift in bacterial community structure are consistent with the second of these possibilities, but they do not exclude contributions to C loss by the other two routes. Carbon dioxide losses following C mineralization have inevitably contributed to C losses from added compost (and slurry), but it is not possible to extrapolate from short-term laboratory measurements of respiration to several seasons under field conditions and apportioning C losses between these different processes is not possible from the present data.
Whether C accumulates in the soil depends on the balance between C inputs and losses. The largest unmeasured C input is that from photosynthesis. Since the barley grain yields responded positively to the additions, the associated increases in root and stubble C inputs will have contributed to the soil C contents relative to the control. However, the balance between C from new photosynthesis and C from compost cannot be estimated from the present data. There is an additional complicating factor when attempting to use mass balance to apportion sources, which is that additions of organic residues will promote the decomposition (C mineralization) of soil C because of the so-called priming effect, which is particularly prevalent when high-energy substrates are added (Bernal et al. Reference Bernal, Sánchez-Monedero, Paredes and Roig1998; Liefeld et al. Reference Liefeld, Siebert and Kögel-Knabner2002; Dungait et al. Reference Dungait, Kemmitt, Michallon, Guo, Wen, Brookes and Evershed2013). Whatever the respective contributions to the additional C in the soil of the amended plots from new photosynthesis and compost and manure, the increment in soil cannot be attributed solely to the organic amendments.
Effects on soil nitrogen
The increase of N in the soil following amendments was small by comparison with that for C (equivalent to between 0·03 and 0·15 of the added N), and there was not a clear relationship between N added as compost or slurry and the additional N in the soil. Nonetheless, for all the compost amendments and the high slurry amendment, there was more N in the soil than in the control. The smaller additional N content is not surprising because the barley will have taken some of the N and it will have been removed in the grain and straw without any biological fixation of atmospheric N. Also, Ball et al. (Reference Ball, Griffiths, Topp, Wheatley, Walker, Rees, Watson, Gordon, Hallett, McKenzie and Nevison2014) detected significant denitrification activity and N2O emissions from these plots, and both leaching and erosional losses (as with C) are also likely to have contributed to the net export of N relative to the control. As with C, it is not possible to apportion the relative contributions of the different N loss or removal processes when accounting for the soil N content at the outset and the known inputs, but it is certain that N export in the harvest and highly probable that gaseous losses, leaching and erosion losses of N have all contributed.
Effects on soil biological properties
There has been extensive discussion about the value of soil biological parameters in assessing soil quality (Pankhurst et al. Reference Pankhurst, Doube and Gupta1997). The approach adopted is to consider the size (biomass), activity (respiration) and bacterial community structure [terminal restriction fragment length polymorphism (T-RFLP)] to provide an assessment of different aspects of the soil biological community. For compost addition, this approach indicated a reduction in biomass and increase in respiration, leading therefore to increases in the biomass-specific respiration rate and a shift in the bacterial community structure. The shift in the bacterial community structure persisted through the growing season so is unlikely to be associated solely with the bacterial community of the compost alone, as the compost would have started to decompose.
Previously the relevance of the greater respiration rate from the higher compost amendments was mentioned in the context of its likely contribution to C loss from the amended soil. Experimental treatments often have similar effects on the size of the soil microbial biomass and the soil microbial respiration rate, but in this case opposite effects were observed. Increasing compost additions led to increasing soil respiration but declining microbial biomass. The declines in biomass with increasing compost addition may be the result of some toxic or inhibitory component in the compost, but if that were the case it is surprising that the barley yield did not also demonstrate a similar response. It is possible that the increasing compost additions have shifted the soil microbial structure in favour of fungi and it is known that a fungal-dominated community tends to exhibit a larger biomass-specific respiration rate (Sakamoto & Oba Reference Sakamoto and Oba1994). This is consistent with the data of Griffiths et al. (Reference Griffiths, Ball, Daniell, Hallett, Neilson, Wheatley, Osler and Bohane2010), who showed increases in fungal fatty acid (ester linked fatty acids) with the compost and slurry amendments relative to the control, and a change in the bacterial community (identified by T-RFLP) for the compost amendment relative to the control. Alternatively, the accuracy of the SIR approach for determining soil microbial biomass needs to be considered. The underlying assumption of this method for microbial biomass determination is that most of the soil microorganisms will respond rapidly by respiring using a source of easily metabolized substrate, such as glucose, because they are substrate-limited (Martens Reference Martens1995). However, in soils that have received large additions of readily-metabolizable substrate, such as compost (which the respiration data show is relatively easily degraded), the method may not be completely reliable and may underestimate soil microbial biomass (Sparling et al. Reference Sparling, Ord and Vaughan1981; Bailey et al. Reference Bailey, Peacock, Smith and Bolton2002). It is not possible to distinguish between the potential toxic or inhibitory effects of the compost in the microbial biomass, shifts in the bacterial community structure and a potential bias of the SIR method against soils that have received organic additions.
CONCLUSIONS
The compost additions at all rates had positive effects on barley yield, soil C and N content (particularly at the soil surface) and soil respiration, but negative effects on soil microbial biomass. At the highest compost addition (c. 200 t/ha/yr), the bacterial community structure was significantly altered, suggesting that the compost affected soil properties that in turn affected the bacterial community, rather than having a short-lived effect due to microorganisms added with the compost. In contrast, the effect of slurry addition was restricted to the highest rate of addition, which was similar to the effects of the compost. The weaker effect of slurry compared with compost is probably due to the fact that the dose rates were much lower, with the highest slurry addition being similar in terms of the quantities of C and N added to the lowest compost addition. The overall conclusion is that sustained organic amendment using compost leads to increases in soil C and N content, but at the largest rate of addition, the additional organic matter accumulates at the soil surface without incorporation into the soil and creates a separate soil layer with chemical, physical and biological properties distinct from the underlying soil.
This work was undertaken as part of the research programme funded by the Scottish Government (RESAS) at the then Scottish Crop Research Institute (now part of the James Hutton Institute). We are grateful to Sandra Caul for technical assistance and for the institute's farm and field teams for consistent support of the trial.