


Introduction
During recent decades several deep ice cores in Antarctica and Greenland have been drilled in order to study palaeo-climate. These ice cores cover different periods of time from a few decades to several hundred ka (e.g. the ice core drilled at Vostok, Antarctica, covers 420 ka (Reference PetitPetit and others, 1999) and the ice core drilled at Dome C, Antarctica (75.1°S, 123.4°E), is expected to encompass even older ice (EPICA Dome C 2001-02 Science and Drilling Teams, 2002)). The temporal resolution of an ice-core record is determined by the yearly accumulation of ice. Since the Antarctic ice sheet is of limited thickness, when planning an ice-coring project a choice needs to be made between a location that provides a maximum time-span and one that provides maximum temporal resolution.
To overcome this limitation the European Project for Ice Coring in Antarctica (EPICA) has drilled two deep ice cores in Antarctica, aiming for an ice core with the oldest possible record and another one with higher resolution for studies on rapid climate oscillations, as observed in ice cores from Greenland (Reference Jouzel, Orombelli and LoriusJouzel and others, 1996). The drill site for the long-term ice core is at Dome C, and the ice core is named EDC. The high-resolution ice core was retrieved at Kohnen station (75° S, 00), central Dronning Maud Land, and is referred to as EDML (Fig. 1). This site was chosen because of its relatively high present-day accumulation rate of 62 kgm--2a- 1 (Reference OerterOerter and others, 2000) and the fact that the precipitation in this region of Antarctica is strongly influenced by the oceanic regime of the Atlantic (Reference Jouzel, Orombelli and LoriusJouzel and others, 1996). In addition to the yearly accumulation, ice flow, ice thickness, bed topography and undisturbed layering of the ice are of great importance for drill site selection. With palaeoclimate information derived from both ice cores, EPICA contributes to an important topic in palaeoclimatology: the coupling of climate between the two hemispheres (EPICA Community Members, 2006; Reference StenniStenni and others, 2011).
Location map of deep ice-core drill sites and connecting airborne RES profile.

Independent dating and synchronization of deep ice cores is important, especially when the regional pattern palaeoclimate distribution is to be deduced from ice cores. At sites where the accumulation is high enough, the upper parts of ice cores can be dated by counting annual layers, revealed by measurements of the electrical or chemical properties of the ice core (Reference SommerSommer and others, 2000), such as electrical conductivity measurements (ECM; Reference HammerHammer, 1980) and dielectric profiling (DEP; Reference MooreMoore, 1988). The lower parts can only be dated using modeling studies (Reference Dansgaard and JohnsenDansgaard and Johnsen, 1969) or by comparison of the ratio of 18O to 16O (Reference JouzelJouzel and others, 1989). Therefore volcanic ash horizons and other unique climate signals are used as markers to determine and link sections of the same age in different ice cores. Due to low accumulation, as well as regional and temporal variations in accumulation, large distances and ice flow between ice-core drill sites, these signals are not always preserved in the same manner.
Therefore, it is necessary to find independent ways to synchronize ice-core records. The internal structure, especially the layering, of ice sheets can be imaged by radio-echo sounding (RES), because impurities (e.g. acids emitted into the atmosphere by volcanic eruptions) deposited with snow on the ice can cause reflections of electromagnetic waves. These properties can also be measured in an ice core using ECM and DEP. Reference Hempel, Thyssen, Gundestrup, Clausen and MillerHempel and others (2000) have shown that internal horizons in RES measurements coincide with peaks revealed by ECM. Furthermore, modelling studies by Reference Eisen, Wilhelms, Nixdorf and MillerEisen and others (2003) have shown that DEP measurements are directly linked to radargrams. Reflectors recorded in the Greenland ice sheet have been used to connect GRIP (Greenland Ice Core Project) and NorthGRIP (Reference Fahnestock, Abdalati, Joughin, Brozena and GogineniFahnestock and others, 2001); and Dome C and Vostok in East Antarctica have been similarly connected (Reference Siegert, Hodgkins and DowdeswellSiegert and others, 1998). In addition, the layering can reveal subglacial processes, because subglacial melting causes a downward dipping of the internal layering. However, layer tracing has to be done with great care, as reflectors may disappear from the radargram and horizons that cannot be traced continuously may be misinterpreted (Reference Dahl-JensenDahl-Jensen and others, 1997). Due to the anisotropy of ice, crystal orientation can also form continuous reflections in RES measurements (Reference Eisen, Hamann, Kipfstuhl, Steinhage and WilhelmsEisen and others, 2007), but these reflectors are only formed in the lower part of ice sheets, because they need a certain stress regime and time to form.
RES Measurements
Part of the pre-site survey for the Dronning Maud Land (DML) deep ice-core drill site was an extensive airborne RES programme carried out by the Alfred Wegener Institute (AWI), supplemented by six flights by the British Antarctic Survey (Reference SteinhageSteinhage, 2001). Prior to the EPICA-related survey RES surveys in central and western DML were restricted to coastal areas. In east DML, from the coast to Dome Fuji, several RES surveys were carried out by Japanese Antarctic research expeditions (Reference WatanabeWatanabe, 1997), investigating not only ice thickness distribution but also the nature and origin of reflections in the ice (Reference FujitaFujita and others, 1999).
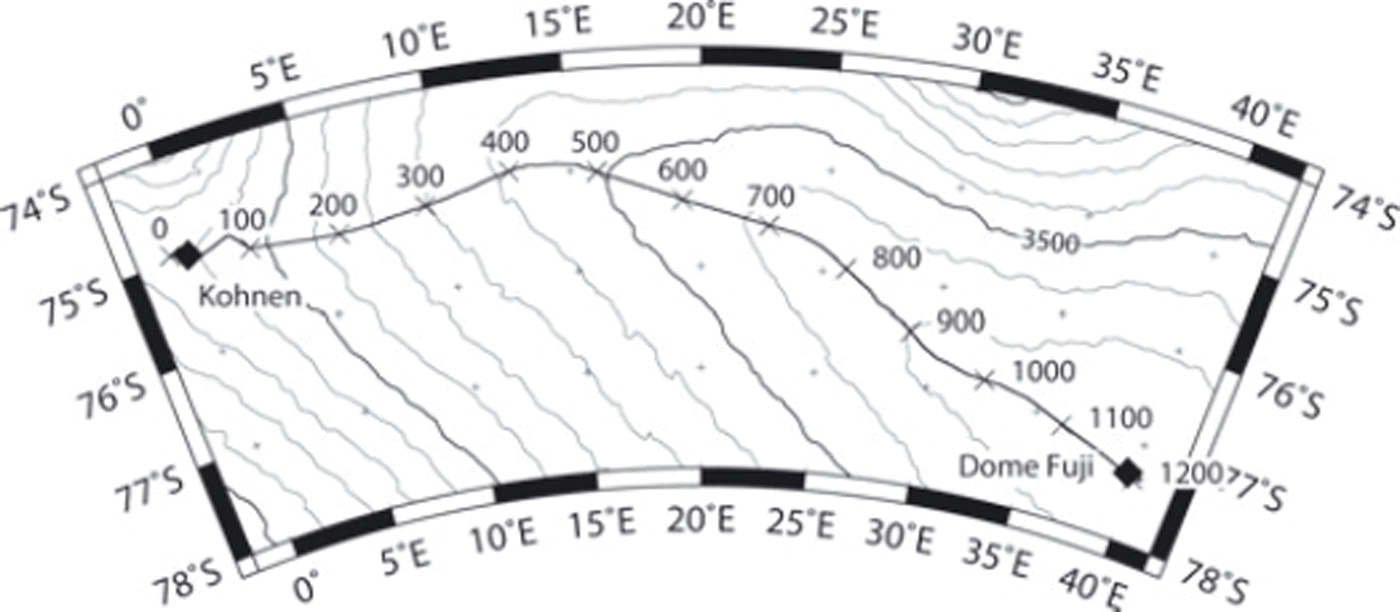
Besides the ice thickness, internal structure has been determined at high resolution on most flights, since the AWI RES system, operating at 150 MHz, is capable of toggling between pulses of 600 and 60 ns duration (Reference NixdorfNixdorf and others, 1999). Since the envelope of the transmitted signals is recorded, the signal is reduced to 17 MHz and 1.7 MHz, respectively. Hence two RES sections can be obtained along a single flight line. Using the long, 600 ns, pulse a maximum penetration depth of ∼4000m is achieved; the short pulse leads to a high vertical resolution of ∼5-10 m. In the austral summer of 2002/03, the dataset recorded during the pre-site survey was augmented by a section extending an existing profile along the ice divide from Kohnen station southeast to Dome Fuji station. Figure 2 shows the exact position of the combined profile, as well as the location of the two deep ice-core drill sites.
Location of RES profile from Kohnen station to Dome Fuji. The numbers along the profile indicate the length in kilometres, thin black curves show surface elevation. The ice flow speed along the ice divide is ∼2ma-1 (Reference Rignot, Mouginot and ScheuchlRignot and others, 2011).
A 5 km long sample section, recorded with the high-resolution, 60 ns, pulse near the two deep ice-core drill sites, together with eight prominent internal horizons, is plotted in Figure 3a and b. Eight internal horizons are continuously traceable in the high-resolution sections along the whole 1217 km long profile.
(a) Section of high resolution (60 ns pulse) around Kohnen station and traced internal horizons. (b) Section of high resolution (60 ns pulse) around Dome Fuji and traced internal horizons.
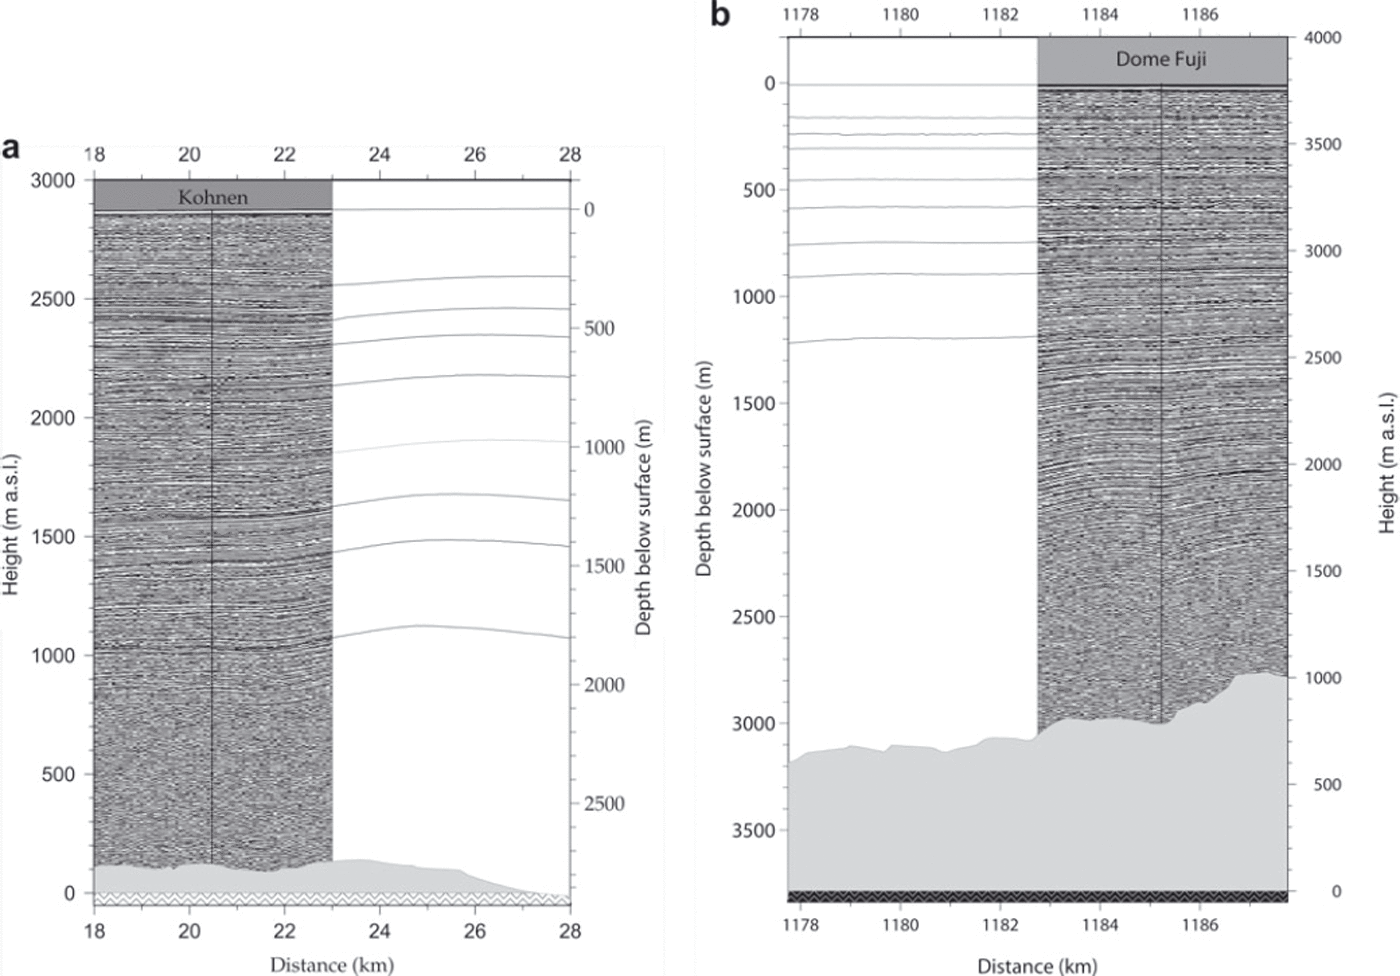
The subglacial topography shown in Figures 3a and b and 4 has been obtained from the sections recorded with a 600 ns pulse along the flight line. The offset between neighbouring traces after stacking in both profiles is 80 m, the vertical resolution for the sections recorded while transmitting the 60 ns pulse is 5-10 m, and for the 600 ns pulse it is 50 m.
Visible Layers
Visible layers in ice cores are of special interest when interpreting the cores. Large volcanic eruptions can produce visible layers in ice (Reference Hammer, Clausen and LangwayHammer and others, 1997; Reference FujiiFujii and others, 1999), covering large regions and thus forming absolute time markers. Five visible layers, listed in Table 1, most likely ash layers, have been found in the upper 1500 m of the EDML ice core, and 25 visible layers have been observed in the 2500 m deep Dome Fuji ice core (Reference FujiiFujii and others, 1999). Only the uppermost two or three tephra layers of the Dome Fuji core are of interest for this study, because the others are much older than ∼50 ka, the age predicted for the EDML core at 1560 m depth.
Visible layers in the upper 1500 m of the EDML deep ice core
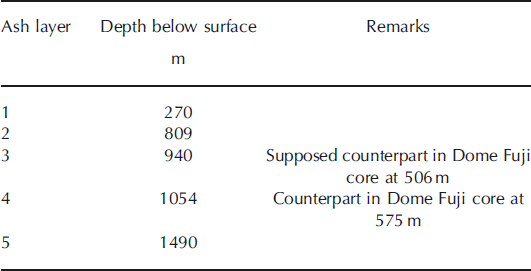
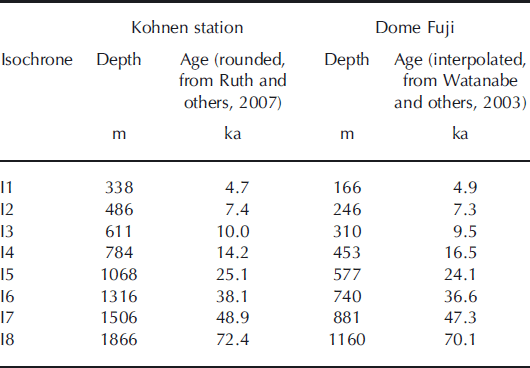
It seems that RES horizon I5 at 1068 m depth at Kohnen station connects the visible layer seen at 1054 m depth in the EDML core with the ash layer at 575 m depth in the Dome Fuji ice core. The difference in depth between the RES horizon and the visible layer is 14 m at Kohnen station and 2 m at Dome Fuji. This is within the error range of ∼10-15 m in which RES horizons can be determined. We therefore assume that the visible layers at 1054 m depth in the EDML ice core and at 575 m in the Dome Fuji ice core represent the same volcanic event. Unfortunately, there is no RES horizon close to the first tephra layer documented in the Dome Fuji ice core. However, it is found in the middle of the two internal layers I4 and I5, so we believe that the first ash layer of the Dome Fuji ice core at 506 m depth corresponds to the visible layer observed at 940 m depth in the EDML ice core. The depths of the traced internal layers are listed in Table 2.
Depths and ages of isochrone horizons at Kohnen station and Dome Fuji
Results
It has been possible to compose an airborne RES profile along the ice divide from Kohnen station to Dome Fuji and to continuously trace eight prominent internal horizons. Figure 4 shows the eight horizons, together with the surface and bed topography. Assuming that the RES horizons reflect isochrones, the existing Dome Fuji chronology can be transferred to Kohnen station, and a preliminary dating of the EDML ice core has been made. The picked internal layers are isochrones because they are stable with respect to changes in local accumulation along the profile. Calculations of the relative layer thickness between the chosen isochrones, not presented here, reveal a similar trend for the isochrones formed in the last glacial and since the beginning of the current interglacial.
Internal layers between drill sites.
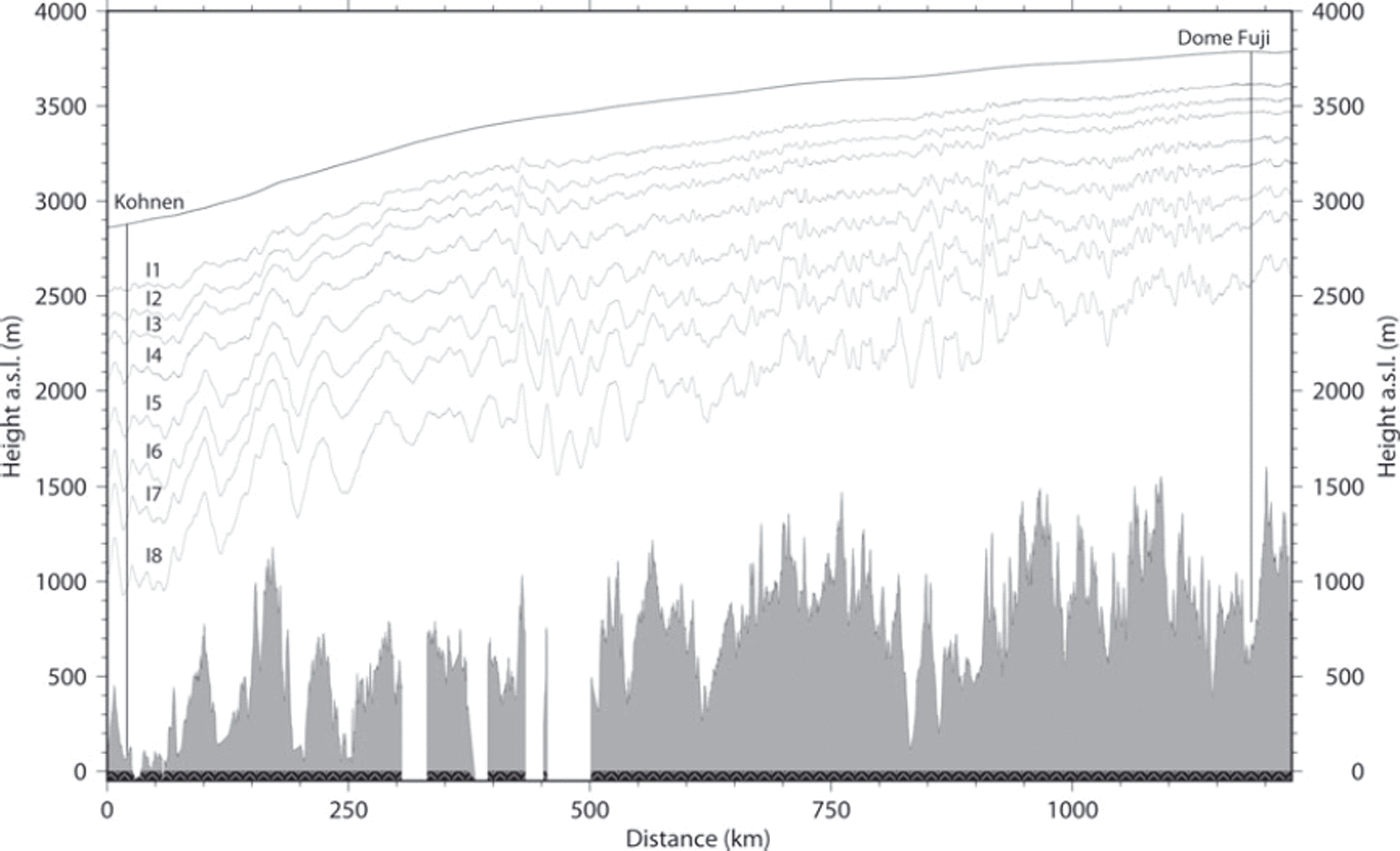
With the help of the traced isochrones, two visible ash layers found in the EDML ice core can be traced to counterparts in the Dome Fuji ice core. Whereas the deeper particle layer (1054 m at Kohnen station, 575 m at Dome Fuji) is just above isochrone I5, the upper (940 m at Kohnen station and 506m at Dome Fuji) layer is assumed to be a proportional distance between the two surrounding iso-chrones, I4 and I5.
Assuming constant strain rates in the upper part of the ice sheet, the simple Nye timescale (Reference HaefeliHaefeli, 1963; Reference NyeNye, 1963) can be used to derive the accumulation along the profile based on the dated isochrone I1 and the ice thickness along the RES profile between Kohnen station and Dome Fuji. The result of this inversion is shown in Figure 5. The accumulation rates derived with this approach for Kohnen station (74 kg mr-2 a–1) and Dome Fuji (33 kgmr-2 a–1) are slightly higher than those derived at the drill sites, of 62 kg mr-2 a–1 (Reference OerterOerter and others, 2000) and 27 kg mr-2 a- 1 (Reference Watanabe, Jouzel, Johnsen, Parrenin, Shoji and YoshidaWatanabe and others, 2003), respectively.
Accumulation rates deduced from upper isochrone using the Nye model (Reference HaefeliHaefeli, 1963; Reference NyeNye, 1963) along the ice divide between Kohnen station and Dome Fuji, and comparison with the accumulation rate dataset compiled by Reference Huybrechts, Steinhage, Wilhelms and BamberHuybrechts and others (2000) (solid grey line), RACMO accumulation data (dotted grey line) of Reference Van de Berg, Van den Broeke, Reijmer and Van MeijgaardVan de Berg and others (2006) and the dataset compiled by Reference Arthern, Winebrenner and VaughanArthern and others (2006) (dashed grey line). The last two datasets were extracted from the compilation by Reference Le Brocq, Payne and VieliLe Brocq and others (2010).
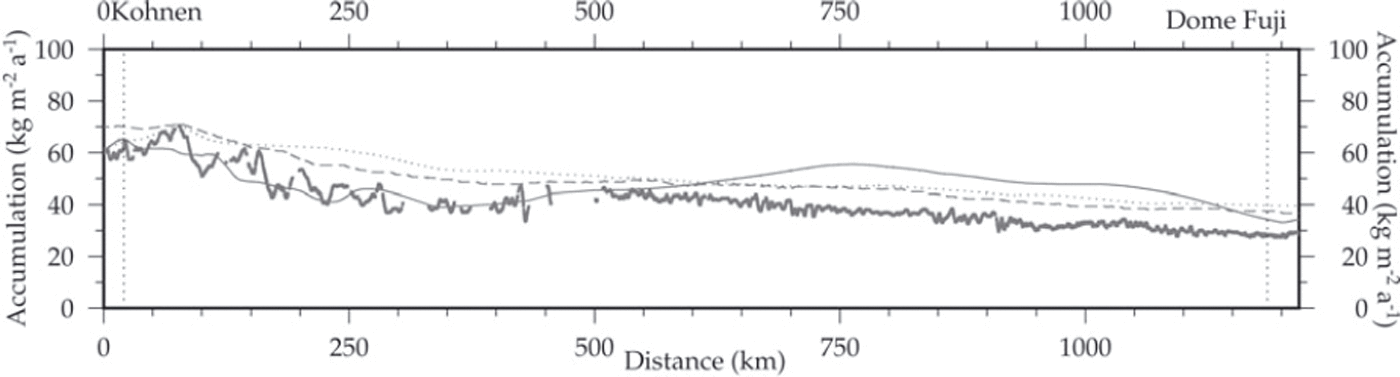
To put the results of this study into perspective, the results presented here are compared with datasets derived from modelling studies, remote-sensing techniques and a compilation also based on the sparse measurements of the EPICA pre-site survey (Reference Huybrechts, Steinhage, Wilhelms and BamberHuybrechts and others, 2000). The dataset of Reference Huybrechts, Steinhage, Wilhelms and BamberHuybrechts and others (2000) shows the best agreement with the model results, at least for the first 550 km of the profile. This is the region in which Reference Huybrechts, Steinhage, Wilhelms and BamberHuybrechts and others (2000) could incorporate measurements of the EPICA pre-site surveys in their dataset, which was compiled on a 20 km x 2 0 km grid. The datasets compiled by Reference Arthern, Winebrenner and VaughanArthern and others (2006), based on satellite and ground-based observations, and by Reference Van de Berg, Van den Broeke, Reijmer and Van MeijgaardVan de Berg and others (2006) derived from the RACMO2/ANT regional atmospheric climate model overestimate the accumulation rates by ∼-10kgm-2 a-1.
Conclusions
We succeeded in tracing eight internal RES horizons along a 1217km profile along the ice divide from Dome Fuji to Kohnen station. Moreover, we have been able to identify corresponding visible layers documented in the EDML and Dome Fuji ice cores using these horizons. Thus the age/depth scale of the Dome Fuji deep ice core (Reference Watanabe, Jouzel, Johnsen, Parrenin, Shoji and YoshidaWatanabe and others, 2003) could be transferred to the EDML ice core drilled at Kohnen station. Finally, an age of 49 ka has been derived for the 1560 m deep EDML ice core retrieved in the 2002/03 field season. We have thus demonstrated the potential of RES horizons to synchronize climate records derived from ice cores drilled at sites >1000 km apart.
Acknowledgements
We thank everyone who supported the measurements at the ski-ways of Kohnen station and Neumayer, especially for their help bringing fuel and supplies in and out. The teams of Polar2 and Polar4 and the engineers of Aerodata and Optimare are thanked for mastering all the problems that developed during operations. We also thank the anonymous reviewers for constructive reviews that helped us to improve the manuscript. This work is a contribution to the European Project for Ice Coring in Antarctica (EPICA), a joint ESF (European Science Foundation)/EC (European Commission) scientific programme, funded by the EC under contract ENV4-CT95-0074 and by national contributions from Belgium, Denmark, France, Germany, Italy, the Netherlands, Norway, Sweden, Switzerland and the United Kingdom.



