


Psychological assessment has long been the hallmark of the work of the psychologist (Dattilio, Tresco, & Siegel, Reference Dattilio, Tresco and Siegel2007). It serves a variety of purposes but is primarily carried out to describe current functioning, identify therapeutic need, aid in the diagnosis of a disorder, evaluate the success of interventions, and manage risk (Meyer et al., Reference Meyer, Finn, Eyde, Kay, Moreland, Dies and Reed2001).
Since the late 1950s, psychological assessment has occurred within the education system (Baker, Reference Baker1964), as school psychologists have become involved in administering psychoeducational assessments. Psychoeducational assessment is a comprehensive individual assessment that involves gathering developmental, family, school, social, emotional, temperament and health histories, and administering tests. At least two types of tests are used: psychological and educational tests (Lichtenberger, Mather, Kaufman, & Kaufman, Reference Lichtenberger, Mather, Kaufman and Kaufman2004). Psychological tests measure cognitive abilities such as attention, language skills, memory, auditory and visual processing, verbal reasoning and spatial skills. Educational assessments measure academic skills such as reading, spelling, mathematics and written expression. This form of measurement can be useful for classroom decision-making, implementation and evaluation of individual services, as well as addressing a student's academic, cognitive, behavioural and social-emotional functioning (Miller & Watkins, Reference Miller and Watkins2010).
A key aspect of psychological assessment is to provide skilled, empathic feedback of assessment findings (Meyer et al., Reference Meyer, Finn, Eyde, Kay, Moreland, Dies and Reed2001). Nevertheless, Cates (Reference Cates1999) describes how ‘the task of interpreting data in a reliable and valid manner and assembling the data and their interpretation into a useable format for the client remains an art’ (p. 631).
Psychological Assessment Reports
Psychological reports are the end product of the psychological assessment process (Groth-Marnat & Horvath, Reference Groth-Marnat and Horvath2006). Typical psychological reports contain the elements of identifying information, the referral question, the procedures and measures used, and test scores (Salvagno & Teglasi, Reference Salvagno and Teglasi1987; Wiener, Reference Wiener1985). The report also includes an interpretation of the findings as well as the psychologist's conclusions and diagnostic impressions (Rucker, Reference Rucker1967; Wiener, Reference Wiener1985). The report generally ends with recommendations that translate the evaluation findings into strategies and interventions to support the client (Teglasi, Reference Teglasi1983).
In writing a psychological report, Cates (Reference Cates1999) reminds us that there are two particularly pertinent factors to bear in mind. First, assessment information can have a massive impact on the lives of clients; thus, clinicians need to remember the significance of this when integrating assessment information in a report. Second, assessment does not comprise solely the accumulation of data but rather the integration and interpretation of data, in order to provide useful and meaningful descriptions for the benefit of the client. In order to improve client functioning, reports must be responsive, persuasive and communicative, while being simultaneously embedded within the consultation process (Harvey, Reference Harvey2006).
Criticisms of Psychological Assessment Reports
Not all psychological assessment reports, however, adhere to the above points.
Limitations of psychological reports have been well documented for a number of years (Mussman, Reference Mussman1964; Ownby, Reference Ownby1997; Rucker, Reference Rucker1967). Consistent findings indicate that major issues are the use of jargon, readability, and the style in which the report is organised.
Technical terminology (jargon)
The literature indicates that professional terminology is a barrier to the usefulness, understanding, and interpretation of information in a psychoeducational report (Cheramie, Goodman, Santos, & Webb, Reference Cheramie, Goodman, Santos and Webb2007; Tallent & Reiss, Reference Tallent and Reiss1959), and hinders readers’ comprehension (Brandt & Giebink, Reference Brandt and Giebnik1968). In Ownby's article (Reference Ownby1990), consumers of reports indicated that reports: do not contain enough basic data, contain technical terms (jargon), and they are unclear or imprecise. Pelco et al. (Reference Pelco, Ward, Coleman and Young2009) reported that the use of technical terminology in psychoeducational reports unequivocally hinders readers’ understanding of the report. Rafoth and Richmond (Reference Rafoth and Richmond1983) investigated 25 terms commonly used in reports and which of those terms regular and special education teachers understood. They found that teachers understand about half of the terms commonly used in psychoeducational reports. Teglasi cites the specific example of naming particular subtests, without explaining the meaning of the subtests, as a factor leading to a lack of clarity for the reader.
Readability
Harvey (Reference Harvey1997) indicated that the primary purpose of psychological reports is effective communication. As psychological reports are read by a wide variety of audiences beyond other mental health professionals, it is imperative that they are written at a level that can be understood (Groth-Marnat & Horvath, Reference Groth-Marnat and Horvath2006). Naturally then, writing at too high a level undermines this process (Pelco, Ward, Coleman, & Young, Reference Pelco, Ward, Coleman and Young2009; Weddig, Reference Weddig1984). Readability refers to the level of reading difficulty of the report, and as such, which level of reading is necessary to read it with ease and understanding (Richens, Reference Richens1999). Factors that affect readability include long sentences, complex vocabulary, use of acronyms, and passive verbs. Weddig (Reference Weddig1984) found that psychoeducational reports are written at a mean reading level of 14.46; that is, the reader needs at least 14 years of education to understand the report. Harvey's (Reference Harvey2006) more recent review of readability indicates that the average reading grade level for current psychoeducational reports is 18.5, and that reports are consistently written at a level that is misunderstood by non-psychologists.
Organisation of report
In general, psychoeducational assessment reports present findings in a test-by-test fashion. These reports have results organised sequentially according to test instruments and rely heavily on scores from intellectual, behavioural and educational assessments (Groth-Marnat & Horvath, Reference Groth-Marnat and Horvath2006). These types of reports are generally low on integration, neglect contradictions between various scores, and ignore the overall context of the client (Groth-Marnat & Horvath, Reference Groth-Marnat and Horvath2006; Teglasi, Reference Teglasi1983). In contrast to the traditional report style, integrated reports do not present assessment results in a test-by-test fashion; rather, findings from different assessment tools are combined into theme-based conclusions under headings such as ‘general cognitive ability’ or ‘literacy skills’ (Pelco et al., Reference Pelco, Ward, Coleman and Young2009). Research such as that by Pelco and Ward (Reference Pelco and Ward2007) supports the use of an integrated, thematic presentation of test data in psychoeducational reports.
Effective Psychoeducational Reports: The Reader's Perspective
A review of the literature has found there is limited research relating to psychoeducational reports (Pelco et al., Reference Pelco, Ward, Coleman and Young2009; Richens, Reference Richens1999), with most studies decades old (Salvagno & Teglasi, Reference Salvagno and Teglasi1987; Wiener, Reference Wiener1985). In these limited studies, findings have consistently identified teachers’ dissatisfaction with psychoeducational assessment reports (Ownby & Wallbrown, Reference Ownby and Wallbrown1983; Richens, Reference Richens1999; Rucker, Reference Rucker1967). They also indicate there is no agreed-upon system for effective psychoeducational report writing (Lichtenberger et al., Reference Lichtenberger, Mather, Kaufman and Kaufman2004). However, researchers have identified a number of factors that should be addressed to make psychological reports more relevant to consumers and increase readability of reports: reduce jargon, individualise content, focus on referral questions, shorten sentences, emphasise client strengths, make concrete recommendations, and use subheadings (Brenner, Reference Brenner2003; Groth-Marnat & Horvath, Reference Groth-Marnat and Horvath2006; Harvey, Reference Harvey2006; Lichtenberger et al., Reference Lichtenberger, Mather, Kaufman and Kaufman2004).
It is also recommended that the intended consumer of the report be considered by the author during writing, and reports be written at a level commensurate with the readers’ ability to understand (Brenner, Reference Brenner2003; Groth-Marnat & Horvath, Reference Groth-Marnat and Horvath2006). Researchers using different psychological report formats and styles have provided us with valuable information pertaining to teachers’ perceptions and preferences for report presentation. These studies have investigated the format, content, readability and effects of report characteristics, as well as teachers’ perceptions and use of such reports. In addition, such studies have attempted to make reports more understandable and consumer friendly, and to identify which sections of the reports are most useful for teachers (Harvey, Reference Harvey1997, Reference Harvey2006; Pelco et al., Reference Pelco, Ward, Coleman and Young2009).
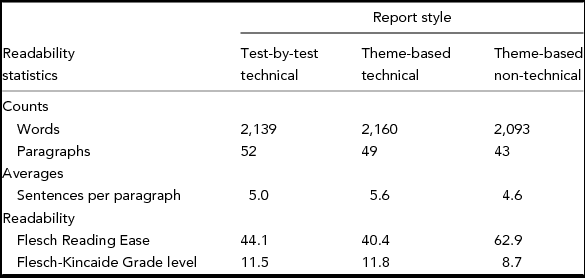
When Pelco et al. (Reference Pelco, Ward, Coleman and Young2009) reviewed the literature on psychoeducational assessment report writing in an educational setting, they noted that reports tended to vary along two dimensions: readability (technical through to non-technical) and integration style (theme-based vs. test-by-test). Pelco et al. (Reference Pelco, Ward, Coleman and Young2009) modified a common assessment scenario using psychoeducational tests in common usage, and attempted to create four alternate report styles that differed only on the organisation of information (theme-based vs. test-by-test) and the readability (amount of technical jargon). Using the Flesch Reading Ease Formula (Flesch, Reference Flesch1946), they calculated the readability of the four versions, and found that they were unable to produce a test-by-test, non-technical report. The language required in a test-by-test report raised the readability index too high to meet their criteria for a non-technical report. As a result, they developed three alternate psychoeducational reports that used possible combinations of integration style and readability.
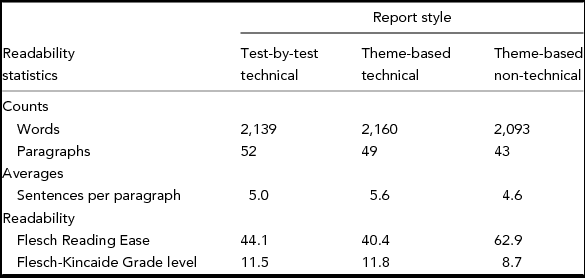
The three psychoeducational report styles were referred to as: (a) test-by-test technical (traditional test-by-test format with technical terms), (b) theme-based technical (identical to test-by-test technical except for the assessment results section reorganised into integrated themes), (c) theme-based non-technical (theme-based technical modified by intentionally reducing reading level and technical terms). Readability statistics can be found in Table 1.
Readability Statistics for Three Alternate Report Styles*
Note: *Adapted from Pelco, Ward, Coleman, and Young (2009).
All three alternate report styles contained the same content information, were shortened to four single-spaced pages, and contained identical section headings. Recommendations were deliberately excluded from the report styles. Pelco et al. (Reference Pelco, Ward, Coleman and Young2009) used the three report styles in a study conducted with highly educated, experienced, primary school teachers in which they asked the teachers to rate the reports on various criteria. Results from this study indicated that overall, teachers believed all three report styles were of high quality. Teachers preferred reports with a lower reading grade level and rated them as being the most teacher friendly. They also preferred reports in which the results were organised in themes rather than in a test-by-test format. Pelco and colleagues (Reference Pelco, Ward, Coleman and Young2009) suggested that future research should investigate differences in experienced and novice teachers’ ratings of report styles.
Effective Psychological Reports: The Writer's Perspective
While a literature review provided evidence of advice to psychologists when writing reports (e.g., Harvey, Reference Harvey1997, Reference Harvey2006; Groth-Marnat & Horvath, Reference Groth-Marnat and Horvath2006), we could find no evidence of research that attempted to determine how psychologists responded to the report writing of their peers or assessed the effectiveness and utility of reports they read as communications to parents, teachers and other professionals, including themselves. This would appear to be a major gap in our knowledge, as psychologists, the writers of reports, need to be aware of any differences between their own perceptions of reports and the perceptions of consumers of reports in order to communicate effectively.
Current Study
The present study aimed to build on the investigations of Pelco et al. (Reference Pelco, Ward, Coleman and Young2009) in several ways. Using the three report types developed by Pelco et al. (Reference Pelco, Ward, Coleman and Young2009), we aimed to determine if teachers and psychologists view the same factors to be important in determining satisfaction with, and understanding and utility of, a psychoeducational report.
As Pelco and colleagues (Reference Pelco, Ward, Coleman and Young2009) found that experience significantly influenced teacher ratings of report styles, an experience factor was built into the study. Teachers were divided into three levels of experience: (a) new (1–5 years’ teaching), (b) experienced (more than 5 years’ teaching), (c) special education teachers. Special education teachers were included in the present study as they, along with regular teachers, are considered a critically important readership group and are primarily responsible for implementing report recommendations in all aspects of curriculum planning and learning support.
As with teachers, the level of experience of the psychologists was examined. We included psychologists in training (postgraduates), new school psychologists (1–5 years’ work experience) and experienced school psychologists (more than 5 years’ work experience).
Given the limited research in this area and the exploratory nature of this study, the study sought to determine the following: (1) Does report style (specifically, test-by-test, theme-based technical, and theme-based non-technical) have an effect on the ratings of satisfaction with, and understanding and utility of, psychoeducational reports by teachers and psychologists? (2) Does experience have an effect on teachers and psychologists’ ratings of satisfaction with, and understanding and utility of, psychoeducational reports? (3) Is there an interaction effect between amount of experience and report style on ratings of satisfaction with, and understanding and utility of, psychoeducational reports by both teachers and psychologists?
Method
Participants: Teachers
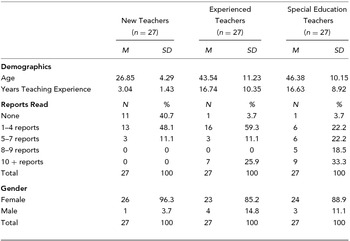
Eighty-one primary school teachers were recruited from metropolitan schools around the Perth region following approval from the Department of Education. Participants ranged in experience from relatively new graduates in their first few years of teaching, to teachers with more than 30 years of experience. Demographic descriptives can be found in Table 2. The participants were broken down into subgroups of teachers: new teachers (1–5 years’ teaching experience), experienced teachers (more than 5 years’ experience) and special education teachers. Teachers from both government and non-government primary schools were included in the study. Teachers were not recruited from secondary schools as the psychoeducational reports that form the basis of the study concern a student who is 7 years old. Special education teachers were recruited from primary school education support units (ESU), or education support centres (ESC).
Demographic Information Regarding Teachers

Participants: Psychologists
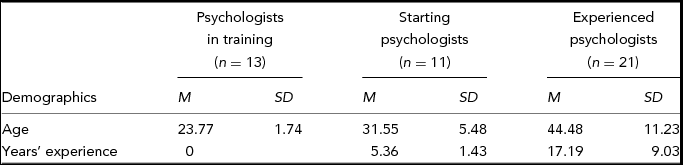
Thirteen psychologists in training were recruited from the university in Perth that runs a specific program for training school psychologists. Thirty-two school psychologists were recruited from government and non-government school psychology services. All participants self-selected themselves for participation after reading an information sheet provided by the third author (to trainee psychologists) or by Student Service Managers (to practising psychologists). Demographic information is provided in Table 3.
Demographic Information Regarding Psychologists

Materials
Psychoeducational Reports
The three psychoeducational report styles developed by Pelco et al. (Reference Pelco, Ward, Coleman and Young2009) were used in this study, with the permission of the authors. As previously described, the reports were adapted versions of the one report and contained the same content information, were shortened to four single-spaced pages, and contained identical section headings. The reports developed by Pelco et al. were co-written in 2004 by a school psychology graduate student and a practising school psychologist.
Questionnaire
A questionnaire was developed by the authors to assess perceptions of psychoeducational reports. Participants were asked to complete a short questionnaire that consisted of basic demographic questions relating to age, gender, occupation, experience and education level, followed by the survey questions and two open-ended questions. Teachers were also asked the approximate number of psychological reports they had read in the past 2 years.
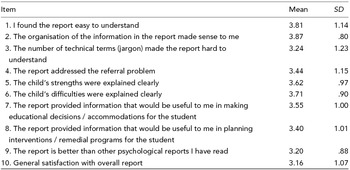
To assess participants’ level of satisfaction with and perceived usefulness and understandability of the particular report they had read, they were asked to rate their agreement or disagreement to 10 statements using a 5-point Likert-scale, with 1 representing strongly disagree and 5 representing strongly agree (see Table 4). These statements were modelled on those reported in the Pelco et al. (Reference Pelco, Ward, Coleman and Young2009) article, and are similar to those used in previous studies on psychoeducational reports (Pryzwansky & Hanania, Reference Pryzwansky and Hanania1986; Wiener, Reference Wiener1987).
Descriptive Analyses of Questionnaire Items

The questionnaire ended with two open-ended questions: one asking the reader to provide their best explanation of the reasons for the student's learning difficulties, the second asking the psychologists to make recommendations for the student in the report and asking teachers to indicate classroom accommodations for the student. Finally, participants were given the opportunity to add any comments they might wish to make. This qualitative data is not addressed in the current article.
Procedure
Following receipt of participants’ consent forms, one of the three reports (test-by-test technical, theme-based technical, theme-based non-technical) was randomly assigned to each participant within each of the psychologist and teacher groups. Each participant was sent a ‘questionnaire pack’ that contained: a copy of one of the three psychoeducational reports, the questionnaire and covering letter, and a prepaid reply envelope. Each questionnaire and prepaid reply envelope was coded with a number and letter (representing the participant number and randomised report style), to provide efficient allocation and to assist with data entry. The covering letter detailed the purpose of the study, the participant's contribution to the research, and information about the report. Participants were specifically told that the report did not contain a recommendations section as participants were asked to generate their own classroom accommodations/recommendations. Participants were instructed to complete the questionnaire after reading the psychoeducational assessment report and return the questionnaire to the research team in the prepaid reply envelope supplied.
Results
Overview
Data were coded and analysed using PASW Statistics 19. Data screening was conducted prior to analysis to ensure accuracy of data entry and to check for missing or ambiguous values. No data were deleted.
The questionnaire item ‘The number of technical terms (jargon) made the report hard to understand’ had to be reverse-scored. Table 4 provides a descriptive analysis of each questionnaire item (minus demographic items).
Principal Components Analysis
To develop a reduced set of component scores for the questionnaire items assessing participants’ perceptions of three psychoeducational report styles, data collected for eight items were subjected to principal components analysis (PCA) with orthogonal (varimax) rotation. Demographic items and two items examining overall satisfaction (items 9 and 10) were excluded from the factor analysis. Prior to running the principal components analysis, examination of the data indicated that variables were not perfectly normally distributed. Given the robust nature of factor analysis, these deviations were not considered problematic (Field, Reference Field2009; Tabachnick & Fidell, Reference Tabachnick and Fidell2007). Furthermore, a linear relationship was identified among the variables, and the diagonals of the anti-image correlation matrix were all over .5, supporting the inclusion of each item in the factor analysis. The Kaiser-Meyer-Olkin measure verified the sampling adequacy for the analysis, KMO = .732, which is well above the acceptable limit of .5 (Field, Reference Field2009).
A highly significant Bartlett's Test of Sphericity, χ2(28) = 233.08, p = .000, indicated that correlations between items were sufficiently large for PCA and supported the factorability of the items. An initial analysis was run to obtain eigenvalues for each component in the data. The PCA revealed two eigenvalues exceeding 1, explaining 52.91% of the variance. A further component had an eigenvalue just under 1 (.99) and explained 12.43 % of the variance. However, inspection of Cattell's scree plot revealed a point of inflexion on the curve, at the third data point (factor); indicating that two factors should be extracted (Field, Reference Field2009). Solutions for the two- and three-factor solutions were examined to determine the most suitable factor structure. A varimax rotation with two factors was identified as more appropriate for the final solution due to the ease of interpretability and number of primary loadings when compared to the three factor solution.
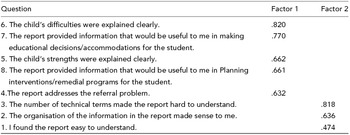
No items were eliminated from the database as items were retained if they had a loading on a single factor of .45 or above (as suggested by Tabachnick & Fidell, Reference Tabachnick and Fidell2007). In addition, they did not cross-load on any other factor. The first factor was labelled Utility of Report (usefulness and interpretability) and had high loadings from variables such as ‘the report provided information that would be useful to me in planning intervention/remedial programs for the student’ and ‘the child's difficulties were explained clearly’. This factor accounted for 33.47% of variance. The second factor was labelled Understandability of Report (extent to which teachers understand the purpose of the assessment procedure, the concepts used, and organisation). This factor had high loadings from variables such as ‘I found the report easy to understand’ and ‘the organisation of information in the report made sense to me’ and accounted for 19.43% of the variance. In total, these factors accounted for around 52.91% of the variance in the questionnaire data. The rotated factor-loading matrix for the two-factor solution is presented in Table 5.
Varimax Rotated Factor Structure of Nine Items of the Report Questionnaire

Analyses of Variance
A factorial between groups analysis of variance (ANOVA) was used to investigate the effects of report style (test-by-test, theme-based technical, and theme-based non-technical) and respondent type (teacher or psychologist) on respondents’ ratings of satisfaction, utility (usefulness) and understanding of three alternate psychoeducational reports. Data were assessed for normality and homogeneity of variance, preceding the main analyses. Examination of stem and leaf plots for the two factor-based variables and for the two measures of satisfaction indicated reasonable approximation to normal distribution. As the F test is robust to deviations in normality (Field, Reference Field2009), the deviations were considered acceptable. More important for the robustness of the F test is the homogeneity of variance. Variance ratios using Hartley's F MAX indicated acceptable homogeneity of variance across groups for all dependent measures.
Utility of report style
An ANOVA was used to investigate the effects of report style and respondent type on the perceived utility of the report, that is, Factor 1. There was a significant main effect for respondent type on perceived utility of the reports, F(2, 120) = 19.23, p < .001, partial η2 = .138, with teachers considering the reports more useful than psychologists. There was, however, no statistically significant main effect of report style, F(1, 120) = .684, p = .507, partial η2 = .011. There was also no significant interaction between respondent group and report style relating to perceived utility of the report, F(2, 120) = .072, p = .930, partial η2 = .001.
Understandability of report
An ANOVA was used to investigate the effects of report style and respondent type on perceived understandability of report using the composite scores obtained on Factor 2. The ANOVA revealed a statistically significant main for report style on understandability F(2, 120) = 6.77, p < .01, partial η2 = .101. Bonferroni post hoc tests indicated that the theme-based non-technical report was rated as being significantly more understandable than both the theme-based technical and test-by-test reports (both ps < .01).
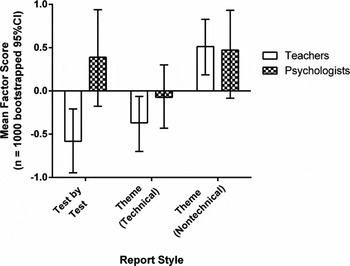
There was also a significant main effect for respondent group F(1, 120) = 5.821, p < .02, partial η2 = .046 on ratings of perceived understandability of the report, with psychologists finding the reports easier to understand than teachers. In addition, a significant interaction effect was found, F(2, 120) = .3.090, p < .05, partial η2 = .049, as can be seen in Figure 1.
Understanding ratings of report styles by profession.

Respondents’ satisfaction with psychoeducational reports
Two Likert-scaled questions were not included in the factor analysis as they were global measures of satisfaction. Separate factorial between-groups ANOVAs were used to investigate the effects of report style and respondent group on global satisfaction with psychoeducational reports. Overall, results showed that respondents believed all three reports were of high quality. The mean rating across all three report styles for the questionnaire item ‘General satisfaction with overall report’ was 3.16 (SD = 1.07) on a 5-point Likert scale (1 = extremely dissatisfied to 5 = extremely satisfied). The ANOVA revealed no significant main effect for report style, F(2, 120) = .221, p = .802, partial η2 = .004. There was, however, a significant main effect for respondent group, F(2, 120) = 44.484 p < .01, partial η2 = .004, with teachers rating the reports much more highly (M = 3.37) than psychologists (M = 2.42). No significant interaction effect was found, F(2,120) = .853, p = .429, partial η2 = .014.
The question ‘This report is better than other psychological reports I have read’ was also considered to give an indication of respondents’ general satisfaction. The mean score for this was 3.20 (SD = .877) on a 5-point Likert scale (1 = strongly disagree to 5 = strongly agree). The ANOVA revealed no significant main effect for report style, F(2, 120) = 1.125, p = .328, partial η2 = .018, or respondent group, F(1,120) = .000, p = .988 partial η2 = .0. Furthermore, no significant interaction effect was found, F(2, 120) = 1.375, p = .257, partial η2 = .022. This indicates that both psychologists and teachers had similar ratings across this item.
Effects of Respondent Experience
There were insufficient respondents in the psychologist group to examine the impact of experience on ratings of the three report styles. There were, however, sufficient teachers to examine the impact of experience on their ratings of satisfaction, utility and understandability of the three report styles. This was examined in four separate 3 (levels of experience) × 3 (report style) ANOVAs.
There were no significant main effects or interactions for the two questions considered to measure satisfaction with the report.
There was a significant main effect of report style on understandability, F(4, 72) = 11.32, p < .01, partial η2 = .239, as might be expected from the analysis involving all respondents. There was, however, no significant main effect of level of experience on ratings of understandability or any interaction effects.
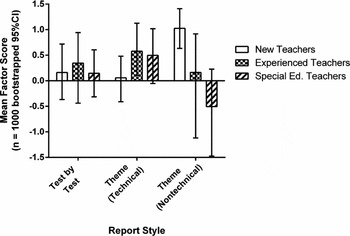
Of greater interest was the analysis examining the effect of level of respondents’ experience on their rating of utility of the three different report styles. Here, while there were no significant main effects, there was a significant interaction, F(4, 72) = 2.71, p < .05, partial η2 = .031 (see Figure 2).
Utility ratings of report styles by teacher type.

Discussion
The current study was an extension of the research by Pelco et al. (Reference Pelco, Ward, Coleman and Young2009), which aimed to determine, from the perspective of teachers, the factors that make an effective psychoeducational report. The primary aim of the present study was to determine whether teachers and psychologists considered the same factors to be of importance in psycho-educational reports. Specifically, we sought to determine whether style of report (test-by-test, theme-based technical or theme-based non-technical) would influence teachers and psychologists’ ratings of satisfaction, utility and understanding of psychoeducational reports.
Teacher and Psychologist Ratings of Satisfaction
There were two statements in the questionnaire rated by respondents that were considered to measure satisfaction: ‘The report is better than other psychological reports I have read’ and ‘General level of satisfaction’. Interestingly, these two questions appeared to be measuring somewhat different constructs as there were significant differences between the respondent groups for the second question, but not the first. Both teachers and psychologists rated the reports as ‘better than other psychological reports I have read’; however, while teachers rated their ‘general satisfaction’ as 3.6 on a 5-point scale, psychologists’ mean rating was just below the midway point (2.42 on a 5-point scale). This would seem to suggest that psychologists are not generally impressed by reports they have read that have been written by their colleagues, as they considered the study reports they rated as only marginally satisfactory were better than other reports they had read. Alternatively, it is possible that the lack of summary and recommendations reduced their satisfaction with the reports used in the study.
Nevertheless, when one considers both respondent groups and both questions, averaged over report styles, the overall satisfaction level was positive (3.2 on a 5-point scale). This is not inconsistent with the limited literature on perceptions of psychoeducational reports. Pelco et al. (Reference Pelco, Ward, Coleman and Young2009) reported that overall, teachers believed all three psychoeducational reports were of high quality. In addition, Hagborg and Aiello-Coultier (Reference Hagborg and Aiello-Coultier1994) found that teachers are generally favourably impressed by psychoeducational reports. As previously indicated, no studies were found looking at psychologists’ satisfaction with psychoeducational reports.
Although there were no statistical differences for teachers’ ratings of satisfaction of psychoeducational reports in the present study, some potentially important trends can be observed within the findings. Specifically, the theme-based non-technical report had higher overall satisfaction ratings for new and special education teachers (M = 4.11 and M = 3.71, respectively). In addition, the theme-based non-technical report was rated as being better than other psychoeducational reports participants had read for new and special education teachers (M = 3.44 and M = 3.78, respectively). It appears as though the new and special education teachers are more satisfied with reports that have a lower reading grade level with a reduction in technical jargon, and are a style of report that more closely resembles the way in which they conceptualise a child's strengths and limitations (Bucknavage, Reference Bucknavage2007). It is possible that the small sample size in this study accounted for the lack of significance, and that a larger sample involving more participants might result in significant findings.
Utility of the Report
The expectation, based on the study of Pelco at al. (Reference Pelco, Ward, Coleman and Young2009), that the theme-based non-technical report would receive significantly higher ratings of utility, was not supported, but there were significant differences between the two groups of respondents. Teachers considered the reports in general to be more useful than psychologists. However, as can be seen from Figure 2, teachers’ opinions of utility varied greatly depending on their level of experience. New teachers found the theme-based non-technical report much more useful than the test-by-test style of report. In contrast, the experienced teachers found the theme-based non-technical report least useful. This could possibly be due to the fact that new teachers had read fewer psychoeducational reports and hence were less familiar with the jargon. It is also likely that the most experienced teachers were used to gaining most information from the recommendations and appendices, so when these were missing from the reports they had to rely on what information they could find in the body of the report. This would be consistent with the findings of Cheramie et al. (Reference Cheramie, Goodman, Santos and Webb2007), who reported that teachers prefer to read and are better able to understand reports that have concrete, specific recommendations. This is particularly relevant to special education teachers, who use psychoeducational reports on a regular basis to facilitate program planning, curriculum learning and specialised learning support. These experienced teachers may well have found statements such as ‘Rick's VCI standard score was 73 which falls in the Borderline range’, found in the test-by-test style report, more informative than ‘Rick has a significant weakness in his ability to understand and use language’, as written in the theme-based non-technical report.
Understanding of the Report
In the current study, report style had its greatest impact on understandability. Psychologists found the reports in general easier to understand than the teachers. This is not surprising given that reports are part of their day-by-day work. Again, based on the Pelco et al. (Reference Pelco, Ward, Coleman and Young2009) study, it was expected that the theme-based non-technical report would be understood by readers at significantly higher levels than the other two report styles. This was supported in the present study. It should be noted, however, that this finding was moderated by a significant respondent group × report style interaction. As can be seen in Figure 2, while the teachers clearly preferred the theme-based non-technical style to the other two report styles, the psychologists rated the test-by-test report style almost as highly as the theme-based non-technical report. This is a major finding of our study, as it points up a major difference between writers and readers of reports. Teachers, regardless of their level of experience, find reports that are free of jargon easiest to understand. They are one of the main consumer groups of psychoeducational reports. Psychologists — the report writers — do not experience the difficulty presented by technical language. It is imperative that psychologists are aware of this difference so they can modify their writing style to take into account the audience of their communications. It is likely that parents, the other consumer group, would have even more difficulties than teachers with technical language. Further research to investigate this question is warranted.
Limitations of the Present Study
Readers of psychoeducational assessment reports typically have more information available to them than the information provided in these three alternate report styles. As previously noted, it is possible that the absence of the summary, recommendations and appendices sections of the reports affected respondents’ perceptions of the utility and understandability of the reports and negatively impacted satisfaction levels. This is particularly likely to have been the case with the more experienced readers, special education teachers and psychologists, who are the most likely to go to the data and recommendations in order to interpret and apply the information. If it proves possible to produce reports that vary on the dimensions of style (theme-based vs. test-by-test) and jargon (technical vs. non-technical) and that also include the missing components of the reports used in this study, this would enable conclusions about the impact of the different reports to be made more confidently.
The small size of the groups sampled was also a significant limitation in the present study. Survey research is typically limited by a low response rate and this study was no different. Thus, a sample that included more participants, especially psychologists, would have enabled additional within-group analyses to be conducted, as well as providing greater likelihood of significant results in those instances where trends were observed.
Conclusions
This study is the first carried out in Australia that has examined the impact of different report styles on the perceptions of both readers and writers of the utility and understandability of the reports and gauged their satisfaction with them. The results of the present study provide evidence of differences between psychologists and teachers that should be noted by report writers if they want the data they have collected to be of most value to the readers.
While teachers reported higher satisfaction levels with the reports and rated them more highly on utility than psychologists, it was clear that they found them much harder to understand, especially the traditional test-by-test style of report. Differences within the teacher group should also be noted by report writers. Less experienced teachers found theme-based non-technical reports to be more useful than reports using technical language. Although psychoeducational reports are written about children, they are typically written with teachers and parents as the intended readers. If recommendations are to be acted upon, it is critical that the reader can fully understand the report. Psychologists who are currently writing psychoeducational reports need to be mindful that reports that they may find clear and fully understandable, may not be so for the non-psychologist reader if technical language is used. In addition, those involved in the practical training of psychologists would do well to consider theme-based non-technical report writing as a skill to be mastered by trainees.
Acknowledgments
The authors would like to thank Lynn Pelco, Professor and Co-Director, School Psychology Program, College of William and Mary, and her colleagues, for kindly allowing us to use their psychological assessment reports in our study.