INTRODUCTION
One of the concerns about any infectious disease is its ability to invade a population (van den Driessche and Watmough, Reference van den Driessche and Watmough2002). For this reason, it is mandatory to estimate threshold quantities relative to the control of the disease. The basic reproduction number, R 0, is inarguably one of the foremost and most valuable ideas that mathematical thinking has brought to endemic theory (Anderson and May, Reference Anderson and May1991; Heesterbeek and Dietz, Reference Heesterbeek and Dietz1996; Diekmann and Heesterbeek, Reference Diekmann and Heesterbeek2000; Heffernan et al. Reference Heffernan, Smith and Wahl2005). The derivation of R 0 for a heterogeneous system, such as a vector-borne infection, is complicated because of the high level of heterogeneity, in which different types of individuals are distinguished by epidemiologically substantial characteristics such as the species, the stage of the infection and the multiple transmission routes that the pathogen might follow. The average number of hosts infected by a vector and, vice versa, the number of vectors infected by a host, should then be ‘averaged’, because R 0 considers the system as a whole (Diekmann and Heesterbeek, Reference Diekmann and Heesterbeek2000; Roberts and Heesterbeek, Reference Roberts and Heesterbeek2003; Heffernan et al. Reference Heffernan, Smith and Wahl2005; Hartemink et al. Reference Hartemink, Randolph, Davis and Heesterbeek2008; Roberts, Reference Roberts2008). In this sense, previous studies have presented the type-reproduction number, T, which determines the expected number of individuals of a particular type infected by an individual of that type in a totally susceptible population, either directly or through chains of infection passing through any sequence of the other types (Roberts and Heesterbeek, Reference Roberts and Heesterbeek2003; Heesterbeek and Roberts, Reference Heesterbeek and Roberts2007). Furthermore, T allows estimating the control effort required to eliminate an infectious disease when control is applied to a specific subpopulation. The matrix K of the next-generation method allows characterizing the values of R 0 and T, even in systems where many different categories of individuals are recognized (Diekmann et al. Reference Diekmann, Heesterbeek and Metz1990, Reference Diekmann, Heesterbeek and Roberts2010; Diekmann and Heesterbeek, Reference Diekmann and Heesterbeek2000; van den Driessche and Watmough, Reference van den Driessche and Watmough2002; Roberts and Heesterbeek, Reference Roberts and Heesterbeek2003; Heffernan et al. Reference Heffernan, Smith and Wahl2005; Heesterbeek and Roberts, Reference Heesterbeek and Roberts2007). This approach has the advantage that the steps needed to reach an estimate of these thresholds and the entries of K have a clear biological basis: the matrix element k ij is the expected number of secondary cases in individuals type i that would arise from a typical primary case type j during the entire infectious period in a susceptible population.
Here, we analysed a model for American trypanosomiasis (Chagas disease), in which several subpopulations, each with a different epidemiological reaction to the pathogen (the protozoan Trypanosoma cruzi, Kinestoplastida, Trypanosomatidae), are involved. Chagas disease is one of the main health problems in Latin America not only because of its social and economic effect and its influence on morbidity/mortality, but also because of the difficulty in controlling it, especially for the natural transmission through haematophagous triatomine insects. About 7–8 million infected humans are estimated to live in 21 countries (World Health Organization, 2015). The incorporation into cities of infected humans, most of whom are asymptomatic and unaware of their infected condition, increases the risk of transmission. The so-called ‘urban Chagas’, involving only the human population, is an emerging problem in cities of Latin America, Europe, Australia and Japan in which Chagas disease is not endemic (Schmunis and Yadon, Reference Schmunis and Yadon2010; Howard et al. Reference Howard, Xiong, Carlier, Sosa-Estani and Buekens2014, World Health Organization, 2015). The natural evolution of Chagas disease in humans has been divided into three stages: the acute stage, the chronic indeterminate stage and the chronic-with-determinate-pathology stage. The acute stage is the shortest (typically lasting 1 or 2 months) and is characterized by high blood parasitaemia. Specific symptoms and signs that allow diagnosis are developed in only a small number of recently infected humans (World Health Organization, 2015). Therefore almost all infected humans enter the chronic indeterminate stage, which might last 20–30 years or even a lifetime. It is an asymptomatic stage and, as the level of blood parasitaemia is low, the diagnosis is by (not always available) serological methods. It is estimated that one-third of these humans evolve to the chronic-with-determinate-pathology stage, which affects humans in the productive stage of their lives with high morbidity (myocarditis, megaesophagus, megacolon, encephalitis or respiratory injuries) and mortality (Storino, Reference Storino2010). In this way, patients who suffer the infection are often not aware that they are infected with T. cruzi, a fact that favours the progress of the disease and the spread of the infection (Médicos sin Frontera, 2005). Available antiparasitic drugs are used mostly during the acute stage and the first years of the chronic indeterminate stage. Evidence about their action at the chronic-with-determinate-pathology stage is still controversial (Sosa-Estani et al. Reference Sosa-Estani, Viotti and Segura2009; Muñoz et al. Reference Muñoz, Murcia and Segovia2011; Aguilera-Venegas et al. Reference Aguilera-Venegas, Olea-Azar, Arán and Speisky2013).
In endemic areas of Latin America where triatomines are present, dogs constitute the main domestic reservoir of T. cruzi, determining a serious risk of transmission (Gürtler et al. Reference Gürtler, Kravetz, Petersen, Lauricella and Wisnivesky-Colli1990; Crisante et al. Reference Crisante, Rojas, Teixeira and Añez2006; Estrada-Franco et al. Reference Estrada-Franco, Bhatia, Diaz-Albiter, Ochoa-García, Barbosa, Vazquez-Chagoran, Martinez-Perez, Guzman-Bracho and Garg2006). They acquire the infection mostly by the vectorial and congenital routes (Gürtler et al. Reference Gürtler, Kravetz, Petersen, Lauricella and Wisnivesky-Colli1990).
Mathematical models apply to the study of infectious diseases because: (i) they may reveal features that are not obvious at first sight and may help to clarify assumptions, variables and parameters; (ii) it is possible to extract properties and features of the relationships among elements from the model that would otherwise stay uncovered; (iii) it is possible to try to construct a suitable model describing the basic features of an epidemics in order to predict the consequences of the introduction of specific changes; (iv) they can describe the dispersal of an infectious disease under different scenarios; and (v) by modifying parameter values, the model can examine potential scenarios that are difficult to create through experimentation (Hethcote, Reference Hethcote2000; Montenesinos-López and Hernández Suarez, Reference Montenesinos-López and Hernández Suarez2007).
Simple mathematical models could contribute significantly to our understanding of these diseases and the efforts required to control them (Kealey and Smith, Reference Kealey and Smith2010). Cohen and Gürtler (Reference Cohen and Gürtler2001) developed a mathematical model to represent T. cruzi transmission in a typical individual household in the Grand Chaco of Argentina. The model did not distinguish among different phases of infection in the human population. These authors showed that keeping dogs and other highly infectious vertebrates out of the bedroom areas can effectively reduce the triatomine and human prevalence rate. Considering only the triatomine population, Peterson et al. (Reference Peterson, Sánchez-Cordero, Beard and Ramsey2002) used ecological niche modelling to identify host relationships of Triatoma species implicated in the transmission of Chagas’ disease in Mexico. They predicted a geographic interaction between two species in regions where one of the species had not previously been collected. This approach may help identify Chagas's disease risk areas and planning vector-control strategies. Inaba and Sekine (Reference Inaba and Sekine2004) developed a mathematical model in which they assumed that the human population was structured by disease age and in which they considered the effects of vector and blood transfusion. Their analysis suggested that to reduce the ratio of the density of vectors to the density of humans would be most effective to control the vector transmission. These authors noticed that many factors remained neglected in their model and that these should be considered in a future model, because the population dynamics of the vector would be much more complex. For example, the existence of reservoir host animals living around humans would play a very important role to spread the disease. Clauson et al. (Reference Clauson, Harrison, Shuman, Shillor and Spagnuolo2012) analysed a model of a system of four nonlinear ordinary differential equations for the total number of triatomines, the infected triatomines, the infected humans and the infected domestic animals and also considered vectorial transmission. They found that the model has two unstable disease-free equilibria and a globally asymptotically stable endemic equilibrium.
In this study, we applied the next-generation method, which allows characterizing the R 0 and several T values for the relative importance of the actors involved as well as estimating the expected number of new infections generated through each transmission route by each infected individual.
The main objective of the study was the derivation of the matrix of the next generation (K), a mathematical tool that allows us to: (i) obtain the formula that determines R 0 , (ii) give the biological interpretation of each of its elements, and (iii) determine the type-reproduction numbers T corresponding to the three populations of individuals considered. The matrix K thus allows us to quantify the effect of the introduction of an infected individual (either a human at any of the three stages of infection, an infected triatomine or an infected dog), in the generation of new infected individuals during the entire period of infectivity (even through any possible infection from the infected individual), when this enters a population composed entirely of susceptible individuals.
The methodology was applied to the hyperendemic rural region of the Argentine Gran Chaco, because the model represents the situation in that region and because there is available information about the values of the parameters.
MATERIALS AND METHODS
The model
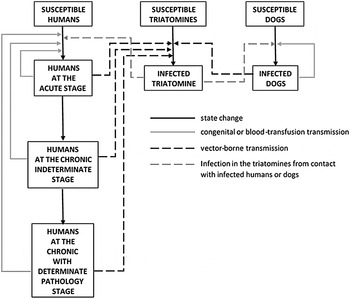
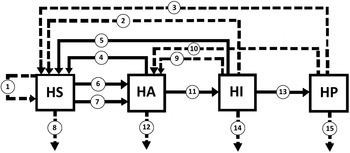
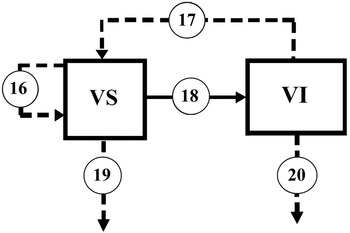
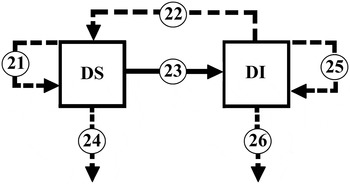
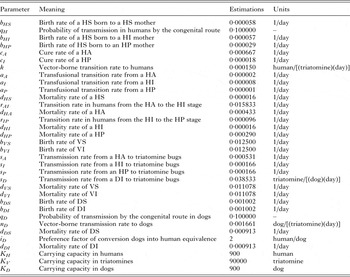
We formulated a mathematical deterministic model considering: (i) the human population, partitioned into susceptible humans (HS), humans at the acute stage (HA), humans at the chronic indeterminate stage (HI) and humans at the chronic-with-determinate-pathology stage (HP); (ii) susceptible and infected triatomines and dogs denoted VS, VI, DS and DI, respectively; and (iii) the main transmission routes (the vectorial, congenital and transfusional routes, in the human population, the vectorial and congenital routes in the dog population and the transmission by contact with infected humans or dogs in the triatomine population). The corresponding biological processes have been previously described in detail (Fabrizio et al. Reference Fabrizio, Schweigmann and Bartoloni2014a ). Figure 1 shows the interactions between the human, triatomine and dog populations according to the processes considered. Figures 2–4 show the diagram of the infection dynamics of the proposed model in the human population, the triatomine population and the dog population, respectively. The meaning of each parameter used is presented in Table 1. The model can be expressed in a system of ordinary differential equations (see Supplementary material) used to build a tool (K) that allows us to determine the infective contribution of each infected individual at the initial moment of the infection, when it enters a population composed of susceptible individuals. The model considers population regulations mainly those by the host irritability and the refuge quality in the houses in the case of triatomines (Rabinovich and Himschoot, Reference Rabinovich and Himschoot1990) and the availability of resources in the case of dogs and humans. The model is applied to a representative village of 100 houses of that region.
Block diagram of the process of Trypanosoma cruzi infection in the human, triatomine and dog populations according to the model.

Diagram of the infection dynamics of the proposed model in the human population. Dotted lines indicate birth or death. Solid lines indicate movements of humans from one epidemiological stage to another. Letters for the stages: susceptible humans (HS), humans at the acute stage (HA), humans at the chronic indeterminate stage (HI) and humans at the chronic-with-determinate-pathology stage (HP). 1: Birth of susceptible human to a susceptible mother, 2: Birth of susceptible human to a mother at the chronic indeterminate stage, 3: Birth of susceptible human to a mother at the chronic-with-determinate-pathology stage, 4: Cure of human at the acute stage, 5: Cure of human at the chronic indeterminate stage, 6: Evolution of a susceptible human to the acute stage by vector-borne transmission, 7: Evolution of a susceptible human to the acute stage by blood transfusion, 8: Mortality of susceptible human, 9: Birth of infected human to a mother at the chronic indeterminate stage, 10: Birth of infected human to a mother at the chronic-with-determinate-pathology stage, 11: Evolution of human from the acute stage to the chronic indeterminate stage, 12: Mortality of human at the acute stage, 13: Evolution of human from the chronic indeterminate stage to the chronic-with-determinate-pathology stage, 14: Mortality of human at the chronic indeterminate stage, 15: Mortality of human at the chronic-with-determinate-pathology stage.

Diagram of the infection dynamics of the proposed model in the triatomine population. Dotted lines indicate birth or death. Solid lines indicate movements of individuals from an epidemiological stage to another. Letters for the stages not only indicate the stage, but also the size of the subpopulation at that stage: susceptible triatomines (VS) and infected triatomines (VI). 16: Birth of a susceptible triatomine born to a susceptible triatomine, 17: Birth of a susceptible triatomine born to an infected triatomine, 18: Evolution of a susceptible triatomine to the infected stage by contact with an infected human or dog, 19: Mortality of a susceptible triatomine, 20: Mortality of an infected triatomine.

Diagram of the infection dynamics of the proposed model in the dog population. Dotted lines indicate birth or death. Solid lines indicate movements of individuals from an epidemiological stage to another. Letters for the stages: susceptible dogs (DS), infected dogs (DI). 21: Birth of a susceptible dog to a susceptible mother, 22: Birth of susceptible dog to an infected mother, 23: Evolution of susceptible dog to the infected stage by vector-borne transmission, 24: Mortality of susceptible dog, 25: Birth of infected dog to an infected mother, 26: Mortality of infected dog.

Estimation of the parameters considered in the next-generation matrix

HS, susceptible humans; HA, humans at the acute stage; HI, humans at the chronic indeterminate stage; HP, humans at the chronic-with-determinate- pathology stage; VS, susceptible triatomines; VI, infected triatomines; DS, susceptible dogs; DI, infected dogs
The dependent variables in the ordinary differential equation system are: the number of susceptible humans at time t, H S (t), the number of humans at the acute stage at time t, H A (t), the number of humans at the chronic indeterminate stage at time t, H I (t), the number of humans at the chronic with-determinate-pathology stage at time t, H P (t), the number of susceptible triatomines at time t, V S (t), the number of infected triatomines at time t, V I (t), the number of susceptible dogs at time t, D S (t), and the number of infected dogs at time t, D I (t).
Next-generation matrix
To derive epidemiological measures for the contribution of humans (at each stage of the infection), triatomines and dogs to the transmission of T. cruzi infection, we used the next-generation matrix method (Diekmann et al. Reference Diekmann, Heesterbeek and Metz1990, Reference Diekmann, Heesterbeek and Roberts2010; Diekmann and Heesterbeek, Reference Diekmann and Heesterbeek2000; van den Driessche and Watmough, Reference van den Driessche and Watmough2002; Heffernan et al. Reference Heffernan, Smith and Wahl2005).
Our model involves eight compartments, five of which belong to the infected stages. H A (t), H I (t), H P (t), V I (t) and D I (t) are the number of individuals at each of the five infected stages. Under this model, K is a 5 × 5 matrix with the following structure:
 $${\bf K}\, = \,\,{\kern 1pt} \left[ {\matrix{ {k_{{11}}} & {k_{{12}}} & {k_{{13}}} & {k_{{14}}} & {k_{{15}}} \cr {k_{{21}}} & {k_{{22}}} & {k_{{23}}} & {k_{{24}}} & {k_{{25}}} \cr {k_{{31}}} & {k_{{32}}} & {k_{{33}}} & {k_{{34}}} & {k_{{35}}} \cr {k_{{41}}} & {k_{{42}}} & {k_{{43}}} & {k_{{44}}} & {k_{{45}}} \cr {k_{{51}}} & {k_{{52}}} & {k_{{53}}} & {k_{{54}}} & {k_{{55}}} \cr}} \right]\; = \,\left( {\matrix{ {N_{{HA} \to {HA}}} & {N_{{HI} \to {HA}}} & {N_{{HP} \to {HA}}} & {N_{{VI} \to {HA}}} & {N_{{DI} \to {HA}}} \cr {N_{{HA} \to {HI}}} & {N_{{HI} \to {HI}}} & {N_{{HP} \to {HI}}} & {N_{{VI} \to {HI}}} & {N_{{DI} \to {HI}}} \cr {N_{{HA} \to {HP}}} & {N_{{HI} \to {HP}}} & {N_{{HP} \to {HP}}} & {N_{{VI} \to {HP}}} & {N_{{DI} \to {HP}}} \cr {N_{{HA} \to {VI}}} & {N_{{HI} \to {VI}}} & {N_{{HP} \to {VI}}} & {N_{{VI} \to {VI}}} & {N_{{DI} \to {VI}}} \cr {N_{{HA} \to {DI}}} & {N_{{HI} \to {DI}}} & {N_{{HP} \to {DI}}} & {N_{{VI} \to {DI}}} & {N_{{DI} \to {DI}}} \cr}} \right)$$
The entries of K = (k ij ), also denoted N j→i , represent the expected number of new cases belonging to the class of infected individual i infected by an individual belonging to class j entering a totally susceptible population, during the entire period of infectiousness. In the Supplementary material, we show how to obtain matrix K.
 $${\bf K} = \left[ {\matrix{ {k_{11}} &\quad {k_{12}} &\quad {k_{13}} &\quad {k_{14}} & 0 \cr 0 & 0 & 0 & 0 & 0 \cr 0 & 0 & 0 & 0 & 0 \cr {k_{41}} & {k_{42}} & {k_{43}} & 0 & {k_{45}} \cr 0 & 0 & 0 & {k_{54}} & {k_{55}} \cr}} \right]$$
The entries of K have the following expressions:
 $$\eqalign{{k}_{11} = &\,\,{a}_{A} \displaystyle{1 \over {{c}_{A} + {r}_{{AI}} + {d}_{{HA}}}} \cr & + \left( {{a}_I + {b}_{{HI}} {q}_{H} \left( {1 - \displaystyle{{{H}_{{S}_0} ^{\ast}} \over {{K}_{H}}}} \right)} \right) \cr &\times \displaystyle{{{r}_{{AI}}} \over {({c}_{A} + {r}_{{AI}} + {d}_{{HA}} )}}\displaystyle{1 \over {({c}_{I} + {r}_{{IP}} + {d}_{{HI}} )}} \cr & + \left( {{a}_{P} + {b}_{{HP}} {q}_{H} \left( {1 - \displaystyle{{{H}_{{S}_0} ^{\ast}} \over {{K}_{H}}}} \right)} \right) \cr &\times \displaystyle{{{r}_{{AI}} {r}_{{IP}}} \over {({c}_{A} + {r}_{{AI}} + {d}_{{HA}} )({c}_{I} + {r}_{{IP}} + {d}_{{HI}} )\,}}\,\displaystyle{1 \over {{d}_{{HP}}}}}$$
 $$\eqalign{k_{12} = & \left( {a_I + b_{HI} q_H \left( {1 - \displaystyle{{H_{S_0} ^{\ast}} \over {K_H}}} \right)} \right)\displaystyle{1 \over {c_I + r_{IP} + d_{HI}}} \cr& + \left( {a_P + b_{HP} q_H \left( {1 - \displaystyle{{H_{S_0} ^{\ast}} \over {K_H}}} \right)} \right)\displaystyle{{r_{IP}} \over {(c_I + r_{IP} + d_{HI} )\,}}\, \displaystyle{1 \over {d_{HP}}}} $$
 $$k_{13} = \left( {a_P + b_{HP} q_H \left( {1 - \displaystyle{{H_{S_0} ^{\ast}} \over {K_H}}} \right)} \right)\displaystyle{1 \over {d_{HP}}} $$
 $$k_{14} = \displaystyle{{H_{S_0} ^{\ast}} \over {H_{S_0} ^{\ast} + i_D D_{S_0} ^{\ast}}}\, \displaystyle{k \over {d_{VI}}} $$
 $$\eqalign{k_{41} &=\, \displaystyle{{V_{S_0} ^{\ast}} \over {H_{S_0} ^{\ast} + i_D D_{S_0} ^{\ast}}} \left(\displaystyle{{s_A} \over {c_A + d_{HA} + r_{AI}}}\right. \cr &\quad + \displaystyle{{s_I r_{AI}} \over {(c_A + d_{HA} + r_{AI} )(c_I + d_{HI} + r_{IP} )}} \cr &\quad \left. { + \displaystyle{{s_P r_{AI} r_{IP}} \over {(c_A + d_{HA} + r_{AI} )(c_I + d_{HI} + r_{IP} )d_{HP}}}} \right)} $$
 $$k_{42} =\,\displaystyle{{V_{S_0} ^{\ast}} \over {H_{S_0} ^{\ast} + i_D D_{S_0} ^{\ast}}} \left( {\displaystyle{{s_I} \over {c_I + d_{HI} + r_{IP}}} + \displaystyle{{s_P r_{IP}} \over {(c_I + d_{HI} + r_{IP} )d_{HP}}}} \right)$$
 $$k_{43} =\,\, \displaystyle{{V_{S_0} ^{\ast}} \over {H_{S_0} ^{\ast} + i_D D_{S_0} ^{\ast}}} \displaystyle{{s_P} \over {d_{HP}}} $$
 $$k_{45} =\,\, \displaystyle{{V_{S_0} ^{\ast}} \over {H_{S_0} ^{\ast} + i_D D_{S_0} ^{\ast}}} \displaystyle{{i_D s_D} \over {d_{DI}}} $$
 $$k_{54} =\,\, \displaystyle{{D_{S_0} ^{\ast}} \over {H_{S_0} ^{\ast} + i_D D_{S_0} ^{\ast}}} \displaystyle{{i_D n_D} \over {d_{VI}}} $$
 $$k_{55} =\,\, \displaystyle{{b_{DI} q_D \left( {1 - \displaystyle{{H_{D_0} ^{\ast}} \over {K_D}}} \right)} \over {d_{DI}}} $$
These entries of K have the following epidemiological meaning:
-
• k 11: Expected number of humans that a typical HA will infect through his or her infectious lifetime in a HS population. The first term in k 11 stands for the number of new infected humans generated by a typical HA (only by blood transfusion, according to model assumptions), the factor 1/(c A + r AI + d HA ) being the mean sojourn time at this stage. The second term in k 11 stands for the number of new infected humans horizontally and vertically generated by a human initially at the HA stage during the time he/she spends at the HI stage More specifically, the factor r AI /(c A + r AI + d HA ) stands for the fraction of HA that evolve to HI stage and the factor 1/(c I + r IP + d HI ) stands for the mean lapse during which the human remains at that stage. Similarly, the third term in k 11 is the product of three factors: (i) the infectivity per unit time of an HP, denoted
 $[a_P + b_{HP} q_H (1 - H^{\ast}_{S_{0}}/K_H)]$
; (ii) the fraction of humans initially infected who have survived until that stage, given by r
AI
rIP
/[(c
A
+ r
AI
+ d
HA
)(c
I
+ r
IP
+ d
HI
)]; and (iii) the average infectivity period of a human at that stage, 1/d
HP
.
-
• k 12 and k 13: Expected number of humans that an HI and an HP will infect through his/her infectious lifetime, respectively.
-
• k 14: Expected number of humans that a VI will infect through its infectious lifetime, k being the rate of vector-borne transmission and 1/d VI the mean lifetime of the infected insect.
-
• k 41: Expected number of triatomines that an HA will infect through his/her infectious lifetime. Its structure is analogous to the formula of k 11, except that the infection rates are s A , sI and s P , according to the origin of the infection (HA, HI or HP, respectively).
-
• k 42 and k 43: Expected number of infected triatomines that an HI and an HP will infect through his/her infectious lifetime, respectively.
-
• k 45: Expected number of infected triatomines that a DI will infect through its infectious lifetime (1/d DI being the expected duration of the time spent in the DI class).
-
• k 54: Expected number of infected dogs that a VI will infect through its infectious lifetime. (1/d VI being the expected duration of the time spent in the VI class).
-
• k 55: Expected number of infected dogs that a DI will infect (by the congenital route) through its infectious lifetime.

Threshold numbers R 0 and T
The value of R 0 is calculated as the spectral radius (dominant eigenvalue) of the next-generation matrix K, R 0 = ρ(K) (Diekmann et al. Reference Diekmann, Heesterbeek and Metz1990; Diekmann and Heesterbeek, Reference Diekmann and Heesterbeek2000; Roberts and Heesterbeek, Reference Roberts and Heesterbeek2003). Therefore, according to our matrix K, it is the maximum λ (in absolute value) satisfying:
 $$\eqalign{& l^3 - (k_{11} + k_{55} )l^2 + (k_{11} k_{55} -k_{45} k_{54} - k_{14} k_{41} ) \cr & \quad l + (k_{11} k_{45} k_{54} + k_{14} k_{41} k_{55} ) = 0}$$
The mathematical details of the analysis of sensitivity and elasticity of parameters related to R 0 can be found in the Supplementary material.
A method denoted by the type-reproduction numbers T has been proposed to estimate the expected number of infected individuals of a specific type generated by an individual of that type in a totally susceptible population, taking into account that the infection will pass through other types of individuals of the same species or of another species (Roberts and Heesterbeek, Reference Roberts and Heesterbeek2003; Heesterbeek and Roberts, Reference Heesterbeek and Roberts2007). Although we were interested in the five types of infected individuals (HA, HI, HP, VI and DI), we focused the attention on HA, VI and DI. As for the human population, we considered only the first stage of the infection because an HA can develop all the other stages of the disease. In the Supplementary material, we derived the corresponding T values.
NUMERICAL RESULTS
A detailed estimation of all the parameters involved in the model can be found in Fabrizio et al. (Reference Fabrizio, Schweigmann and Bartoloni2014a ). Table 1 shows these values.
The derived next-generation matrix K is
 $${\bf K =} \left( {\matrix{ {0 \!\cdot\! 0732} & {0 \!\cdot\! 0782} & {0 \!\cdot\! 0062} & {0 \!\cdot\! 011} & 0 \cr 0 & 0 & 0 & 0 & 0 \cr 0 & 0 & 0 & 0 & 0 \cr {20 \!\cdot\! 43} & {21 \!\cdot\! 43} & {7 \!\cdot\! 22} & 0 & {1064} \cr 0 & 0 & 0 & {0 \!\cdot\! 03} & {0 \!\cdot\! 10} \cr}} \right)$$
The numerical value of each non-zero element of K is explained below.
The expected number of new HA generated in a susceptible population (according to the assumptions of the model, only by the transfusional route) by a human who is at the HA stage during that stage is 0·0001. The expected number of new HA generated, either by the transfusional or congenital route, by a human initially at the HA stage during the time he/she at the HI stage is 0·0688. The expected number of new HA generated either by the transfusional or by the congenital route by a human who survived the HA and the HI stages and is at the HP stage during the time he/she remains at this stage is 0·0043. That is, if an HA enters a susceptible population, he/she generates an average of 0·0732 infected humans during his/her infectivity time.
If an HI enters a susceptible population, he/she generates (by the congenital or transfusional routes) 0·0736 new infected humans, on average, during the time at that stage; but, during the time at the HP stage, he/she generates an expected number of 0·0046 infected humans. Therefore, an HI is expected to generate 0·0782 new infected humans over the entire period of infectivity.
A human who enters a susceptible population during the time he/she is at the HP stage will generate an average of 0·0062 new infected humans.
A VI that enters a susceptible population will generate an average of 0·01 infected humans.
If an HA enters a susceptible population, he/she will generate, on average, 0·40 infected triatomines while during the time he/she is at that stage; if he/she survives the HA stage then, while at the HI stage, the expected number of VI generated is 15·05; and if he/she also survives that second stage of the infection, he/she is expected to generate 4·98 infected triatomines while during the time he/she is at the HP stage. Therefore, if an HA enters a susceptible population, he/she will generate an average of 20·43 infected triatomines during the three infection stages.
If an HI enters a susceptible population, he/she will generate an average of 16·10 infected triatomines, and if he/she survives that stage, he/she will generate an expected number of 5·33 infected triatomines during the HP stage. That is, an HI generates an average of 21·43 infected triatomines during all his/her infectivity time.
If an HP enters a susceptible population, he/she will generate an average of 7 VI.
A DI will generate an average of 1064 VI and an average of 0·10 DI (by the congenital route) during its infectivity period. A VI that enters a susceptible population will generate an average of 0·03 DI.
Regarding the transmission by blood transfusion, an HA is expected to generate 0·0001 new infected humans during the time he/she is at this stage, 0·0575 humans while at the HI stage, and 0·0024 during the time he/she is at the HP stage. So, 0·06 is the expected number of new infected humans generated by an HA during all his/her infectivity lifetime. Similarly, 0·0641 is the expected number of new infected humans generated by an HI (0·0615 while at this stage and 0·0026 while at the HP stage). Finally, 0·0034 is the expected number of new infected humans generated by an HP.
Regarding congenital transmission, 0·0113 is the expected number of infected babies born to an HA mother during the time she is at the HI stage, whereas 0·0019 is the expected number of infected babies when the mother is at the HI stage. So an HA mother will generate 0·0132 infected babies during her infectivity lifetime. Similarly, 0·0141 is the expected number of infected babies born to an HI mother during her infectious lifetime, 0·0121 while at this stage and 0·0020 while at the HP stage. Finally, 0·0028 is the expected number of infected babies born to an HP mother.
It is worth noting that some of the matrix elements are zero because not all the individuals belonging to the infection classes infect all the individuals in the various compartments. For example, matrix rows 2 and 3 are composed only of zeros because, due to the infection dynamics, only new infected humans (HA) are generated. Besides, since infection between dogs and humans is not considered, cells (1, 5), (5, 1), (5, 2) and (5, 3) are zeros. The element (4, 4) is 0 as well because it is assumed that T. cruzi is not transmitted among triatomines.
For this scenario, R 0 is calculated to be 5·6773.
With regard to the sensitivity of each entry of the next-generation matrix related to R 0, the transmission from triatomines dogs stands out. The elasticities in the infestation among dogs and triatomines are higher and of the same value. Equal elasticities imply that the same proportional change in two entries will have the same effect on R 0.
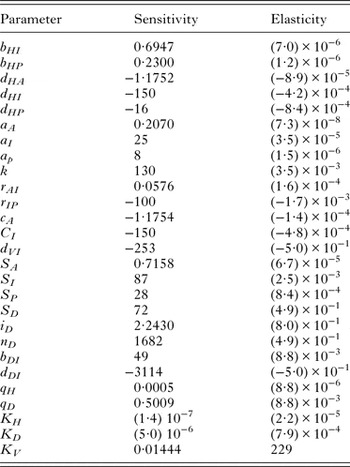
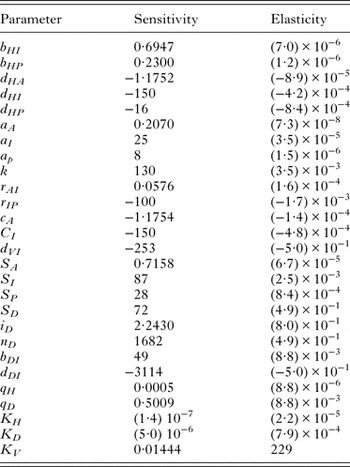
Table 2 shows the values of sensitivity and elasticity corresponding to parameters related to the calculation of R 0. Negative values of sensitivity and elasticity indicate that the increase in the corresponding parameter values determines a decrease in R 0. The parameter d DI stands out from the other parameters due to its high sensitivity value and its absolute value of elasticity. The parameters n D , dVI, sD and i D also showed high elasticity. The elasticity of K V is high because K V is included in its calculation. The elasticity of the model regarding parameters in humans is negligible. Table 3 shows the values of R 0 before changes in parameter values. Values in Table 3 confirm that the R 0 value, estimated as 5·6773, is sensitive to the death rates and rates of transmission between infected triatomines and dogs. Changes about 50% in the death rates and transmission between infected triatomines and dogs determine the same effect on R 0.
Sensitivity and elasticity of parameters related to R 0
Changes in R 0 produced by changes in parameter values

To be more specific, we next estimated the T values (see the Supplementary material). In the case of humans, as ρ[(I − P)K] = 5·7 > 1, a reservoir host (or vector) other than humans exists. So, the other types of individuals (dogs and triatomines) at which the control effort is not aimed can sustain an epidemic by themselves.
In the case of triatomines, as ρ[(I − P)K V] = 0·10 < 1, we can determine T V . Hence, it is estimated that there are 35 VI caused by one VI in a totally susceptible population through chains of infection passing through any sequence of individuals of other types (such as infected humans or dogs). The infection will be eliminated over time if more than 97% of the triatomine population remains uninfected, which is unlikely in real populations.
Similarly, in the dog population, as ρ[(I − P)K D ] = 0·51 < 1, we can determine T D . We estimated 41·5 DI generated by one DI incorporated in a totally susceptible population, through chains of infection passing through a dog (congenital) or any sequence of individuals of other types (such as infected triatomines). To eliminate the infection over time, more than 98% of the dog population is required to be permanently protected from infection.
DISCUSSION
In the present work, we evaluated the relative importance of humans in the three clinical stages of the infection, of infected triatomines and dogs, and of the routes of transmission of T. cruzi (congenital, transfusional and vectorial in humans; congenital and vectorial in dogs; and by contact with infected humans or dogs in triatomines). For this purpose, explicit expressions of each entry of the next-generation matrix and the numbers T were derived. A detailed estimation of the parameters involved in all the processes can be found in our previous study (Fabrizio et al. Reference Fabrizio, Schweigmann and Bartoloni2014a ).
This model was designed to represent the dynamics of infection in a typical dwelling in an endemic rural area of the Argentine Gran Chaco. It was assumed that such house type presents features in its construction that favour the proliferation of triatomines and that no vector control is applied. For this reason, in that work the exponential growth was intentionally considered. In addition, in that model, the movements of triatomines generated between the house and the peridomestic structures (storage rooms and corrals), as well as the inputs and outputs of humans and dogs, were important. The purpose was to determine the maximum infection that can arise if the three populations are allowed to grow freely without any control. The estimates of the parameters generated very low growths in humans and dogs and high populations of triatomines. The findings were realistic for the house in that region (Gürtler et al. Reference Gürtler, Cohen, Cecere and Chuit1997).
In the current manuscript, matrix K is implemented in a village representative of this region (100 houses) with those same characteristics of housing and without any vector control. The model considers population regulations such as host irritability and the quality of the refuge in the houses in the case of triatomines (Rabinovich and Himschoot, Reference Rabinovich and Himschoot1990) and the availability of resources in the case of dogs and humans. On the other hand, the model does not include migrations because we wanted to consider only the entry of an infected individual and its effect on a population made up only of susceptible individuals. Thus, in this regard, the population is closed. The only reason why we present the model of differential equations of the infection in the region is because matrix K is derived from it. Diverse reasons limit its use for predictive purposes. One of these is the fact that the region is very heterogeneous, with an added distribution in the three populations. The model served to build a tool (matrix K) that allowed us to determine how much each infected individual contributed at the ‘initial time’ of the infection, to determine the potential of each infected individual involved in the transmission.
We emphasized the importance of differentiating the three clinical stages of the disease in humans. Thereby,
-
(1) if an HA enters a susceptible population, he/she will generate 94% (0·0688/0·0732) of the new infected humans and 74% (15·05/20·43) of the new VI during the time he/she is at the HI stage;
-
(2) if an HI enters a susceptible population, he/she will generate 94% (0·0736/0·0782) of the new infected humans and 75% (16·10/21·43) of the new VI during the time he/she is at this stage.
So the epidemiological importance of the inclusion of a new chronic state is quantified by separating the humans at the HI stage from the humans at the HP stage. This is very appropriate given the effect of the parameters involved in the input and output processes from compartment HI on almost all the expressions related to the next-generation matrix. It must be taken into account that HI corresponds to the longest lifetime of infected humans and that almost all the infected humans remain in this ‘clinical silence’ over years because of the absence of easy-to-detect signs of the disease. Humans at this stage act as natural reservoirs of infection and contribute to keeping the parasite's vital cycle. These humans are basic elements in the dispersion of the disease because they can infect triatomines and spread the parasite by blood transfusion or congenitally. It has been shown that an HI is as dangerous as an HA for the dispersion of the infection. The importance of HI individuals has also been shown in our previous work in a triatomine-free scenario (Fabrizio et al. Reference Fabrizio, Schweigmann and Bartoloni2014b ).
The model and derived expressions were applied in a village of the Gran Chaco, a region where Chagas and other neglected diseases are endemic. The Gran Chaco is a 1·3-million-km2 ecoregion including parts of Argentina, Paraguay and Bolivia, with socio-economic features such as: (i) high poverty levels, (ii) low population density, (iii) rural population structures in small sparse villages connected only by worn (and sometimes impassable) pathways and (iv) poor health services. Vector-control programmes only reach transitory reduction in the level of infection and transmission, with a lack of a sustainable surveillance system for sparse and remote rural populations (Gürtler et al. Reference Gürtler, Kitron, Cecere, Segura and Cohen2007; Gurevitz et al. Reference Gurevitz, Gaspe, Enríquez, Vassena, Alvarado-Otegui, Provecho, Cueto, Picollo, Kitron and Gürtler2012). Moreover, it has been found that populations of Triatoma infestans (the main vector insect of T. cruzi in this region) have high levels of resistance to pyrethroids (Picollo et al. Reference Picollo, Vassena, Orihuela, Barrios, Zaidenberg and Zerba2005; Toloza et al. Reference Toloza, Germano, Cueto, Vassena, Zerba and Picollo2008). This region shows high levels of T. cruzi maternal prevalence, with high numbers of congenital infections and some transfusional transmissions (Gürtler et al. Reference Gürtler, Cohen, Cecere and Chuit1997; Garcia-Bournissen et al. Reference Garcia-Bournissen, Altcheh, Giglio, Mastrontonio, Della Vedova and Koren2009).
According to our estimations, an average of 100 infected triatomines over the entire period of infectivity would be required to transmit the infection to humans. These values allow us to obtain another quantity that is important in the epidemiology of the infection: the number of potential infective bites that are necessary to infect a human. We consider that a triatomine lives 289 days and feeds every 6 days (Fabrizio et al. Reference Fabrizio, Schweigmann and Bartoloni2014a ). Therefore, it is estimated that each bug feeds about 48 times in its life. Because the preference factor of triatomines to feed on dogs has been estimated to be 2 (Gürtler et al. Reference Gürtler, Cohen, Cecere and Chuit1997), 16 out of these 48 meals are on humans. As 100 triatomines are needed to infect a human, a triatomine is estimated to require 1600 potentially infected contacts to infect a human. This value agrees with that obtained by other researchers. Some researchers have estimated that it would take 1000–2500 infected contacts to infect a human (Rabinovich et al. Reference Rabinovich, Wisnivesky-Colli, Solarz and Gürtler1990), whereas others have estimated a value of 1250 (Cohen and Gürtler, Reference Cohen and Gürtler2001).
We also quantified the importance of the dog–triatomine interaction in the dynamics of T. cruzi infection. We deduced that a DI that enters a totally susceptible population will generate an average of 1064 VI over its entire period of infectivity. Considering that in the study area dogs live, on average, only 3 years and usually become infected in the first months of life (Gürtler et al. Reference Gürtler, Cecere, Vazquez, Chuit and Cohen1996), each dog will infect on average one triatomine per day. Conversely, each VI will generate 0·030 DI. Therefore, it takes only 34 VI to infect a dog. Considering that the number of triatomines inside a household might be in the hundreds or even thousands (Gürtler et al. Reference Gürtler, Kravetz, Petersen, Lauricella and Wisnivesky-Colli1990; Rabinovich et al. Reference Rabinovich, Wisnivesky-Colli, Solarz and Gürtler1990; Garcia-Bournissen et al. Reference Garcia-Bournissen, Altcheh, Giglio, Mastrontonio, Della Vedova and Koren2009), this number is very substantial. As, during its life, a triatomine feeds on dogs about 32 times, it is estimated that about 1000 potentially infected bites would be needed to infect a dog.
Complementarily, the high values of T V and T D calculated for the model are consistent with the complexity and difficulty in seeking control measures to block transmission in rural populations (Gurevitz et al. Reference Gurevitz, Gaspe, Enríquez, Vassena, Alvarado-Otegui, Provecho, Cueto, Picollo, Kitron and Gürtler2012). It has been shown that, for the complete elimination of the infection, all triatomines and dogs must be free of infection. Moreover, k 10 provides the number of infected dogs generated by the congenital route, and its value indicates the remaining fraction of infected dogs after the temporary elimination of triatomines during the control measures. An infected puppy might enter another household and thus infect the susceptible triatomines living there, starting another infection cycle.
At present, there is no protective vaccine against T. cruzi, and currently drugs do not create immunity. For example, if a child infected by the congenital route is detected and treated, he/she may be cured (HS), but if the surrounding conditions remain unchanged, the child may become infected again (HA) by the vectorial route.
In a previous paper (Fabrizio et al. Reference Fabrizio, Schweigmann and Bartoloni2014b ), we presented a model of the so-called urban Chagas, i.e. Chagas disease in a triatomine-free scenario. Thus, the only source of infection was the inter-human one, with two routes: transfusional and congenital ones. The dynamics was analysed using the next-generation matrix method. So matrix K was 3 × 3, according to the three stages of infection. We applied those formulae to Buenos Aires city because it is assumed to be free of triatomines and there is available information for the estimation of the parameters. We deduced R 0 = 0·079 < 1. We demonstrated that in a closed human population (without considering immigration of infected individuals), the disease can be sustained by the vertical and horizontal transmissions, even in the absence of the vector, during a long period until its disappearance. The results obtained confirmed the need to consider the three stages of infection in humans and that the chronic indeterminate stage is the one that most influences the dynamics of the disease.
In the current paper instead, we presented and analysed a model for the dynamics of the infection in the endemic rural zone of the Argentine Gran Chaco. The human population was classified in four compartments as in the previous paper, but adding the vectorial route of transmission. We also incorporated the dog population, because in this scenario dogs are the main domestic reservoir of the infection when triatomine insects are present, and of course, the triatomine population, represented in this area by T. infestans. The model was also analysed by the next-generation matrix methodology. In this case, matrix K is 5 × 5. As we considered different populations (humans, triatomines and dogs), we obtained expressions for the T numbers corresponding to the three populations which, in turn, allowed estimating the control effort required to eliminate an infectious disease when control is applied to a specific population. We applied those formulae to the endemic zone of the Argentine Gran Chaco given the strong predominance of T. infestans and the available information for the estimation of parameters. With the inclusion of the vector and the domesticated reservoir in this work, we were able to show that the system generates an R 0 = 5·6773 > 1. This effect would be strongly influenced by the presence of dogs due to their ability to infect vectors during several years, and by the feeding preference of triatomines for dogs.
We think that this work is complementary to our previous one because by using the same methodology, we analysed the dynamics of the disease in two possible scenarios, i.e. with and without the presence of the triatomines. Even though in this work the system is slightly more complex (we used a 5 × 5 matrix), we have been able to verify that the chronic indeterminate stage remains as the stage in humans that most influences the dynamics of the disease, but also that in the presence of triatomines and dogs (or any other highly infectious domestic vertebrate) the latter have a predominant effect on the transmission of T. cruzi.
We agree with other authors (such as Cohen and Gürtler, Reference Cohen and Gürtler2001) on that to reduce the risk of human infection, it is necessary to exclude dogs from bedrooms, remove potential refuges for triatomines from walls and ceilings and the intermittent use of insecticides. Given the social vulnerability of infected people, who are usually asymptomatic, unaware of their status, and consequently untreated, it is necessary to design and implement public health programmes to detect and assess the risk of blood donors and women of child-bearing age by using serological testing and pathogen inactivation procedures.
Finally, the derived expressions can be particularly useful under other scenarios and parameter sets if it is desired to estimate the number of infected individuals generated through the different routes of transmission, by infected triatomines and dogs (or any other highly infected domestic mammal) or by any infected human.
SUPPLEMENTARY MATERIAL
The supplementary material for this article can be found at http://dx.doi.org/10.1017/S0031182016000548
ACKNOWLEDGEMENT
The authors are grateful to the three anonymous referees for their comments and careful reading that contributed to the improvement of this work.
FINANCIAL SUPPORT
This research received no specific grant from any funding agency, commercial or not-for-profit sectors.