The impact of diet on children and adolescent health is widely recognised(Reference Alves and Alves1–Reference de Oliveira, Carioca and Vieira3). Brazilian diet is currently characterised by an increased consumption of ultra-processed foods (UPF) along with a reduced intake of fresh and minimally processed foods(Reference de Castro, dos Anjos and Lacerda2,Reference Louzada, Cruz and Silva4–Reference Oliveira, Ribeiro and Jurema-Santos6) . According to data from the 2019 National Survey of School Health (PeNSE), the percentage of schoolchildren who reported the intake of UPF on the previous day ranges from 16·4 % (flavoured yogurts) to 49·3 % (savoury biscuits)(7).
Monitoring and assessing dietary intake among schoolchildren can contribute to the adoption of healthy eating habits, which tend to persist over time(Reference Dubois, Bédard and Goulet8–Reference Pastorino, Springmann and Backlund10). Dietary intake can be assessed through the identification of dietary patterns, as how much and how often food is consumed and how food is combined are also important for a more comprehensive analysis of the diet(Reference Aguiar, Vasconcelos and Barreiro11).
It has already been shown that the food offered in educational institutions can closely reflect the quality of students’ diets(Reference Boklis-Berer, Rauber and Azeredo12). Therefore, healthier dietary patterns have been associated with the provision of adequate school meals(Reference Boklis-Berer, Rauber and Azeredo12–Reference Froelich, Souza and Andrade15).
Globally, school feeding programmes reach over 400 million children and are found in at least 148 countries(16). School meals, which benefit hundreds of millions of school-age children daily, potentially provide positive outcomes in at least four sectors: education, health and nutrition, social protection, and the local agricultural economy(17).
National school meal policies in many countries provide guidance, for example, on limiting the consumption of highly processed foods or even on the total nutrient and calorie requirements that school meals should meet(18). In general, when free and universal school meals have sound nutritional guidelines, they can benefit student diet quality, especially among those experiencing food insecurity(Reference Cohen, Hecht and McLoughlin19).
Brazil has the National School Feeding Programme (PNAE), a long-standing and relevant public policy that contributes to safeguarding the right to food(Reference dos Santos Lima, Diogo and Peixinho20). The programme, which provides meals to about 40 million schoolchildren attending 145 000 educational institutions across the country, aims to support the development of students by providing meals that meet their nutritional needs during the school period and to encourage healthy eating practices(21,22) . Ensuring that meals comply with legislation is a key tool for public management and health monitoring, and the assessment of the nutritional quality of school menus can help to achieve this goal(Reference Blanquer-Genovart, Manera-Bassols and Salvador-Castell23–Reference Silva, Oliveira and Ribeiro25).
Thus, schools are a favourable environment for interventions and contribute to healthy dietary patterns, both through providing students with food and nutritional education and a reference on dietary habits that promote environmental responsibility and food and nutritional security(Reference de Menezes, e Souza and Cardoso13,Reference Martinez, Gomes and Marini26–Reference Kroth, Geremia and Mussio28) .
In this context, considering that the analysis of school menu patterns has been underexplored in the literature, this study aims to identify the menu patterns planned in Brazilian public schools participating in the PNAE and to analyse the relationship of such patterns with sociodemographic factors and the nutritional quality of the menus.
Methods
Study design and data collection
This is a cross-sectional observational study. The sample consisted of menus from state elementary schools operating part-time, morning or afternoon (administered by the municipal or state government). The menus were planned during the academic years from 2022 to 2024, after the most critical periods of the Covid-19 pandemic(Reference Gurgel, Santos and Alves29,Reference Bicalho and de Mendonca Lima30) , and followed the regulations of the current PNAE Resolution(31). Data on school menus were obtained through random sampling, corresponding to 10 % of the total number of municipalities per Brazilian state(32). The meal plans were collected through telephone or email contact with either the Municipal Department of Education or the dietitian responsible for school meals, as well as through research on official municipal government websites.
We considered weekly menus (Monday through Friday) and selected the first complete week of the monthly menu; some menus offer a small meal, like a snack, and some are a full meal. If there were any missing or inconsistent information, holidays or commemorative dates, we selected the following weekly plan that fulfilled inclusion criteria.
Identification of menu patterns
We used factor analysis (FA) with principal components analysis (PCA) to identify menu patterns. At this stage, foods were categorised into sixteen groups based on nutritional equivalence: (1) cereals and pasta, (2) roots and tubers, (3) legumes, (4) vegetables and greens, (5) fruits, (6) meats and eggs, (7) processed meats, (8) soups and broths, (9) breads, cakes and biscuits, (10) butter and margarine, (11) milk and dairy products, (12) powdered chocolate drinks, (13) fruit juice (fresh or frozen fruit, not from concentrate), (14) industrialised sugar-sweetened beverages, (15) coffee and teas, and (16) sweets, porridge and desserts. The weekly frequency of the foods included in the meals was used for FA, thus allowing the analysis of the patterns present in the menus. Online Supplementary Table S1 presents the weekly frequency distribution of the sixteen food groups in the menus weekly frequency distribution of the sixteen food groups in the menus.
For culinary preparations, if a recipe was included on the menu, its specific ingredients were considered. However, when the menu did not include a recipe, the preparation was standardised based on the most frequently used version across the menus.
FA was preceded by a data adequacy analysis using the Kaiser–Meyer–Olkin (KMO) test. Values above 0·50 were considered acceptable for FA to proceed, as established by Kaiser (1974)(Reference Kaiser33) on FA principles. Correlations between variables were assessed using Bartlett’s test of sphericity (P < 0·05)(Reference Johnson and Wichern34).
Cattell’s scree plot test criteria were applied to determine the number of factors to retain (online Supplementary Figure S1). The maximum number of factors to retain is suggested based on the inflection point of the curve. Next, the factor matrix was subjected to Varimax orthogonal rotation, and groupings with factor loadings (FL) equal to or greater than 0·30 in the resulting matrix were considered(Reference Johnson and Wichern34).
Kruskal–Wallis test and Wilcoxon post hoc test with Bonferroni correction were used to investigate differences between menu patterns and sociodemographic data, as well as the nutritional quality of the menus.
Sociodemographic variables and nutritional quality of the menus
The following sociodemographic variables related to the municipalities were considered: geographical region, population size, Municipal Human Development Index (MHDI) and the Social Vulnerability Index (SVI), as published by the Brazilian Institute of Geography and Statistics (IBGE)(32) and the Institute of Applied Economic Research (IPEA)(35).
To assess the nutritional quality of the menus, data were organised in a Microsoft Excel® spreadsheet and the Revised School Meal Menu Quality Index (IQCAE-R) was calculated. IQCAE-R considers one meal per day over a full week (Monday to Friday) to determine a final score based on the daily and weekly frequency of food items and acknowledges aspects related to healthiness and sustainability of the diet. The criteria used in the IQCAE-R have been published(Reference Camargo, Paula and de Souza36); briefly, the IQCAE-R has fourteen components, organised into two dimensions: ‘Healthy Eating-HE’ and ‘Sustainability-S’. Seven components score positively on the first dimension (HE), two score negatively and one is conditional. In the Sustainability dimension (S), two components generate either positive or negative scores.
Data analysis
Data analysis was carried out with R® software (version 4.3.1). Differences were considered statistically significant at the level of P < 0·05.
Results
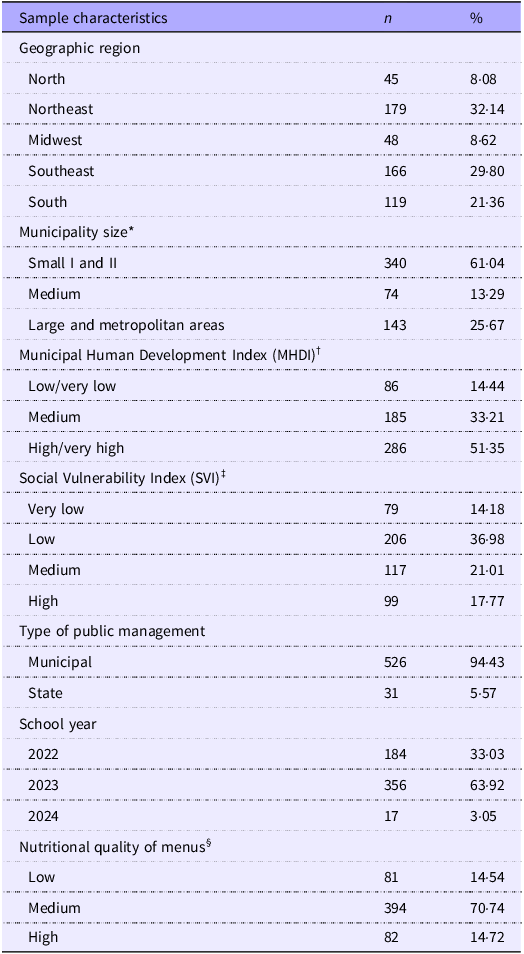
The sample comprised 557 five-day weekly menus from primary education schools in different Brazilian municipalities. Of these menus, 73·3 % consisted primarily of large meals, while 26·7 % consisted of small meals. Most menus correspond to the 2023 academic year (63·91 %), and 70·74 % were classified as having average nutritional quality. Table 1 presents the descriptive analysis of the studied sample.
Descriptive analysis of school menus (n 557). Brazil, 2024

*Municipality size based on the number of inhabitants: small I and II (up to 50 000 inhabitants), medium (50 000–100 000), large cities and metropolitan areas (over 100 000).
†MHDI: very low/low (0–0·599), medium (0·600 a 0·699) and high/very high (0·700–1).
‡SVI: very low (0–0·200), low (0·201–0·300), medium (0·301–0·400), high (0·401–0·500) and very high (0·501–1).
§Nutritional Quality of Menus according to IQCAE-R: low (0–30 points), medium (> 30–60 points) and high (> 60–100 points).
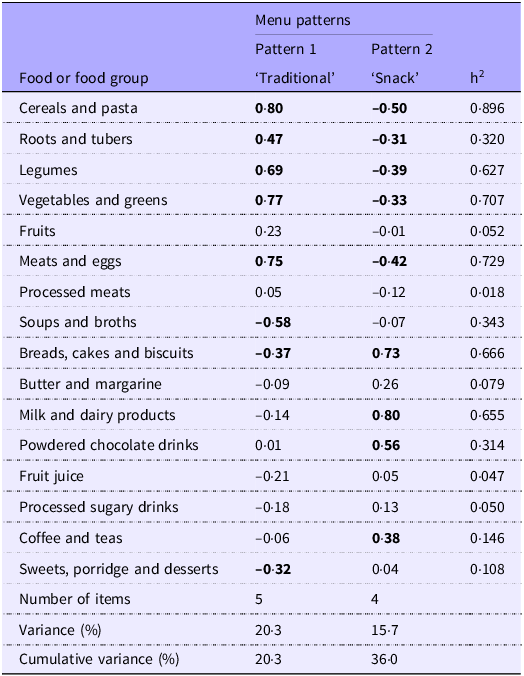
The adequacy of the FA model was confirmed (KMO = 0·76) with significant correlations between the variables (P < 0·001). Two factors (patterns) were identified as appropriate for the analysis: ‘Traditional’ and ‘Snack’. FL for the food groups are presented in Table 2.
Distribution of factor loadings according to each pattern of Brazilian school menus. Brazil, 2024

h2 = communality. Factors loadings ≥ 3.0 or ≤ –0.3 were highlighted to facilitate the identification of the foods comprising the dietary patterns observed.
The identified menu patterns were named according to their composition and in line with terminologies adopted in other studies. The ‘Traditional’ pattern explained most of the variance (20·3 %) and consisted of cereals and pasta (0·80), roots and tubers (0·47), legumes (0·69), vegetables and greens (0·77), and meats and eggs (0·75). Negative FL were observed for soups and broths (–0·58), breads, cakes and biscuits (–0·37), and sweets, porridge and desserts (–0·32) in this pattern. The ‘Snack’ pattern represented 15·7 % of the variance and was characterised by breads, cakes, and biscuits (0·73), milk and dairy products (0·80), powdered chocolate drinks (0·56), and coffee and teas (0·38), with negative FL for the items in the ‘Traditional’ pattern. The two patterns together explained 36 % of the variance in data.
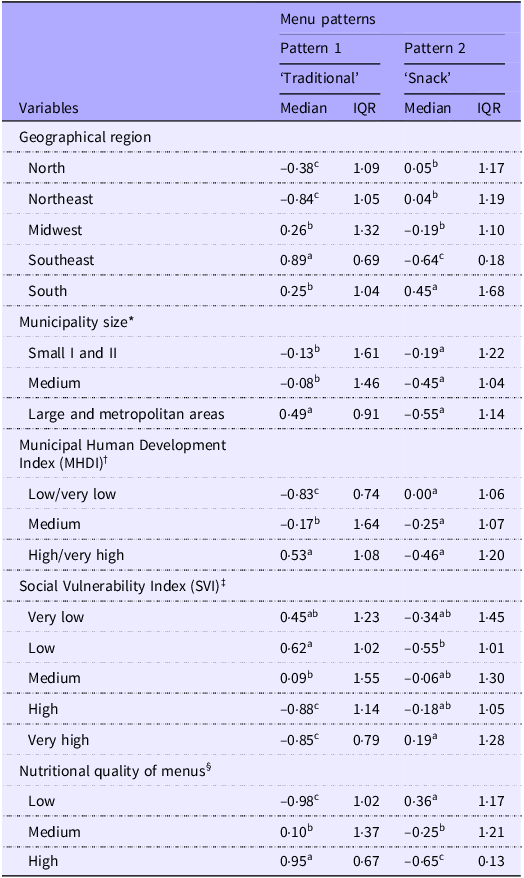
Table 3 presents the median factor score for the menu patterns and the differences according to sociodemographic variables and nutritional quality of the menus.
Median factor scores for the menu patterns according to sociodemographic variables and the nutritional quality of the menus. Brazil, 2024

IQR, Interquartile range.
*Municipality size based on the number of inhabitants: small I and II (up to 50 000 inhabitants), medium (50 000–100 000), large and metropolitan areas (over 100 000).
†MHDI: very low/low (0–0·599), medium (0·600 a 0·699) and high/very high (0·700–1).
‡SVI: very low (0–0·200), low (0·201–0·300), medium (0·301–0·400), high (0·401–0·500) and very high (0·501–1).
§Nutritional Quality of Menus according to IQCAE-R: low (0–30 points), medium (> 30–60 points) and high (> 60–100 points).
Different letters within the same column indicate statistical significance (P < 0·05) according to Wilcoxon post hoc test with Bonferroni correction.
There were significant differences between median factor scores across Brazilian regions. Regarding the ‘Traditional’ pattern, Midwest and South median scores were similar, as well as North and Northeast scores. The latter had the lowest values. The highest value was found in the Southeast, and it was statistically different from all other region scores. As for the ‘Snack’ pattern, the South region had the highest median score, while the Southeast had the lowest; North, Midwest and Northeast median scores were intermediate and not statistically different.
Large cities and metropolitan areas, as well as cities with higher MHDI, showed higher medians for the ‘Traditional’ pattern. There were no differences between the municipality size and MHDI for the ‘Snack’ pattern. Regarding the SVI categories, higher medians were associated with better strata for the ‘Traditional’ pattern, while the ‘Snack’ pattern showed the opposite performance. Regarding nutritional quality of the menus, statistically significant differences were found between all categories for both patterns, with a higher median for the ‘Traditional’ pattern among menus with higher nutritional quality. Conversely, the ‘Snack’ pattern showed a lower median within this category and a higher median among lower-quality menus.
Discussion
In this study, we identified two patterns of Brazilian school menus: ‘Traditional’ and ‘Snack’. The relationship between these patterns and sociodemographic variables related to the municipalities as well as the nutritional quality of the menus were investigated.
The ‘Traditional’ pattern explained the largest percentage of variance and was characterised by food items commonly found in the Brazilian dietary culture. This pattern is consistent with recommendations of the Brazilian Dietary Guidelines (BDG)(37) and PNAE legislation(31), which aim to increase the consumption of fresh and minimally processed foods and to reduce the intake of sweets and UPF.
This pattern was shown to have a direct relationship with the nutritional quality of menus. The presence of natural, fresh and minimally processed foods explains its association with higher-quality menus. These food groups are key components of a healthy diet, as they improve nutrient intake, prevent nutritional deficiencies and promote sustainable diets(37,38) .
The PNAE provides guidelines for the development of school menus and, according to the resolution in force at the time the menus were drawn up, recommended that at least 75 % of federal resources be allocated to the purchase of fresh or minimally processed foods, while discouraging the acquisition of ultra-processed products(31). Updates to the programme’s resolution have further prioritised the procurement of fresh foods, establishing a minimum of 80 % in 2025 and 85 % from 2026 onwards and recommending against the purchase of products with front-of-pack nutrition labels that indicate high levels of critical nutrients(39).
Furthermore, the ‘Traditional’ pattern showed differences according to sociodemographic variables, with higher FL among municipalities in the Southeast region, larger cities and those with higher human development and lower social vulnerability. Regarding regional differences in menu quality, Souza and Castro (2020)(Reference de Souza and de Freitas Castro40) have found higher average weekly frequencies of vegetables in the Midwest, Southeast and South of Brazil. On the other hand, UPF availability was higher in the Midwest and Southeast of the country. Nevertheless, Souza and Castro (2020)(Reference de Souza and de Freitas Castro40) have evaluated menus from early childhood education institutions. It is worth noting that PNAE legislation is more stringent for nurseries, as the provision of UPF for children under the age of 3 years is prohibited(31).
The composition of the ‘Traditional’ pattern is consistent with other findings on dietary patterns of children and adolescents(Reference Massarani, Cunha and Muraro41–Reference Santos44). However, research has shown that in addition to cereals and pasta, roots and tubers, legumes, vegetables and meats, the ‘Traditional’ pattern also includes processed and cured meats(Reference Pinho, Silveira and Botelho45,Reference dos Santos Vieira, Castro and Fisberg46) or artificial juice(Reference Pinho, Silveira and Botelho45). The quality of school meals is associated with better overall eating patterns among children and adolescents, as demonstrated both in Brazil(Reference Boklis-Berer, Rauber and Azeredo12,Reference Froelich, Souza and Andrade15) and abroad(Reference Grigsby-Duffy, Brooks and Boelsen-Robinson47). The identification of school menu patterns in Brazil, however, is unprecedented and offers a new investigative strategy for research and monitoring of this important public policy.
The other pattern identified in this study was named ‘Snack’ as it showed high FL for breads, cakes and biscuits, milk and dairy products, powdered chocolate drinks, and coffee and teas. This can be explained by the presence of sweets and highly processed foods, characterised by high energy density and high sugar and trans fat levels(Reference da Costa Louzada, Ricardo and Steele48,Reference Martini, Godos and Bonaccio49) . Although it is recommended that a maximum of 20 % of federal resources be allocated to the purchase of processed and UPF(31), these foods are still very present in school menus. It is important to note that a new resolution has been issued, establishing a stricter limit of 15 % in 2025 and further reducing it to 10 % from 2026 onwards(39).
These results are supported by the study of Alvarez and Slater (2019)(Reference Alvarez and Slater50), who reported a significant availability of UPF in snack-type meals in municipalities in the state of São Paulo. These UPF included mainly breads, biscuits, processed meats, sugar-added juice from concentrate and jelly. Similarly, Martinelli et al. (2014)(Reference Martinelli, Soares and Fabri51) have found that in school menus from municipalities in southern Brazil foods offered in snacks were mainly processed meats, sweet biscuits and chocolate drinks, which have low nutritional value.
According to the literature, snack-type meals consumed by children and adolescents usually have an unhealthy profile, despite variations in their naming (‘snack’, ‘junk food’, ‘traditional snack’ and ‘monotonous’) and composition, which can include processed meats, juice, butter and margarine, or fruits(Reference Massarani, Cunha and Muraro41–Reference Neta, Steluti and Ferreira43,Reference Pinho, Silveira and Botelho45,Reference dos Santos Vieira, Castro and Fisberg46) .
One of the main factors influencing the consumption of school meals are socio-economic determinants(Reference Valentim, Almeida and Taconeli52,Reference Cesar, Valentim and Almeida53) , as demonstrated by Cesar et al. (2020)(Reference Cesar, Taconeli and Osório54) and Viana et al. (2025)(Reference Viana, Linhares and Mintem55), in studies carried out with students from public schools in the southern region of Brazil, where the greatest adherence to school meals occurred among students with lower incomes. Similarly, Horta et al. (2019)(Reference Horta, do Carmo and Junior56) studied school meal consumption and social vulnerability risk among children living in a large Brazilian city. They have found that students living in high/very high social vulnerability risk areas consumed school meals more frequently than those living in areas at low/medium social vulnerability risk. Moreover, these findings highlight the role of PNAE in correcting and preventing dietary inadequacies related to social inequalities, as adherence to school meals is associated with better diet quality(Reference Horta, do Carmo and Junior56).
In our study, the ‘Snack’ pattern – mainly composed of sweets and highly processed foods – showed higher FL in municipalities with ‘very high’ SVI. Furthermore, results of the study carried out by Barde, Nogueira Bezerra and Sichieri (2025)(Reference Barde, Bezerra and Sichieri57) revealed that in the last decade, young Brazilians have observed a reduction in the nutritional quality of their diet, with an increase in the consumption of fast food, especially among male adolescents and those with lower family income, and a reduction in the consumption of traditional foods of the Brazilian population, such as rice.
These findings underscore the importance of improving local strategies to enhance the nutritional quality of menus offered to students, especially in municipalities with high SVI, as they are often the main consumers of school meals(Reference Horta, do Carmo and Junior56). Higher FL for the ‘Snack’ pattern were also observed in the South region, in smaller municipalities and those with poorer development indicators.
Another important finding of this study is that fruits did not reach sufficient FL to explain the pattern in school menus. This result is consistent with research on the dietary patterns of children and adolescents(Reference Massarani, Cunha and Muraro41–Reference Neta, Steluti and Ferreira43) and reflects the low frequency that this food group is offered. Regular provision of fruits is fundamental for developing healthy eating practices(39), and PNAE legislation(31) determines they are made available for students at least twice a week.
A relevant factor that can influence the composition of school menus is the role of nutritionists in the programme. According to a recent study by Medeiros et al. (2025)(Reference Medeiros, Alves and Florintino58), despite the growing number of professionals over the years, it was found that the number of nutritionists linked to the PNAE is still insufficient, which can compromise the quality and scope of nutritional interventions in the programme(Reference Medeiros, Alves and Florintino58).
This study presents the limitation of having its database established from the collaboration of dietitians who agreed to send their menu plans, as there is no registration system for school menus that allows for PNAE monitoring. This may have introduced a positive selection bias in the study. On the other hand, this study stands out for its pioneering approach, as it is one of the few that investigate school menu patterns, thus offering a broad perspective on the meals planned for students targeted by PNAE and examining differences in sociodemographic data and nutritional quality of menus.
Conclusion
By using FA to investigate Brazilian school menus, we identified two menu patterns: ‘Traditional’ and ‘Snack’. The study of the relationships between these patterns and sociodemographic variables and menu nutritional quality has revealed that the ‘Traditional’ pattern is more common in larger municipalities with lower vulnerability risk. This result highlights the need for additional strategies aimed at vulnerable municipalities, particularly smaller ones with poorer development indicators. Stimulating schools to provide meals that resemble the ‘Traditional’ pattern could help municipal governments to promote benchmarks that encourage schoolchildren to adopt healthier dietary patterns, therefore benefiting and strengthening health promotion through PNAE.
Supplementary material
For supplementary material/s referred to in this article, please visit https://doi.org/10.1017/S0007114525105928.
Acknowledgements
The authors would like to thank the team at the Experimental Dietetics Laboratory (LADEx/Unifesp) for their assistance in carrying out the research; the dietitians and Municipal Education Departments for the information needed to assemble the study database; and the Coordination for the Improvement of Higher Education Personnel (CAPES) – Brazil, for granting a scholarship to I. P. Martins.
For minor adjustments, ChatGPT was used in the language alignment process.
This study was funded by the Coordination for the Improvement of Higher Education Personnel (CAPES) – Brazil – Financing Code 001.
The authors’ contributions are as follows: I. P. M. contributed to the study’s conception, data analysis and writing. R. G. M. C. contributed to the study’s conception, data analysis and writing. E. M. S. R. contributed to the study’s conception, data analysis and review. S. M. A. D. contributed to the study’s conception, data analysis, writing and review. All authors have read and approved the final version of this manuscript.
The authors declare that they have no conflicts of interest to declare.
This study was approved by the Research Ethics Committee of the Federal University of São Paulo (CEP/Unifesp), São Paulo Campus, under the registry number 71239723.90000.5505.