
I. INTRODUCTION
Austenite stainless steel is widely used as the structural material in many fields for its outstanding mechanical and corrosion properties. Reference Lu, Chen, Luo, Patchett and Xu1–Reference Cardoso and Vieira4 Welding is extensively selected to connect these structural materials, and then the microstructure variation exists in the weld joint. Reference Mary, Vignal, Oltra and Coudreuse5–Reference Cui, Lundin and Hariharan7 It is believed that the microstructure discrepancy results in different local corrosion behavior such as pitting corrosion and intergranular corrosion and stress corrosion cracking during service. Reference Mudali and Dayal8–Reference Nishimoto and Ogawa10
According to the previous works, Reference Lu, Chen, Luo, Patchett and Xu1,Reference Dadfar, Fathi, Karimzadeh, Dadfar and Saatchi11 the weld joint is mainly composed of weld zone (WZ), heat-affected zone (HAZ), and base metal (BM). Normally, it is accepted that WZ possesses a duplex structure including ferrite and austenite phases and the ferrite in the WZ reduces the hot cracking susceptible of the weld joint, Reference Lu, Chen, Luo, Patchett and Xu1,Reference Cui, Lundin and Hariharan7,Reference Dadfar, Fathi, Karimzadeh, Dadfar and Saatchi11 while Kwok also found that the presence of ferrite in laser-welded s30400 stainless steel joint contributed to a decrease in pitting corrosion resistance. Reference Kwok, Fong, Cheng and Man2 The HAZ, caused by thermal cycle during welding process, exhibits to be more susceptible to pitting corrosion compared with BM. Reference Lu, Chen, Luo, Patchett and Xu1,Reference Dadfar, Fathi, Karimzadeh, Dadfar and Saatchi11,Reference Garcia, Martin, Tiedra, Blanco and Lopez12 Second phase precipitation, recrystallization, and residual stress are proposed as the accelerating factors for pitting corrosion resistance degradation of HAZ, Reference Kim, Hong and Oh3,Reference Dadfar, Fathi, Karimzadeh, Dadfar and Saatchi11,Reference Garcia, Martin, Tiedra, Blanco and Lopez12 and it is reported that HAZ is the most sensitive zone for pitting corrosion. Reference Garcia, Martin, Tiedra, Blanco and Lopez12 However, Lu found that WZ had a lower breakdown pitting potential than HAZ under gas tungsten arc welding process, confirming the existence of pitting corrosion performance discrepancy of WZ under different welding methods and conditions. Reference Lu, Chen, Luo, Patchett and Xu1 For tungsten inert gas welding (TIG) process, microstructure and mechanical properties evolution of weld joint have been reported widely, Reference Durgutlu13–Reference Pascual, Salas, Carcel and Perales16 however the corrosion behavior of each region in the weld joint is drawn less attention Reference Nishimoto and Ogawa10 and the relevant factors are not clear, more detailed investigation is needed.
The objective of this work is to investigate the microstructure and pitting corrosion behavior of the different regions (BM, HAZ, and WZ) in the 316L stainless steel weld joint performed by TIG process. Optical microscope (OM) and electron backscatter diffraction (EBSD) are used to observe the microstructure of each region in the weld joint. Pitting corrosion resistance of the different regions in the weld joint is evaluated by pitting corrosion test in 6% FeCl3 solution and potentiodynamic polarization test.
II. MATERIALS AND METHODS
A. Materials and welding methods
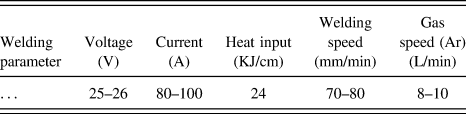
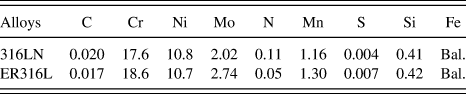
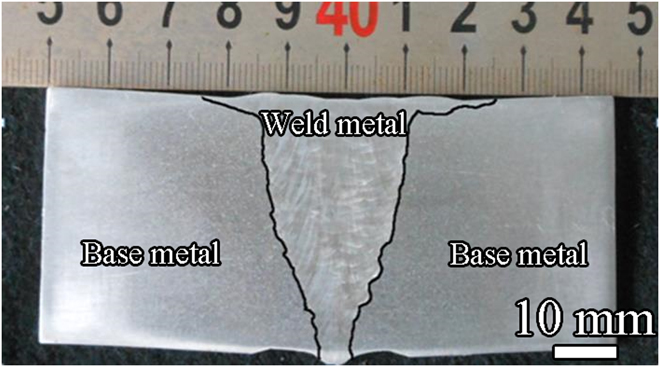
The base and filled metals used in our present study were 316LN casting stainless steel and 316L stainless steel welding wires, respectively. Welding groove with an angel of 70° was performed by TIG to obtained the multiple welding passes, the corresponding welding parameters are listed in Table I. Figure 1 shows the transverse sectional morphology of the weld joint, and the chemical compositions of base and weld metals are listed in Table II.
Welding parameters of TIG process.

Macroscopic morphology of 316L stainless steel weld joint.
Chemical compositions of weld and BMs (wt%).

B. Microstructure
The samples with a size of 10 × 10 × 2 mm, cut from different regions of the weld joint, were mechanically ground to 2000# grit on SiC papers and then polished using a 2.5 μm diamond paste. Optical microscope (OM; Olympus Corporation, Tokyo, Japan) was used to observe the microstructure after etching by the solution (1 g Na2S2O5, 3 g FeCl3, 50 mL HCL and 50 mL pure water). The orientation information of the different regions in the weld joint was examined by EBSD (JEOL Ltd., Tokyo, Japan) with a step size of 3 μm, and the corresponding data were analyzed by TexSEM Laboratories (TSL, EDAX, Provo, Utah) software.
C. Pitting corrosion tests
The pitting susceptibility of the weld joint was evaluated by using the 6% FeCl3 solution according to ASTM G48-03. The samples with a size of 35 × 20 × 3 mm, cut from the middle part of weld joint, were mechanically abraded with emery papers up to #2000 step by step, mechanical polishing and subsequently cleaned with ethanol, and then, were tested in the water bath with a temperature of 50 ± 1 °C for 24 h. After the immersion test, the oxide film formed on the samples was removed by acid washing and the samples were subsequently cleaned with pure water.
Pitting corrosion resistance of the different regions in the weld joint was investigated by potentiodynamic polarization test in 3.5 wt% NaCl solution at room temperature. The 10 × 10 × 2 mm samples were embedded in epoxy resin leaving an exposed area of 1 cm2 used as working electrode surface. These working electrode surfaces were then mechanically ground to 2000# grit on SiC papers, followed by polished using a 2.5 mm diamond paste and then cleaned with pure water. The pure nitrogen gas (N2) was purged into the test solution for 30 min before the electrochemical test and continued to purge into the solution during the test. Before the test, the solution stabilized at open circuit potential (OCP) for 30 min and potentiodynamic scan started from −200 mV versus ocp with a scan rate of 0.3333 mV/s until the current density increased to 1 mA/cm2. Pitting potential (E pit) was defined as the potential at which current density began to increase continuously. Reference Ha, Jang, Lee and Moon17–Reference Xu, Zhang, Cheng and Zhu19 At least five repeated potentiodynamic tests for each region were carried out to confirm the reproducibility.
After the pitting tests, the pitting morphologies of the samples were observed by scanning electron microscope (JEOL Ltd., Tokyo, Japan) equipped with energy dispersive spectroscopy.
III. RESULTS
A. OM observation and XRD analysis
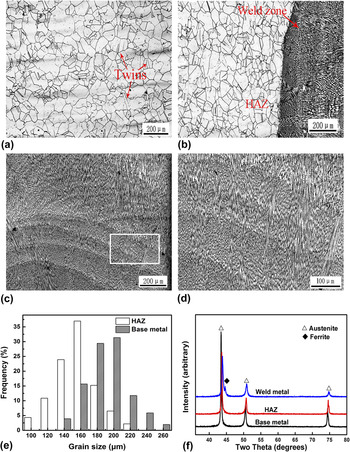
Figures 2(a) and 2(b) show the optical morphologies of BM and fusion region, respectively. BM mainly contains austenite grains and the twins are clearly observed in some grains as shown in Fig. 2(a). By comparison, a dendrite structure is observed along the direction of maximum heat flow in the fusion boundary, and HAZ contains austenite grains with different sizes as shown in Fig. 2(b).
Optical morphologies of (a) BM, (b) fusion region and (c) WZ, (d) the corresponding magnified image of the white framed region indicated in (a), (e) grain size distribution of HAZ and BM, and (f) XRD patterns of the different regions in the weld joint.

The optical observation in Fig. 2(c) shows that the WZ has obvious dendrite structure and a few planar dendrite crystals distributed through the bonding zone between each welding bead, which is called “flat interface growth mode”. Reference Li, Li, Liu, Pei and Sun20 Fig. 2(d) shows the higher magnified micrograph of the white framed region indicated in (c). It is found that the fine dendrite crystals are distributed along the direction of the heat flow, indicating that the preferred orientation occurs in WZ during the solidification process of the weld pool.
Figure 2(e) shows the grain size distribution of HAZ and BM. It is apparent that grain size of HAZ is smaller that that of BM, which indicates that grains refinement in HAZ occurs during the welding process. The corresponding XRD patterns of the different regions in the weld joint as shown in Fig. 2(f) indicate that only austenite phase exists in the BM and HAZ, while WZ shows a duplex structure including ferrite and austenite phases, which is consistent with the microstructure observation indicated in Figs. 2(a)–2(d).
B. EBSD analyses
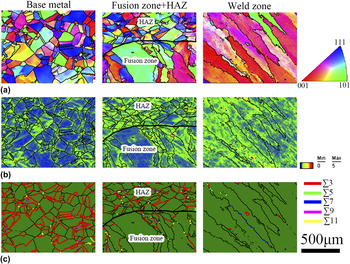
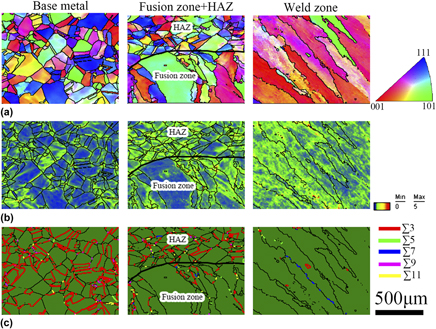
Figures 3(a)–3(c) show inverse pole figure (IPF), local orientations mismatch, and coincidence site lattice (CSL) model boundary images of the different regions in the weld joint, respectively. From Fig. 3(a), it can be seen that grains with random orientation are distributed in the BM and HAZ, while the dendrites of WZ shows the almost same crystal orientation.
(a) Inverse pole figure (IPF), (b) local orientations mismatch and (c) typical CSL model boundary images of the different regions in the weld joint.

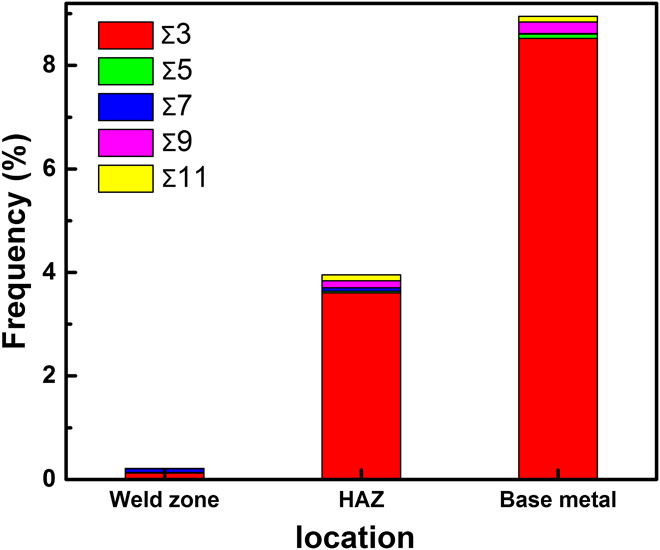
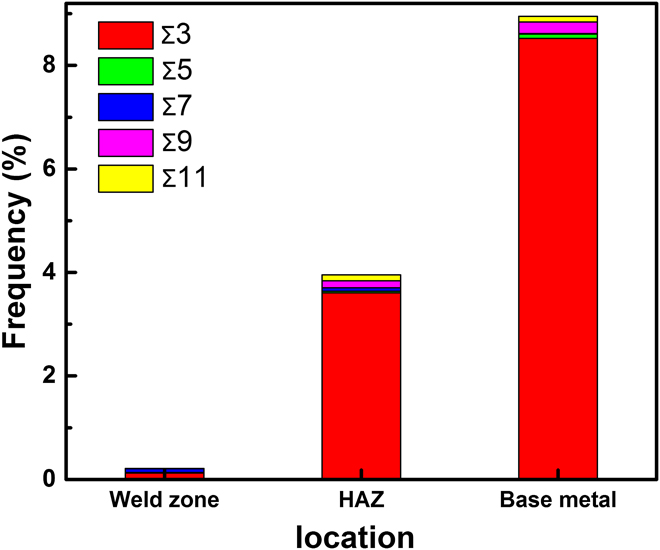
Local orientations mismatch is used to estimate the residual strain following a rainbow color code and the color from blue to red which represents minimal to maximal residual strain. Reference Ming, Zhang, Wang, Han and Ke21 The local orientations mismatch images of the different regions in the weld joint as shown in Fig. 3(b) indicate that large grains with a low local orientations mismatch are observed in BM. By comparison, high local orientations mismatch exists in the dendrites of WZ and fine grains of HAZ, indicating that WZ and HAZ have a higher residual strain than BM. The corresponding CSL model boundary images of each region in the weld joint [Fig. 3(c)] show that BM mainly contains Σ3 boundary, indicating that annealing twin can easily form in BM. Compared with BM, it is found that a few low CSL (Σ3, Σ5, and Σ7) boundaries are observed in HAZ. Moreover, high-angle boundaries are inclined to form in the dendritic structure of WZ during the welding process. The corresponding statistics results on Σ values of the different regions in the weld joint as shown in Fig. 4 suggest that low Σ CSL boundaries mainly exist in HAZ and BM and more Σ3 boundary are observed in BM than that in HAZ.
Statistics results on Σ values of BM, HAZ and WZ.
C. Pitting corrosion in ferric chloride solution
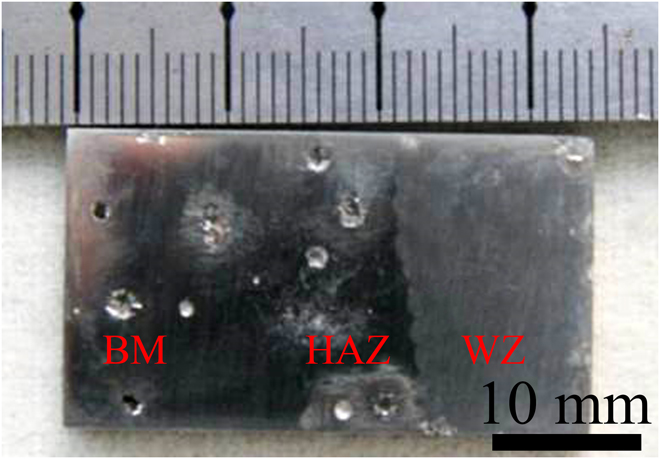
Figure 5 shows macroscopic morphology of the weld joint after the pitting corrosion test in 6% FeCl3 solution. As shown in Fig. 5, the millimeter-scale pits are observed in HAZ and BM, while no obvious pitting occurs in WZ, which indicates that WZ exhibits a higher pitting corrosion resistance than HAZ and BM during the immersion test.
Macroscopic morphology of the weld joint after the pitting corrosion test in 6% FeCl3 solution.

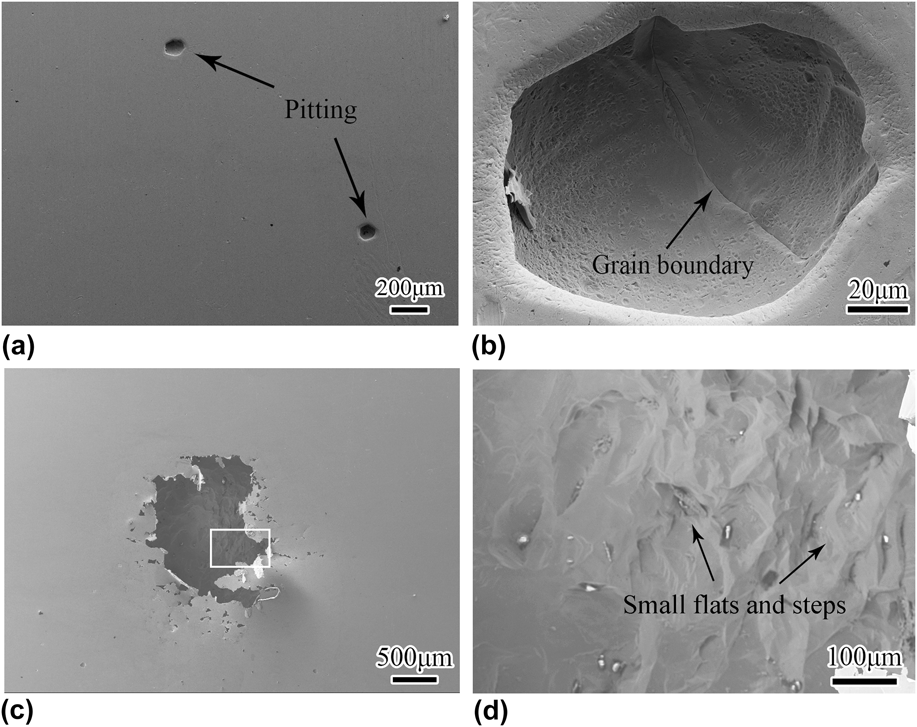
Figures 6(a) and 6(b) show the typical pitting morphology in BM. From Fig. 6(a), it can be seen that some pits with a diameter of about 100 μm formed in the BM. The magnified morphology of the pitting in BM as shown in Fig. 6(b) reveals that the elliptical pit exhibits a smooth inner wall and no obvious pit cover or corrosion product is observed; moreover, it is noticed that a grain boundary is observed in the center of the pitting, indicating that the grain boundary is the preferable site for the pitting corrosion, which is in accordance with the previous work. Reference Ha, Jang and Lee22 Figure 6(c) shows the typical pitting morphology in HAZ. The pitting with perforated lacy covers, the typical shape of the pitting as reported, Reference Dadfar, Fathi, Karimzadeh, Dadfar and Saatchi11,Reference Garcia, Martin, Tiedra, Blanco and Lopez12,Reference Ha, Jang and Lee22 is observed, and the size of which is approximately 500 μm. Figure 6(d) shows the corresponding magnified morphology of the white framed region indicated in (a). Existence of a nonsmooth inner wall with small flats and steps as shown in Fig. 6(b) indicates that the pitting is still in growth stage.
Typical pitting morphology in (a) BM and (c) HAZ, (b) and (d) the corresponding magnified morphology of the white framed regions indicated in (a) and (c), respectively.
D. Potentiodynamic test results
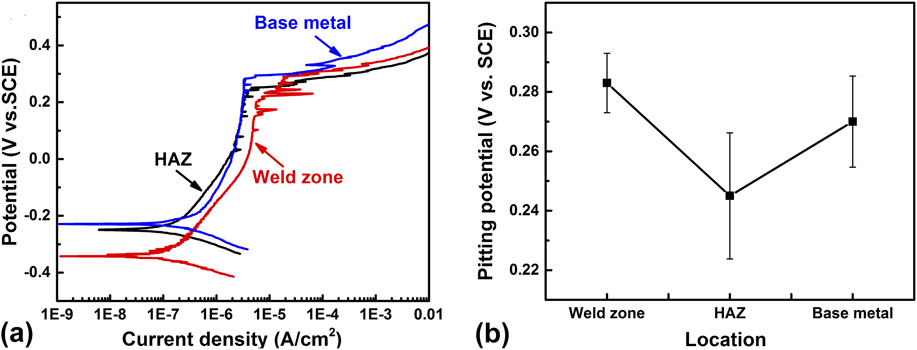
Figures 7(a) and 7(b) display potentiodynamic polarization curves and the corresponding E pit values of the different regions in 3.5 wt% NaCl solution. As shown in Fig. 7(a), WZ exhibits lower corrosion potential and higher passivation current density than BM and HAZ, indicating lower corrosion resistance of WZ than that of HAZ and BM. However, the pitting potential values as shown in Fig. 7(b) indicate that HAZ shows a higher pitting corrosion susceptible than WZ and BM, while not much difference in pitting potential is observed between WZ and BM.
(a) Potentiodynamic polarization cures of the different regions in 3.5 wt% NaCl solution and (b) pitting corrosion potential of the different regions in the weld joint.

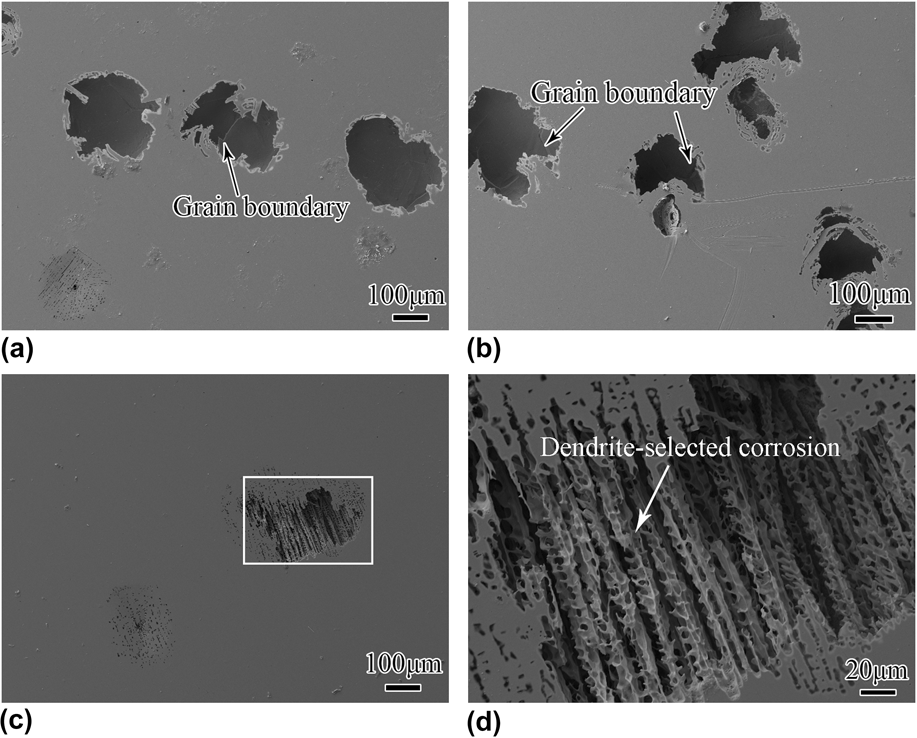
Figures 8(a) and 8(b) show the typical pitting morphologies of BM and HAZ in the weld joint, respectively. A few pits with a size of about 100 μm are distributed in BM, wherein the grain boundary is clearly observed as shown in Fig. 8(a). Similar results have been also observed in HAZ as shown in Fig. 8(b), confirming that the grain boundary is sensitive to pitting corrosion in HAZ and BM. However, it is worthy of noticing that a few pits in HAZ are composed of some small pits and the perforated lacy covers are clearly observed on the surface of the contact region among two pits, indicating that more pitting nucleation occurs in HAZ and these pits are still in the growth stage. The typical pitting morphology of WZ is shown in Fig. 8(c). As shown in Fig. 8(c), it is obvious that less pitting is found in WZ than that in HAZ and BM [Figs. 8(a) and 8(b)]. In addition, the dendrite structure is clearly observed in the pitting and the corresponding magnified image as shown in Fig. 8(d) indicates that austenite and ferrite phases exhibit the different corrosion performance.
Typical pitting morphologies of (a) BM, (b) HAZ, and (c) WZ and (d) the corresponding magnified image of the white framed region indicated in (c).

IV. DISCUSSION
A. Microstructure variation in the weld joint
According to some previous works, Reference Sabooni, Karimzadeh, Enayati, Ngan and Jabbari23–Reference Takalo, Suutala and Moisio26 the solidification mode of austenite stainless steel could be predicted by Schaeffler equation (Nieq/Creq, where the Creq = Cr% + Mo% + 1.5 Si% + 0.5 Nb% and the Nieq = Ni% + 30 C% + 30 N% + 0.5 Mn%). Reference Takalo, Suutala and Moisio26 From Table I, Creq/Nieq of 316L stainless steel in our study was 1.64, which indicated the formation of FA mode during solidification. The FA mode began with primarily ferrite, and uncompleted δ–γ phase transformation occurred during the solidification of the welding pool, Reference Li, Li, Liu, Pei and Sun20,Reference Takalo, Suutala and Moisio26 which resulted in the formation of the retained ferrite in the WZ, as shown in Fig. 2.
It was reported that grain morphology transformation was determined by the temperature gradient (G) and grain growth rate (R) mainly. Reference Li, Li, Liu, Pei and Sun20 At the beginning of welding, the bottom of welding pool exhibited the maximum of G and the minimum of R, Reference Li, Li, Liu, Pei and Sun20 indicating the formation of a few planar crystals and cell dendrites in the bottom of WZ. However, with the welding process continued, the grain morphology transformed into columnar dendrites along the radiating direction due to the decrease of G. Therefore, it was concluded that WZ was composed of columnar dendrites mainly [Figs. 2(a) and 2(b)] since the solidification rate from bottom to surface was faster. Reference Takalo, Suutala and Moisio26 In addition, these formed columnar dendrites during the rapid solidification process were believed to induce high-angle boundaries formation [Fig. 3(a)] and high local orientation mismatch [Fig. 3(b)] due to the high residual stress existed in the WZ.
It was widely accepted that a high heat input induced the formation of HAZ during the welding process, Reference Silva, Miranda, Sant’Ana and Farias24,Reference Abe and Watanabe25,Reference Zhu, Deng, Wang, Yang, Ding and Wang27 as shown in Fig. 2(c). Since the short-term high temperature heat treatment in this area was just sufficient to recrystallize the BM, Reference Zhu, Deng, Wang, Yang, Ding and Wang27 confirming the grain refinement in HAZ [Fig. 2(e)]. It was noticed that the reduction of the twin boundary number was observed in HAZ compared with BM, as shown in Fig. 4, indicating that recrystallization occurred in HAZ during welding process, which destroyed the twin boundary as shown in Fig. 2. Baudin owed this destruction to grain size reduction and increasing strain, Reference Baudin, Etter and Penelle28 while grain growth velocity during recrystallization regime was proposed by Jin as the main factor for this destruction. Reference Jin, Lin, Bernacki, Rohrer, Rollett and Bozzolo29 For HAZ in our study, firstly, low-grain growth velocity reduced the migration of moving boundaries and twin boundary propagation, Reference Jin, Lin, Bernacki, Rohrer, Rollett and Bozzolo29 resulting in less creation of twin boundary. Secondly, more grain boundaries, created by recrystallization process, decreased the relative volume fraction of twin boundary. Both the ways accounted for a reduction in frequency of twin boundary as shown in Figs. 3 and 4. The microstructure discrepancy among the different regions of weld joint indicated that the each region of weld joint exhibited different corrosion performances.
B. Pitting corrosion behavior among the different regions
Apparently, WZ, which consisted of ferrite and austenite phases, exhibited a different corrosion behavior compared with HAZ and BM (Figs. 5 and 7), revealing that the preferential corrosion occurred in WZ during pitting test. As indicated before, the rapid solidification and uncompleted δ–γ phase transformation occurred during the welding process, and then the micro-segregation existed in cellular dendritic structure in WZ, resulting in the formation of Cr-depleted zone in the dendrite boundaries. Since Cr element was essential for passive film formation and Ni was effective in promoting the passivation, Reference Cui, Lundin and Hariharan7 it was believed that preferential corrosion occurred in Cr-depleted zone, confirming the dendrite-selected corrosion in WZ, as shown in Figs. 8(c) and 8(d). In addition, due to potential discrepancy between ferrite and austenite phases, it is reported that galvanic corrosion occurred where there is the intimate contact of the two phases. Reference Tsai and Chen30 The existence of galvanic corrosion was believed to decrease the corrosion resistance of WZ, and then, low corrosion potential and large current density of WZ were observed in Fig. 7(a). However, based on the pitting results as shown in Fig. 7, there is not much difference in pitting potential value between WZ and BM, revealing that different microstructures have small variation in pitting potentials.
For HAZ and BM, grain boundaries were prone to corrosion compared with gain matrix since impurity segregation frequently occurred in gain boundaries for the full-austenite structure, Reference Zhou, Aust, Erb and Palumbo31 resulting in high pitting susceptible of gain boundaries, as shown in Figs. 6 and 8. However, compared with BM, HAZ showed more sensitivity to pitting corrosion, as shown in Fig. 7. On the one hand, more grain boundary formation caused by grain refinement increased the pitting corrosion susceptibility of HAZ as indicated before; on the other hand, the boundaries associated with low CSL, possessing a lot of advantages such as less impurity segregation, high mobility, and low energy exhibited a higher pitting corrosion resistance compared with the other boundaries. Reference Zhou, Aust, Erb and Palumbo31 As shown in Figs. 4, 6, and 8, high twin volume fraction of BM enhanced the pitting corrosion resistance, while lower pitting potential and more pitting nucleation was observed in HAZ with low frequency of twin boundary, confirming the important role of twin boundary in pitting corrosion resistance.
V. CONCLUSIONS
The microstructure and pitting behavior of 316L stainless steel weld joint performed by TIG process were investigated. Microstructures of the different regions in the weld joint were examined by OM and EBSD, the pitting corrosion of the different regions in the stainless steel welds was investigated by 6% FeCl3 solution and potentiodynamic polarization tests. The results were obtained as follows:
-
(1) WZ, which exhibited a duplex structure including ferrite and austenite phases, was composed of columnar dendrites primarily, while HAZ and BM, which consisted of equiaxed gains, exhibited a full-austenite structure. Compared with WZ, low Σ CSL boundaries were inclined to form in HAZ and BM. Gain refinement and reduction of low Σ CSL boundaries occurred in HAZ.
-
(2) No obvious pitting occurs in WZ, while the millimeter-scale pits are observed in HAZ and BM after immersion test in 6% FeCl3 solution. HAZ had a lower pitting potential than WZ and BM, while not much difference in pitting potential was observed between WZ and BM. Dendrite-selected corrosion occurred in WZ, while grain boundary was the preferable site for pitting corrosion in HAZ and BM. Gain refinement and a decrease in twin boundary promoted the pitting corrosion susceptible of HAZ.
ACKNOWLEDGMENTS
The authors acknowledge the financial support for the present work from National Energy Application Technology Research and Engineering Demonstration Project (NY20111201-1).