


INTRODUCTION
Whether the bureaucracy is staffed on merit or through patrimonialism has major implications for governance (Pepinsky, Pierskalla, and Sacks Reference Pepinsky, Pierskalla and Sacks2017; Rauch and Evans Reference Rauch and Evans2000; Weber [Reference Weber, Gerth and Wright Mills1919] Reference Weber, Gerth and Wright Mills1949). A vast literature assumes politicians choose between these equilibria, weighing the benefits of a more competent state against the rents available from raiding state institutions (Brierley Reference Brierley2026; Egorov and Sonin Reference Egorov and Sonin2011; Geddes Reference Geddes1994; Grzymala-Busse Reference Grzymala-Busse2007; Shefter Reference Shefter1977; Reference Shefter1994). Once merit-based institutions have been formally adopted, scholars typically focus on the strategies that politicians adopt to regain control over hiring (Colonnelli, Prem, and Teso Reference Colonnelli, Prem and Teso2020; Peters and Pierre Reference Peters and Pierre2004; Pierskalla and Sacks Reference Pierskalla and Sacks2020). But in practice bureaucrats are intimately involved in hiring decisions, either as a result of formal delegation or via informal processes (de Juan, Haass, and Pierskalla Reference de Juan, Haass and Pierskalla2026). Bureaucrats can use these opportunities to hire staff based on their own preferences, which may deviate from politicians’ (Hassan, Larreguy, and Russell Reference Hassan, Larreguy and Russell2024). Accordingly, hiring represents a principal–agent problem.
This principal–agent problem is magnified when politicians govern (i) societies from which they are socially distant and (ii) territories beyond their core interests. In such contexts, bureaucrats’ preferences over hiring are likely to predominate because they are better informed about applicants and have stronger preferences over whom to hire than principals. These two conditions hold across a broad set of colonial (Garfias and Sellars Reference Garfias and Sellars2026; Herbst Reference Herbst2000), external (Barkey Reference Barkey1996; Lee Reference Lee2022; Matsuzaki Reference Matsuzaki2019), and subnational (Boone Reference Boone2003; Nathan Reference Nathan2023) state-building scenarios in which existing theories may misattribute bureaucrats’ agency in producing patrimonial versus merit-based bureaucracies to their political superiors.
Colonial-era development of central state bureaucracies in Africa often exemplified such dynamics. These central bureaucracies were distinct from the local governments (“Native Authorities”) associated with indirect rule (Afigbo Reference Afigbo1972; Lange Reference Lange2009; Mamdani Reference Mamdani1996).Footnote 1 While initially tiny, central ministries oversaw increasingly complex service delivery and infrastructure portfolios in the later decades of colonial rule (Cogneau, Dupraz, and Mesplé-Somps Reference Cogneau, Dupraz and Mesplé-Somps2018; Lange Reference Lange2009; Young Reference Young2004). As incipient civil services grew, colonial leaders looked to fill positions with locals rather than Europeans. “Africanization” policies resulted in the hiring of the African bureaucrats who then served in state institutions inherited upon independence (Johnson-Kanu Reference Johnson-Kanu2021). European leaders hired agents from societies about which they lacked deep knowledge, while operating under monitoring constraints. In colonies that were neither vital to the colonial project nor in sustained revolt, European principals may have lacked strong preferences over which specific Africans to hire. In contrast, existing African bureaucrats possessed deep knowledge of their own societies and likely had strong recruitment preferences given both the high value of state employment and social pressures to reward family or co-ethnics with scarce opportunities (Ekeh Reference Ekeh1975).
Applying our theory suggests a reassessment of bureaucratic development in postcolonial states. Canonical literature argues that the rapid onset of mass politics can incentivize patrimonialism (Huntington Reference Huntington1968; Shefter Reference Shefter1977; Reference Shefter1994). In Africa, colonial hiring into central state bureaucracies is often argued to have been meritocratic—with hiring predicted by access to education (Lange Reference Lange2025; Mazrui Reference Mazrui1978; Ricart-Huguet Reference Ricart-Huguet2021); (neo)patrimonial practices within the central state are often said to have only emerged once postindependence governments faced new pressure to build winning coalitions (Chabal and Daloz Reference Chabal and Daloz1999; Collier Reference Collier1982; Lange Reference Lange2009; van de Walle Reference van de Walle2001; Young and Turner Reference Young and Turner1985; Zolberg Reference Zolberg1966). However, most of these claims lack hard evidence about the alleged meritocracy of colonial hiring against which to compare postindependence developments. We instead propose that patrimonial hiring was already commonplace during colonial rule—driven by the actions of initial African bureaucrats—despite colonial leaders’ claims to have established meritocratic practices.Footnote 2 Consequently, in some cases, independence-era politicians may be better described as responding to existing (neo)patrimonialism than creating it.
To assess our theory of bureaucrat-led hiring, we turn to data from Ghana. We use ethnically-biased hiring as a proxy for patrimonial practices. Similar to Johnson-Kanu (Reference Johnson-Kanu2021) for Nigeria, we digitize bureaucrat-level records of the colonial civil service from the British National Archives. Our main data span 1897–1955—the eve of Ghana’s independence. We identify 11,702 unique bureaucrats, including 4,805 Europeans and 6,879 Africans (Ghanaians). Leveraging the universe of names of all 13.8 million contemporary Ghanaian adults (registered voters as of 2015) geocoded against highly-localized ethnicity data from the 2010 census, we distinguish European from African (Ghanaian) bureaucrats and code the (likely) ethnicity of every Ghanaian bureaucrat based on their names.Footnote 3
We document persistent hiring inequality throughout the colonial period. From the outset of African employment, two small ethnic groups—the Ga (
$ \sim $
 3% of the population) and Fante (
$ \sim $
 11%)—dominated the bureaucracy, consistently overrepresented and occupying over 70% of public sector positions until independence. We then focus our main attention on evaluating competing explanations for why this inequality emerged and, especially, persisted. Consistent with a logic of bureaucrat-led insider capture, we show that once any group gained a foothold within senior ranks in any state department (ministry), the chances that others from that group were hired in that department rose sharply. Rather than meritocracy, the formal policy asserted by British principals, our evidence suggests patrimonial practices by ethnic groups who held first-mover advantages within the bureaucracy. The Ga and Fante could capitalize the most because they were the first to reach senior bureaucratic positions.
We use additional data to further demonstrate the insider capture mechanism and rule out three alternatives more commonly used to explain ethnic imbalances in incorporation into colonial states. First, we geolocate all schools starting from the 1890s, generating granular measures of both access to and the quality of education per ethnic group over time. Even though early advantages in education help explain the very initial hiring of small numbers of Ga and Fante bureaucrats in the nineteenth century, we demonstrate that the sustained dominance of these groups during Ghana’s main Africanization period in the 1930s through 1950s cannot be explained by education: even many decades after other ethnic groups had caught up in educational opportunities, Ga and Fante bureaucrats continued to dominate new hiring. Employing individual-level results on civil service examinations to test directly for meritocracy, we also show that Ga and Fante applicants were favored far beyond their supply of qualified candidates.
Second, we rule out that Ga and Fante dominance could be explained by their geographic proximity to state offices, showing their advantages extended to both desk jobs in the capital and field positions far from their home regions, and also that Ga and Fante bureaucrats were hired well out of proportion with the presence of state employment opportunities in their home areas. Third, we cast doubt on the presence of strategic British preferences to favor these groups, demonstrating instead that the persistent patterns we document most likely resulted from hiring pressures internal to the bureaucracy itself.
We make several contributions. Theoretically, we advance insights about why bureaucrats are a crucial, but often-overlooked, actor in the development of merit-based or patrimonial bureaucracies (Anzia and Trounstine Reference Anzia and Trounstine2025; Hassan, Larreguy, and Russell Reference Hassan, Larreguy and Russell2024) and suggest how bureaucrats’ personal—as opposed to political—connections to other bureaucrats play a role in hiring (de Juan, Haass, and Pierskalla Reference de Juan, Haass and Pierskalla2026; Harris et al. Reference Harris, Meyer-Sahling, Mikkelsen, Schuster, Seim and Sigman2023). While we focus on a single case, we suggest that bureaucrats’ preferences should be similarly important for understanding bureaucratic development across a broader range of examples of external (Herbst Reference Herbst2000; Lee Reference Lee2022; Matsuzaki Reference Matsuzaki2019) or peripheral (Boone Reference Boone2003; Nathan Reference Nathan2023) state-building. Our theoretical approach also advances an emerging literature exploring how the micro-dynamics of state-building under colonial rule shaped initial distributions of power in the postcolonial period (Harkness Reference Harkness2018; Johnson-Kanu Reference Johnson-Kanu2021; Kuipers Reference Kuipers2025; Lange Reference Lange2025; Nathan Reference Nathan2023; Ricart-Huguet Reference Ricart-Huguet2021; Reference Ricart-Huguet2022) and implies that African employees may have had more agency in aspects of colonial state-building than typically understood.
Methodologically, by linking the universe of adult names in a country to geocoded census data, we introduce a new approach to code ethnicity from names—a common task for scholars of bureaucratic politics (e.g., Hassan Reference Hassan2020; Kuipers Reference Kuipers2025).Footnote 4 Our method offers advantages over existing dictionary-based, machine learning, or hand-coded approaches that have been used in other contexts in the Global South (Bird and Michuda Reference Bird and Michuda2025; Chaturvedi and Chaturvedi Reference Chaturvedi and Chaturvedi2024; Harris Reference Harris2015; Kasara Reference Kasara2013). Importantly, our approach (or one similar to it) can be used in any context in which researchers have access to local ethnic census data and the names of large numbers of individuals linked to approximate locations.
Our rich data also open a long-standing “black box” in the study of African states, with political scientists and historians united by the near-total absence of hard data on the hiring of local staff into colonial central bureaucracies.Footnote 5 Most studies have been confined to data on only a single state agency (e.g., Ray Reference Ray2012) or instead to making broad generalizations about how indigenous populations were incorporated into states (e.g., Apter [Reference Apter1955] Reference Apter1963; Lange Reference Lange2025; Rathbone Reference Rathbone2000; Shaloff Reference Shaloff1974; Tignor Reference Tignor1993). Opening this black box also creates opportunities to re-interpret the origins of the political cleavages that continue to shape African politics today. Consistent with Ray (Reference Ray2019), Kuipers (Reference Kuipers2025), and Lange (Reference Lange2025), we show how colonial-era inequities in hiring fed postcolonial demands on politicians to engage in ethnic favoritism to correct them.
THEORY: BUREAUCRATIC HIRING IN THE PERIPHERY
Most literature assumes that politicians’ incentives and actions determine variation between meritocratic versus (neo)patrimonial (patronage-based) bureaucracies. Politicians are commonly theorized as facing a “politicians’ dilemma” or “loyalty versus competency trade-off,” in which they weigh the temptation to use state jobs as clientelist spoils to build support against the benefits of improving state capacity from hiring on merit (e.g., Brierley Reference Brierley2021; Reference Brierley2026; Egorov and Sonin Reference Egorov and Sonin2011; Geddes Reference Geddes1994; Grzymala-Busse Reference Grzymala-Busse2007; Hassan Reference Hassan2020; Shefter Reference Shefter1977).
But even after merit-based institutions have been adopted, politicians largely delegate the mechanics of hiring to bureaucrats. Despite the practical role bureaucrats play, they remain an under-theorized actor in state hiring (de Juan, Haass, and Pierskalla Reference de Juan, Haass and Pierskalla2026). Scholars recognize that de jure merit-based procedures can be evaded, but almost exclusively focus on politicians’ rather than bureaucrats’ efforts to evade them (Peters and Pierre Reference Peters and Pierre2004; Pierskalla and Sacks Reference Pierskalla and Sacks2020). For example, literature on patronage typically focuses only on connections between politicians and potential state employees, with little attention to relationships between existing bureaucrats and new recruits.Footnote 6 Yet public administration scholars and economists have found that nonpolitical connections to other bureaucrats can be more important in hiring and career advancement in some contemporary bureaucracies than connections to politicians (Cardoso et al. Reference Cardoso, Cireno, Labonne, Masson, Palotti, de Vitoria and Williams2025; Harris et al. Reference Harris, Meyer-Sahling, Mikkelsen, Schuster, Seim and Sigman2023). Nonetheless, Harris et al. (Reference Harris, Meyer-Sahling, Mikkelsen, Schuster, Seim and Sigman2023, 956) explain that nonpolitical connections are a topic most “existing studies of connection-based hiring disregard.”
Bureaucrats have hiring preferences that differ from politicians’ (Hassan, Larreguy, and Russell Reference Hassan, Larreguy and Russell2024). Independent of politicians’ incentives, existing bureaucrats sometimes prefer meritocracy. When faced with widespread political interference, bureaucrats are incentivized to seek an insulated, meritocratic public sector to protect job security (Anzia and Trounstine Reference Anzia and Trounstine2025; Shefter Reference Shefter1977). Moreover, bureaucrats may be individually “mission-driven” (Honig Reference Honig2024) or possess an esprit de corps in support of meritocratic principles (Evans and Rauch Reference Evans and Rauch1999; Weber Reference Weber1978).
Alternatively, bureaucrats may prefer to hire coworkers and subordinates on the basis of social connections, with little regard for merit (Hassan, Larreguy, and Russell Reference Hassan, Larreguy and Russell2024).Footnote 7 This is often motivated by social obligations. Ekeh (Reference Ekeh1975) famously describes social pressure to divert resources to family members and co-ethnics that many African state employees faced in the independence era. Such behavior is rational for bureaucrats, as failure to recognize one’s corporatist responsibilities can result in social, psychological, and/or financial distress, as Price (Reference Price1975) shows in postindependence Ghana. In many settings, social obligations are defined in terms of kinship and ethnicity.
Beyond an explicit sense of obligation, preferences for group-based hiring can also be a function of social networks: individuals are more likely to interact and reciprocate friendship with people with whom they share identities, such as ethnicity (Wimmer Reference Wimmer2013a); if they then favor their own social ties in hiring as a result, ethnically-segregated social networks will produce ethnically-biased hiring, even in the absence of explicit discriminatory preferences. Beyond ethnicity, social networks may be defined by, for example, shared partisan or religious identities, which may similarly influence bureaucratic hiring preferences (Wirsching Reference Wirsching2026).Footnote 8 Of course, some bureaucrats may also be motivated by explicit taste-based discrimination, which would produce observationally equivalent homophily in hiring (Wimmer Reference Wimmer2013a).
Whatever bureaucrats’ motivations, unconstrained hiring based on social obligations or personal connections leads to the overrepresentation of recruits who share salient social identities with the incumbent bureaucrats who influence hiring decisions. These existing bureaucrats can become patrons to new recruits who attain positions through their largesse, a form of patrimonialism.
Divergence in preferences between politicians and bureaucrats results in a principal–agent problem. Bureaucrats can use privileged information they gain over vacancies and roles on hiring and interview boards to wield influence. Hiring outcomes depend on how much politicians are willing to invest to overcome this principal–agent problem. At one end of the scale, where politicians care deeply about who gets hired (or how; e.g., via merit), they are incentivized to develop costly processes to monitor bureaucratic agents’ compliance. But in other situations, politicians may prefer a particular type of bureaucracy and invest some resources to promote compliance, but not enough to overcome bureaucrats’ own incentives to deviate from politicians’ instructions. In these cases, rarely explored in the existing literature, even if politicians do not cede de jure control of hiring to bureaucrats, bureaucrats’ preferences can still take de facto precedence.Footnote 9
Figure 1 conceptualizes two dimensions that magnify this problem. Bureaucrat-led hiring is most likely in state-building scenarios exemplified by the top-left cell (1), where principals’ costs of monitoring compliance are highest and incentives to invest in monitoring are lowest.
Scope Conditions for de Facto Hiring Influence of Politicians versus Bureaucrats

The vertical axis captures the degree to which political principals overseeing new bureaucracies are ethnically distinct from the populations from which they recruit agents. Principals’ social proximity to bureaucrats (e.g., speaking the same language, knowing the context, and having close relationships to local elites) makes internal hiring processes more legible and less costly to monitor. Proximity is high when principals are from the same society from which they hire agents (cells 3 and 4). Cells 1 and 2 instead capture situations in which principals are outsiders, and a costly monitoring problem emerges in which locally-embedded bureaucrats know much more about potential recruits than principals. Cells 1 and 2 may apply uniformly at the national level in cases of colonial rule or “external state-building,” as foreign powers (re)build state institutions in conquered territories (Lee Reference Lee2022; Matsuzaki Reference Matsuzaki2019; Migdal Reference Migdal1988). Elsewhere, cells 1 and 2 arise subnationally as central leaders, social insiders in their home regions, instead expand the state out into socially-distinct peripheries (Barkey Reference Barkey1996; Boone Reference Boone2003).
The horizontal axis of Figure 1 instead indicates the intensity of principals’ preferences to construct a particular type of bureaucracy: how much principals care about seeing through a particular hiring outcome, both in an absolute sense and, especially, in comparison to the intensity of bureaucratic agents’ own preferences. High preference intensity (cells 2 and 4) is often taken as given, especially when democratic elections incentivize politicians to use public sector jobs to increase state capacity or instead buy off local support to ensure their own political survival (Geddes Reference Geddes1994; Grzymala-Busse Reference Grzymala-Busse2007; Shefter Reference Shefter1977). In non-electoral contexts, preference intensity can also be high in territories with high levels of unrest that threaten to depose or eject the principal.
In contrast, low preference intensity (cells 1 and 3) should be especially common when principals seek to expand state institutions into territories that are not essential to their own political or economic interests—and thus that pose little accountability threat to principals’ hold on power. This is magnified in the absence of electoral competition, as well as where either social unrest or economic value are low. With lower stakes, principals have less reason to invest extensively in monitoring bureaucrats’ hiring decisions.
Many cases of Africanization of central colonial bureaucracies, especially in nonsettler colonies, exemplify cases where European principals’ high social distance from the communities they governed should have created high costs to monitoring agents’ compliance with hiring directives, and in which principals’ preferences to hire specific local agents were potentially weak relative to existing bureaucrats’ (cell 1). European state-builders were constructing bureaucracies within local societies about which they often had limited knowledge. Meanwhile, colonial subjects could exert little accountability pressure on leaders, except through exceptional unrest. And while European firms certainly profited from extractive trade, few colonies were particularly essential to European economies.Footnote 10 As long as unrest was low and minimum levels of bureaucratic competence to extract were maintained, European principals may have seen it unnecessary to invest scarce resources in carefully monitoring compliance.
Meanwhile, initial African bureaucrats likely had strong incentives to prefer hiring based on their own social obligations and connections, rather than merit. Most African employees of colonial states sought these jobs because they were among the most secure, and best remunerated formal sector options in fledgling local economies. There is little reason to expect most would be especially “mission-driven,” or committed to the success of the broader (racist and repressive) colonial project. Under these conditions, social obligations and connections should be expected to drive bureaucrats’ private hiring preferences, consistent with Ekeh (Reference Ekeh1975). De facto bureaucrat-led hiring shaped by existing bureaucrats’ private imperatives could then have quietly become rampant, in spite of colonial leaders’ public pronouncements declaring adherence to meritocratic principles (Cooper Reference Cooper1996; Price Reference Price1975).
By contrast, in settler colonies, the presence of European residents increased direct political accountability of colonial leaders to (segments of) the population and also increased risks (to Europeans) from mismanaging African discontent. This should have increased the intensity of principals’ preference for merit-based criteria to improve performance (even if only performance at repression). Moreover, settlers reduced social distance between colonial leaders and potential employees, and likely created a further interest among European leaders in merit-based procedures that would disproportionately benefit local Europeans, given their advantaged education.
Even though they lacked elections, settler colonies may thus better correspond to more standard models of politicians’ preferences over hiring, best captured by cell 4 of Figure 1, where politicians are better-informed about and have strong political incentives to control hiring. Off-diagonal cases (cells 2 and 3) instead capture situations in which hiring outcomes reflect mixed influence of both politicians and bureaucrats. These include external state-building in territories vital to the center’s economic interests, or prone to very threatening unrest; although monitoring challenges persist, politicians have clearer incentives to invest in costly oversight (cell 2). Similarly, autocratic state-building in contexts where locals share ethnic ties with the principal—reducing social distance—but exert little to no accountability pressure may also generate mixed patterns of influence (cell 3).
In this article, we seek to establish that cell 1 exists by focusing deeply on a single case where new data sources provide a window into bureaucrat-led hiring that previous studies have missed. While the lack of similar data in other cases means that it is not possible for us to examine variation across all cells of Figure 1, the figure offers a broader theoretical map of how the social proximity and strategic commitment of political principals should change the structure of bureaucratic hiring across cases.
THE COLONIAL STATE AND AFRICANIZATION
Our argument also suggests reinterpreting classic claims about African states. By the end of Africa’s postcolonial era (
$ \sim $
 the 1990s; Young Reference Young2004) a broad consensus characterized central state bureaucracies as “neopatrimonial,” rife with ethnic patronage and limited merit in hiring (Bayart Reference Bayart1993; Chabal and Daloz Reference Chabal and Daloz1999; Englebert Reference Englebert2000; van de Walle Reference van de Walle2001; Young and Turner Reference Young and Turner1985).Footnote
11
This stands in contrast to common claims about the central bureaucracies of colonial states. In many countries, central bureaucracies inherited at independence had already begun Africanization. While many scholars describe indirect rule, a core strategy of local-level colonial governance, as inherently patrimonial (Lange Reference Lange2009; Mamdani Reference Mamdani1996), scholars frequently suggest that management of national-level state agencies in the colonial period instead more tightly fits Weber’s bureaucratic archetype (Weber Reference Weber1978, 220). Young and Turner (Reference Young and Turner1985, 27), for example, write that “colonial authoritarianism [in Africa] was exercised through an autonomous, impersonal bureaucracy.”Footnote
12 Lange (Reference Lange2009, 4) describes that “central legal-administrative institutions in indirectly ruled colonies were relatively bureaucratic,” explicitly referencing Weber’s “bureaucratic” type (35).Footnote
13 Van de Walle (Reference van de Walle2001, 134) observes that “meritocratic hiring and promotion policies
$ \dots $
 were directly undermined by governments in the years after independence,” implying their greater presence under colonialism.
Existing accounts mostly portray (neo)patrimonialism in central state ministries as something postcolonial leaders did, not inherited.Footnote 14 For example, Young and Turner (Reference Young and Turner1985) describe a “distinctive” shift toward patronage after independence (27). Chabal and Daloz (Reference Chabal and Daloz1999) date the emergence of neopatrimonialism to “after independence” (51). Van de Walle (Reference van de Walle2001) writes that, “[t]he first blows against state capacity came early after independence” (133) dating “the first step in the politicization and loss of professionalism of the civil service” to postcolonial presidents (134). Lange (Reference Lange2009, 108) describes Sierra Leone similarly.
Colonial central bureaucracies often had de jure trappings of meritocracy. However, assertions that hiring was de facto meritocratic still remain unsubstantiated—tantamount to simply taking colonial officials’ word for it. Beyond the senior-most ranks, relevant data simply have not been available (e.g., Shaloff Reference Shaloff1974). Lacking the data we analyze, Rathbone (Reference Rathbone2000) observes, for example, that analysis of African hiring beyond the most elite strata of bureaucrats is difficult because “the exact figures are hard to come by” (71). Others, such as Lange (Reference Lange2009, 39), reference that hiring into central bureaucracies was not fully “inclusive” of societal groups, but lack any data with which to empirically assess why or how much. And, critically, such a lack of inclusivity could still be consistent with meritocratic hiring as long as there were inter-ethnic inequalities in access to education (Kuipers Reference Kuipers2025).
Our argument suggests instead that despite adopting impartial institutions, colonial leaders likely had little incentive to ensure African hiring was truly meritocratic. Exploiting information asymmetries and the well-documented unwillingness of colonial principals to make costly investments in colonial states, initially-hired African bureaucrats could have had wide latitude to engage in patrimonial practices that created limited inclusiveness. Wherever Africanization predated independence, the well-documented behaviors of Africa’s postcolonial leaders vis-à-vis their central states may then have been a response to patrimonialism and ethnic biases already pervasive within state institutions they inherited, not a new bureaucratic politics emerging after independence.
THE PUBLIC SECTOR IN THE GOLD COAST
Ghana’s pre-independence state, the Gold Coast, provides an ideal case for understanding hiring of African bureaucrats for several reasons. First, similar to many other African colonies, the Gold Coast had a “bifurcated colonial [state] based on two radically different organizational principles” (Lange Reference Lange2009, 4), combining indirect rule through local elites as the main method of local governance in the countryside with a nominally-Weberian national-level civil service, our focus here.
Second, the central bureaucracy experienced significant colonial-era Africanization, with over half of senior- and mid-level positions already filled by Ghanaians by independence. This is roughly comparable to other major African colonies, such as Nigeria, where 61% of senior civil service posts had been Africanized by independence (Lungu Reference Lungu1980), or Botswana, where Africans occupied 39% of senior- and middle-level posts in 1964, two years before independence (Goldsmith Reference Goldsmith1999, 538). Similarly, Africans filled between one quarter and one third of middle- and high-level public service positions in Kenya, Tanganyika, and Uganda (Simson Reference Simson2017, 28). In some other settings, however, there were much lower shares of African recruits.Footnote 15 Third, similar to most other colonies (Young Reference Young1994), central bureaucracies built under colonialism continued largely uninterrupted, becoming the postcolonial central state. And fourth, significant ethnic competition over positions within these bureaucracies, consistent with neopatrimonialism, occurred after independence (Asante and Gyimah-Boadi Reference Asante and Gyimah-Boadi2004).
Ghana had contact with Europeans at trading forts along its southern coast since the fifteenth century. In 1821, the British took control of these forts, setting the stage for establishment of a larger colony in 1874, which continued until 1957. The colony only comprised coastal areas until the end of the nineteenth century, when the British finally conquered Asante and expanded throughout the interior. While the Gold Coast was fiscally successful, especially relative to other African colonies (Austin Reference Austin2008, 1011), the climate ensured it remained a nonsettler colony. The British initially invested relatively little in administration and sought to keep expenditures and European staffing low (Sederberg Reference Sederberg1971), but the central bureaucracy expanded greatly in size in the final decades of the colonial period, as the British belatedly took on a more “developmentalist” outlook, especially after WWII (Young Reference Young2004). As the central state grew, locals with Western education eventually filled the gap in staffing.
Supply of African Bureaucrats
On the supply-side, the pool of potential African recruits was initially produced by efforts of European merchants and then Christian missionaries, typical of many British African colonies (Frankema Reference Frankema2012). Merchants established schools as early as the 1600s within the trading forts. With few students until the nineteenth century, fort schools mainly educated children born to European merchants and coastal women (Graham Reference Graham1971). Enrollment only began to climb after the British takeover in 1821, when the Crown began funding some coastal schools and missionary schools also began to rapidly proliferate beyond zones of British control (Graham Reference Graham1971).
The early concentration of schools around Cape Coast meant that the Fante—a sub-group within Ghana’s plurality Akan—had a head start in education before colonial rule. The presence of European firms around the forts increased jobs available to locals and spurred enterprise, and with it class differentiation (Arhin Reference Arhin1983). By the 1830s, a “genuine mercantile class” (Arhin Reference Arhin1983, 16) of Fante elites had emerged (Kelly Reference Kelly1959). Many members of this emerging Fante intelligentsia bore European surnames, owing to their descent from early European traders. The Ga in Accra, another site of trading forts, also enjoyed precolonial education access. Similar to the Fante, a new Westernized elite of clerks and merchants had emerged by the 1820s, educated in schools at or near the forts (Parker Reference Parker2000, 32–3).
For the very earliest periods of British state-building in the nineteenth century, Fante and Ga communities thus enjoyed an advantage in the supply of potential job candidates. But by the early twentieth century, before significant African hiring into the state had occurred, these advantages had already begun to recede, and many ethnic groups had large numbers of school graduates eligible for state employment. The nineteenth-century expansion of mission schools meant access to education already began to equalize throughout Southern Ghana around the turn of the century. School access then expanded rapidly into the interior in the early twentieth century, generating an “extremely broad primary base” (Austin Reference Austin1964, 13). This is shown in Figure 2 based on geolocating annual lists of schools published through the early 1930s. Only the Northern Territories—modern-day Northern Ghana—were persistently neglected (Nathan Reference Nathan2023). Crucially, expansion of the education system meant that access was already relatively equal across many groups decades before Africanization of the central bureaucracy occurred (1930s–1950s).Footnote 16
Location of All Schools, Primary and Secondary (1894–1932)

Figure 2. Long description
Three maps of Ghana show the progression of school locations marked with blue x symbols.
1. Schools as of 1894. The first map shows a sparse distribution of schools primarily concentrated along the Southern coast near Cape Coast and Accra. A few isolated schools appear in the Southwest and Central regions. Major inland cities Tamale and Kumasi are marked with black dots but have no schools nearby.
2. Schools as of 1914. The second map shows a significant increase in density in the Southeast and South-Central regions. Schools now cluster around Kumasi and extend further North toward the center of the country. The coastal density has also increased.
3. Schools as of 1932. The third map shows a high density of schools across the Southern half of the country, particularly in the Southeast and around Kumasi. Schools have begun to appear in the Northwest and Northeast corners, and a school is now located at Tamale in the North. The coastal strip is almost entirely lined with school markers.
Demand for African Bureaucrats
At the apex of the state was the (British) Governor, under whom sat advisory Executive and Legislative Councils with some elite African participation (Price Reference Price1967; Ward Reference Ward1966). Under these councils sat the civil service, the core national bureaucracy, divided into departments (ministries or agencies). The number of departments and civil servants increased over time as the state became more complex, with especially steep growth after WWII, similar to many other colonies (Lange Reference Lange2009, 42). Separately, local governance occurred via indirect rule, eventually formalized through the creation of much smaller bureaucracies of local clerks to provide support to district-level local governments headed by chiefs. Our focus throughout is instead on the central civil service.
Initial state institutions in the nineteenth century relied heavily on African staff. Von Hesse (Reference von Hesse2024) documents how Euro-African merchants among the precolonial Ga and Fante elite were in fact “co-architects” (5) of initial colonial institutions, helping to personally fund and physically build the first outposts of the colonial government in the mid-nineteenth century. In 1850, James Bannerman—an educated Ga merchant—even served as the interim Governor of the Gold Coast, “the only British colonial governor of known African ancestry” across the British empire (von Hesse Reference von Hesse2024, 3). Later on in the nineteenth century, educated Fantes began to dominate the lower ranks of the very nascent civil service, serving as aides to British officers (Kelly Reference Kelly1959, 33), while a small set of educated Euro-African Fante and Ga elites rose to senior state positions alongside British counterparts. However, by the turn of the twentieth century, racist British policies against promoting Africans solidified and the vast majority of top positions were reserved for expatriates (Shaloff Reference Shaloff1974).
It was only under Governor Guggisberg (1919–27), in 1926, that an official Africanization scheme was first adopted, justified in terms of ethical need for local representation, and especially for saving costs because Africans were paid less. Yet despite the new scheme, there continued to be little recruitment of Africans into senior positions. Foreshadowing the agency loss we examine below, European bureaucrats resisted their principal’s order to Africanize in the interwar years for “equal parts of racism and self-interest” (Shaloff Reference Shaloff1974, 494), seeking to protect their own jobs.Footnote 17 However, as we show below, outside the frame of reference of the existing historical scholarship (e.g., Shaloff Reference Shaloff1974), Africanization became extensive in the 1930s at more junior ranks. During the 1930s and early 1940s, British civil servants pleaded with their superiors that hiring Africans into the senior-most positions was impossible because an insufficient number of well-trained candidates was available (Rathbone Reference Rathbone2000; Shaloff Reference Shaloff1974), but there was already a large oversupply of eligible African school graduates for mid- and lower-tier positions. Civil service jobs were scarce and highly-valued among the local population (Hutchful Reference Hutchful1985).
Africanization of the top ranks finally took off after WWII. Between 1949 and 1954, the share of Africans in senior positions rose from 14% to 38% (Cooper Reference Cooper1996, 448). Over the 1950s, the rate of Africanization accelerated, such that just after the Gold Coast gained independence, 69% of the 2,864 senior posts were held by Africans (Rathbone Reference Rathbone2000, 80). Importantly, this final wave of hiring occurred after Kwame Nkrumah, Ghana’s independence leader, won an election in 1951 and gained control of internal affairs before independence in 1957.
DATA SOURCES
We unpack potential ethnic hiring in Ghana’s colonial bureaucracy using data from multiple sources. First, we digitize data on the colonial civil service between 1897 and 1955 from the British National Archives. These staff lists provide names, positions, salaries, and appointment dates for central state employees, including headquarters and field staff of each ministry or agency.Footnote 18 Figure 3 displays an example extract.
Example Extract from the 1955 Hybrid Staff List

Figure 3. Long description
A black and white table titled Ministerial and Regional Administration continued. The table is organized into eleven columns from left to right. Appointment and Name. West African or Overseas Officer. Date of Birth. Posting. Salary at 1 forward slash 7 forward slash 56. First Appointment. Present Appointment. Began Present Tour. Incremental Date. Status. Salary Scale and Remarks.
The first section is Administrative Officers Class I I 35 continued. It lists individuals such as J. M. L. Peake, J. B. Hooper, and C. P. Mercier. Salaries for this group are mostly 1,500 or 1,450 pounds. Postings include M. Health, E. S. O., M. T. L., and Ashanti. The Status column consistently shows C n f. for confirmed. Remarks include notes on retirement and specific training courses like L. S. E. or D. T. C. 48 forward slash 49.
A sub-section follows for Senior Assistant Secretary Supernumerary, listing A. E. Chinbuah with a salary of 1,500 pounds and a remark about a post-graduate course at I. C. T. A. Trinidad.
The final visible section is Administrative Officers Class I I I 59, listing G. M. Darling, K. D. Bell, and M. R. Venables. Salaries in this section range from 1,160 to 1,200 pounds. Remarks for Darling note he is proceeding on retirement leave in September.
The composition of staff lists changed over time and availability is inconsistent across years. The lists fall into three types: (1) Senior Staff Lists (SSLs), (2) African Staff Lists (ASLs), and (3) Hybrid Staff Lists (HSLs).Footnote 19 The SSLs provide information about the higher ranks of the civil service (e.g., department and section heads and deputies), both European and African, and are available from 1897 to 1946. Between 1936 and 1945, we also have ASLs—listing only Africans, but spanning all ranks. ASLs offer a detailed snapshot of African representation across various bureaucratic roles, but do not allow for tracking trends across the full colonial period. After 1946, the government altered its reporting format, effectively creating a third, middle-tier list we refer to as the HSLs.Footnote 20 The range of positions included in SSLs expanded to encompass a broad cross-section of mid-ranking officials. Many positions previously found only in the ASL appear in the HSLs, although the lowest-ranking employees were excluded.
Using these lists, we identify 11,702 unique bureaucrats: 4,805 Europeans and 6,879 Africans (Ghanaians).Footnote 21 Figure 4 shows nationalities among senior bureaucrats in the SSLs and HSLs between 1897 and 1955, illustrating the Africanization that began in the late 1920s and rapidly intensified from 1947. For our data, see Brierley et al. (Reference Brierley2026).
Bureaucrat Nationality in the Senior and Hybrid Staff Lists (1897–1955)

Figure 4. Long description
The X axis represents Year from 1897 to 1955 in five-year increments. The Y axis represents Proportion from 0 to 100.
* The British data series, marked by a solid teal line with square points, begins near 100 in 1897. It remains stable above 95 until 1922, then begins a gradual decline to approximately 87 by 1937. After a brief peak back to 92 in 1943, it drops sharply after 1947, ending at roughly 52 in 1955.
* The Ghanaian data series, marked by a dashed coral line with circular points, begins near 0 in 1897. It remains negligible until 1922, then shows a slow increase to about 12 by 1937. Following a slight dip in the early 1940s, it rises steeply after 1947, reaching nearly 48 by 1955.
The two lines move in inverse relation, with the gap between British and Ghanaian representation narrowing significantly in the final decade of the period.
Classifying the Most Likely Ethnicity of Each Bureaucrat
To establish the ethnic identity of each African bureaucrat, we combine census data containing the ethnic composition of small communities with voter register data that lists names of individuals within these communities. We classify each bureaucrat into one of 10 categories, which represent important national-level ethnic cleavages (Asante and Gyimah-Boadi Reference Asante and Gyimah-Boadi2004; Nathan Reference Nathan2019).Footnote 22 We validate our ethnicity coding below. However, we also stress that no classification process is perfect: some names are simply not very ethnically distinct. Similarly, we cannot systematically identify ethnically-mixed individuals.Footnote 23 Yet without being able to interview colonial-era bureaucrats to ascertain their ethnicity directly, we believe our approach provides a best-case scenario for extracting ethnic information from names. We outline the general procedure below; a formal definition is in Section S3 of the Supplementary Material.
We use data from Ghana’s 2015 voter register, which contains a near-universe of names of contemporary adults (13.8 million individuals) (ECG 2015). Each voter is assigned to a polling station. We combine these names with Ghana’s 2010 census (GSS 2013), measuring ethnic composition within Enumeration Areas (EAs, or tracts). Geolocating each polling station to these EAs, we split each name registered at each station into constituent fragments (e.g., “Samuel Okudzeto” becomes “Samuel” and “Okudzeto”) and assign each fragment the ethnic population proportions of that station. Summing the frequency of fragment appearances across stations, we compute an average vector of ethnic proportions for each of Ghana’s 1.1 million unique name fragments.
We then calculate each fragment’s ethnic distinctiveness, defined as the distance between the fragment’s average group proportions and the base rate of ethnic group proportions in Ghana’s overall voter population. Name fragments that carry meaningful ethnic information (high distinctiveness) will exhibit average ethnic distributions that deviate from the national base rates, concentrating more heavily on a particular group. In contrast, names that are widely used across groups—“John” or “Mary”—do not deviate much from the base rate of ethnic group proportions (low distinctiveness). Without accounting for distinctiveness, such widely-used names would disproportionately (and erroneously) be assigned to the most populous ethnic group nationwide. We use distinctiveness scores as weights to ensure that more informative fragments contribute more heavily to classification of each individual; in the example of “Samuel Okudzeto,” “Samuel” is common and ethnically uninformative, while “Okudzeto” strongly signals Ewe ethnicity. Our method accordingly upweights the surname’s information and classifies him as most likely Ewe.
Our approach builds on methods from Kasara (Reference Kasara2013) and Harris (Reference Harris2015) that infer ethnicity from names in Kenya. These methods construct group-specific dictionaries from similar voter registration data by focusing on homogeneous polling stations—for example, those with over 90% of voters from a single group (Kasara Reference Kasara2013)—assuming names there are broadly representative of that group. This assumption easily may not hold. Our strategy instead enables classification of individuals even with names used by multiple groups, while also incorporating classification uncertainty in the form of our distinctiveness score.
Validating Our Measure
Validating whether our approach correctly identifies ethnicity requires access to a large set of names linked to self-identified ethnicities. Fortunately, a survey from Brierley and Nathan (Reference Brierley and Nathan2021) includes both full names and self-reported, sub-group-level ethnicities for a large sample of Ghanaian respondents (N = 1,151). Our method performs well in recovering self-identified ethnicities when name distinctiveness is moderate to high. For example, for names in the top quartile of name distinctiveness in the survey, we recover self-reported ethnicity 90% of the time. However, as can be expected, our performance declines for names with low distinctiveness (Section S4 of the Supplementary Material).Footnote 24
Rather than indicating a flaw, our difficulty classifying low-distinctiveness names highlights a key feature of our task: names with low distinctiveness convey limited information, as each fragment is widely used across multiple groups. Accordingly, no alternative method—whether algorithmic like ours, machine learning-based, or hand-coded—could reliably extract ethnicity from such names. Indeed, we show that the common alternative of hand-coding names based on local research assistants’ knowledge introduces even worse measurement error (Section S5 of the Supplementary Material).
Moreover, recent machine learning approaches such as Chaturvedi and Chaturvedi (Reference Chaturvedi and Chaturvedi2024) cannot be applied in our or many other contexts due to the lack of a sufficiently large and statistically-representative training dataset. Machine learning approaches also introduce statistical uncertainty when estimating ethnic labels for names not in the training data. But because we start with the universe of Ghanaian names, over 98% of bureaucrats have a name fragment that matches to the voter register exactly. We thus do not need to infer ethnicity based on similarly-spelled name fragments.
Given the inherent limitations classifying low distinctiveness names, the analyses below drop all bureaucrats scoring in the bottom quartile on our distinctiveness score, removing observations among whom it is especially difficult to ascertain ethnicity. To demonstrate that this specific cutoff does not bias our conclusions, we repeat all tables and figures instead using other cutoffs, as well as when not dropping any observations (Section S7 of the Supplementary Material). All key patterns are robust to these alternatives. In fact, Figure S7.1 in the Supplementary Material shows that the central pattern in our results persists impervious to any cutoff for how many low-distinctiveness names to drop all the way up through dropping the full bottom half of our data and is thus very unlikely to be due to measurement error.Footnote 25
ETHNIC IMBALANCE IN THE COLONIAL CIVIL SERVICE
Two patterns are evident when disaggregating the bureaucracy by ethnicity. First, two groups—the Ga and Fante—dominated African hiring at both senior and junior levels of the civil service. Second, this dominance persisted over time, both before formal policies of Africanization began in the late 1920s, and as African hiring ratcheted up from the late 1940s. Accordingly, postindependence leaders inherited a civil service that had long been deeply ethnically-imbalanced.
Figure 5 shows ethnicities of African bureaucrats in the SSL and HSL over time. The senior bureaucracy expanded after 1900, increasing from 106 posts in 1897 to 906 senior bureaucrats in 1928. Between 1928 and 1948, buffeted by the Great Depression and then war, senior-level hiring stalled for two decades; total senior bureaucrats remained below 1,010 and only 5.6 new Ghanaian officers were hired to senior positions on average annually across departments—a small, but steady trickle into top ranks. Across this period, the Ga and Fante continued dominating, accounting for an overwhelming 83.1% of senior Ghanaian bureaucrats by 1948 (Ga 54.2% and Fante 28.9%), far in excess of their respective 3% and 11% of Ghana’s population.Footnote 26 After WWII, African hiring into the senior-most ranks picked up dramatically; from 1949 to 1955, there was an average increase of 166 new Ghanaian officers into the senior- and mid-level ranks every year. As this happened, Ga and Fante dominance remained.
Bureaucrat Ethnicity among Ghanaians in Senior and Hybrid Staff Lists
Note: The top panel shows the raw ethnic distribution, and the bottom panel shows the deviation from respective population shares. 2010 population proportions were: Asante (15.5%), Fante (11.2%), Akyem (3.1%), Akuapem (2.5%), Other Akan (13.3%), Ga (3.0%), Dangme (4.1%), Ewe (13.4%), Northern (29.1%), and Guan (1.2%). The figure drops all observations below the bottom 25th percentile in name distinctiveness.

Figure 5. Long description
The figure consists of two panels arranged vertically.
Top Panel: Ethnicity Distribution of Ghanaian Bureaucrats over Years, Senior and Hybrid List.
* The X axis represents Year from 1896 to 1956. The Y axis represents Proportion from 0 percent to 100 percent.
* The data is dominated by two groups: Ga (red dashed line with square markers) and Fante (solid teal line with triangle markers).
* From 1896 to 1924, Ga and Fante fluctuate wildly between 30 percent and 100 percent, often inversely related.
* After 1924, both groups show a gradual decline, with Ga ending near 35 percent and Fante near 38 percent by 1956.
* Other ethnicities including Akuapem, Asante, Dangme, Ewe, Northern, Other Akan, Akyem, and Guan remain near 0 percent until approximately 1928, after which they show slight increases, particularly Ewe which rises to roughly 12 percent by 1956.
Bottom Panel: Deviation of Ghanaian Bureaucrats from Ethnicity Population Share, Senior and Hybrid List.
* The X axis represents Year from 1896 to 1956. The Y axis represents Percentage Point Deviation from Population Share, ranging from negative 0.2 to 1.0.
* A horizontal dashed black line at 0.0 indicates parity with population share.
* Ga and Fante consistently remain above the 0.0 line, indicating overrepresentation. Ga peaks near 1.0 in the early 1900s before stabilizing between 0.3 and 0.5. Fante fluctuates between 0.1 and 0.6.
* Northern (dark red dash-dot line) is the most underrepresented group, remaining constant at approximately negative 0.29 throughout the period.
* Asante (light blue dashed line) and Other Akan (brown star line) also show consistent underrepresentation between negative 0.1 and negative 0.2.
* Ewe starts near negative 0.1 and trends upward toward the 0.0 parity line by 1956.
Figure 5 also shows from the late 1930s a small increase in representation of some other ethnic groups. For example, the Ewe went from 7.6% of senior bureaucrats between 1928 and 1945 to plateauing to around 11% between 1946 and 1955. The Asante began having some representation in the late 1940s, but still reached just 5.8% by 1955. But these groups were still underrepresented relative to their size: 13% and 16% of Ghana’s population, respectively. Northern groups, representing 29% of the population, were most severely underrepresented, never accounting for more than 2.4% of senior- or mid-level bureaucrats any year.
Although we only have complete data on junior positions for a more limited period—1936–45—a similar pattern of Ga and Fante dominance emerges (Section S6 of the Supplementary Material). Across 1936–45, Ga and Fante bureaucrats held the large majority of these positions, with Gas on average 43.0% and the Fante 28.3%. There is virtually no change in any group’s percentages year on year. While the Ewe hold steady around their share of the national population, the Asante, other Akan sub-groups, and Northerners are all heavily underrepresented.
We also identify African bureaucrats holding top positions within their departments. We use salary information to classify top bureaucrats, focusing on salaries in the top 10th percentile in each department (Section S6 of the Supplementary Material).Footnote 27 The vast majority (over 80%) of high-salaried African bureaucrats are either Ga or Fante throughout the entire period in which Africanization was occurring. As we describe further below, this likely provided officials from these groups with the ability to influence hiring within their departments. Other groups, such as the more populous Asante and Ewe, had few similarly well-placed high-ranked officials.
Ethnic “Lock-In” within Departments
Many studies note that some ethnic groups gained disproportionate access to state employment in former colonies (e.g., Lange Reference Lange2025; Ricart-Huguet Reference Ricart-Huguet2021). Conventional explanations for this dynamic are examined below and do help explain the very initial dominance of Ga and Fante bureaucrats. But we argue that persistent Ga and Fante overrepresentation was instead sustained through to independence via a previously unexplored process of patrimonial bureaucrat-led hiring, resulting from existing African bureaucrats’ private preferences to hire co-ethnics. We show that this is the most likely explanation by triangulating across a series of analyses.
Our first piece of evidence is the self-replication of ethnic hires within departments (ministries). Disaggregating by ethnicity, we analyze who gets hired each new year (time t) compared to the ethnic composition of existing staff (time
$ t-1 $
 ) in that same department. Figure 6 displays a strong positive association between the number of existing senior or mid-level staff each year from a given group and the entry of new senior- or mid-level staff from the same group in the same department the following year. This implies that wherever an ethnic group gained a foothold in senior ranks of a department, it used its position to hire (or promote) other co-ethnic applicants.
Current Employees and Co-Ethnic Hires in Each Department–Year
Note: The X-axis is the number of bureaucrats of a given ethnicity employed in a given department in the preceding year; the Y-axis is the number of new hires from that group in the same department in the following year. Each dot represents a department–year–ethnicity observation. Subset to the Senior and Hybrid Staff Lists. Drops all observations below the bottom 25th percentile on the name distinctiveness score.

Figure 6. Long description
The scatter plot features a horizontal X axis labeled Number of Employees in an Ethnicity in Year (t minus 1) in a Department, ranging from 0 to 40. The vertical Y axis is labeled Number of Co-ethnic New Hires in Year t in a Department, ranging from 0 to 15.
Data points are concentrated in the lower-left quadrant, specifically between 0 and 10 on the X axis and 0 and 5 on the Y axis, indicating many observations with low numbers of both existing employees and new hires. A blue linear regression line starts near the origin and rises with a positive slope toward the top-right. A gray shaded area representing the confidence interval surrounds this line, widening slightly as the X value increases.
In the top-left corner, a regression equation is printed: y = 0.106 plus 0.144 x, R squared = 0.31. Notable outliers include a single point at approximately X = 28, Y = 15, and several points between Y = 5 and Y = 10 scattered across the middle of the X axis range.
Figure 7 repeats Figure 6 broken out by ethnic group. Crucially, it shows a similar positive correlation both among the Ga and Fante and among most other groups too.Footnote 28 In fact, the serial correlation between prior and new hires within departments is even stronger among some other groups, such as the Asante and Ewe, than for the Ga. The ethnic lock-in pattern in Figure 6 is thus not unique to the Ga and Fante: many groups replicated themselves within departments once they had an initial foothold of senior staff. However, such behavior disproportionately favored the Ga and Fante because they had footholds in most departments the earliest.
Current Employee and Co-Ethnic Hires in Each Department–Year by Group
Note: Drops all observations below the bottom 25th percentile on the name distinctiveness score.

Figure 7. Long description
A multi-panel scatter plot grid with 10 panels. The X axis represents the Number of Employees in an Ethnicity in Year (t minus 1) in a Department, ranging from 0 to 40. The Y axis represents the Number of Co-ethnic New Hires in Year t in a Department, ranging from 0 to 15. Each panel includes a scatter plot, a linear regression line with a shaded confidence interval, and a regression equation with an R super 2 value.
* Panel 1 (Ga): y = 0.125 plus 0.119 x, R super 2 = 0.35. Shows a positive linear trend.
* Panel 2 (Fante): y = 0.027 plus 0.187 x, R super 2 = 0.35. Shows a positive linear trend.
* Panel 3 (Akuapem): y = 0.794 minus 0.706 x, R super 2 = 0.75. Shows a steep negative trend with very few data points near the origin.
* Panel 4 (Akyem): y = 0.0809 plus 0.139 x, R super 2 = 0.05. Shows a weak positive trend.
* Panel 5 (Asante): y = 0.229 plus 0.164 x, R super 2 = 0.17. Shows a positive trend.
* Panel 6 (Ewe): y = 0.0776 plus 0.169 x, R super 2 = 0.12. Shows a positive trend.
* Panel 7 (Dangme): y = 0.321 minus 0.0298 x, R super 2 is less than 0.01. Shows a nearly flat, slightly negative trend.
* Panel 8 (Northern): y = 0.574 minus 0.428 x, R super 2 = 0.24. Shows a negative trend.
* Panel 9 (Guan): y = minus 1 plus 1 x, R super 2 = 1.00. Shows a perfect positive correlation with two data points.
* Panel 10 (Other Akan): y = 1.5 minus 1.5 x, R super 2 = 0.89. Shows a steep negative trend.
While the lock-in pattern is already evident from these descriptive statistics, we also demonstrate path dependence using a regression pooling across list types. In Table 1, the dependent variable is the count of new hires at any rank in year t for group g in department d and the independent variable is the count of existing employees at the senior- or mid-level ranks of the same department from that same group, but in year
$ t-1 $
 . We also include a measure of the population-weighted average distance of group g to colonial schools as of 25 or 30 years earlier, to proxy for the group’s education access as of the time a new hire in year t would have been starting school.Footnote
29 By controlling for this, our results are independent of potential selection effects that result from inequality in education access. We also include fixed effects by ethnic group, department, and year, controlling for group-specific, department-specific, and year-specific patterns, to examine how marginal changes within groups and departments in the presence of senior bureaucrats and/or in (lagged) education access reflect in marginal changes in subsequent hiring. Standard errors are clustered by group, year, and department—the most conservative specification. We restrict to 1928–55, the only years for which we have a large number of African hires.Footnote
30
New Hires against Existing Senior Staff and Lagged School Access

Table 1. Long description
A table with 6 columns of data and 11 rows of variables. The outcome variable is New hires from group in year t.
* Row 1: Bureaucrats from group among senior staff (year t minus 1). Values are 0.079 super ** (column 1), 0.080 super ** (column 2), 0.061 (column 3), and 0.241 super * (column 6). Columns 4 and 5 are blank.
* Row 2: Standard errors for Row 1. Values are (0.019), (0.018), (0.034), and (0.086) respectively.
* Row 3: Average distance (km) to school for group (year t minus 25). Values are minus 0.008 (column 1), minus 0.080 (column 3), minus 0.003 (column 4), and minus 0.013 (column 6).
* Row 4: Standard errors for Row 3. Values are (0.010), (0.083), (0.005), and (0.013) respectively.
* Row 5: Average distance (km) to school for group (year t minus 30). Values are minus 0.008 (column 2) and minus 0.007 (column 5).
* Row 6: Standard errors for Row 5. Values are (0.006) and (0.005) respectively.
* Row 7: Years included. 1928 to 55 for columns 1, 2, 4, 5, and 6; 1936 to 55 for column 3.
* Row 8: Ethnic group F E s. Y for columns 1 through 5, N for column 6.
* Row 9: Department F E s. Y for all columns.
* Row 10: Year F E s. Y for all columns.
* Row 11: N (sample size). 5,929 (columns 1, 2, 6), 4,301 (column 3), 7,161 (columns 4, 5).
* Row 12: adj. R super 2. 0.197 (columns 1, 2), 0.202 (column 3), 0.144 (columns 4, 5), 0.176 (column 6).
Note:
$ {}^{\dagger } $
 p < 0.10; *p < 0.05; **p < 0.01; and ***p < 0.001. The unit is the ethnic group–department–year. Column 3 restricts to years for which both Senior and African Staff lists (1936–45) and/or the Hybrid Staff list (1947-) are available. OLS regressions with standard errors clustered by ethnic group, department, and year. Results in row 1 with two- or one-way SE clusterings have smaller p-values. Under three-way clustering, the p-value for the coefficient in row 1 of column 3 is 0.104, but this becomes highly statistically significant when using one- or two-way clustering (e.g., by department and ethnic group). Note, however, that the more restricted data in column 3 are technically too sparse for three-way clustering, which results in an automated regularization of the standard errors that varies based on which R package is used. All bureaucrats in the bottom 25th percentile of name distinctiveness are dropped in all columns.
The pattern in Table 1 is again clear: each additional bureaucrat among the senior- or mid-level staff from a given ethnic group in a given department in a given year predicts an additional 0.06–0.24 members of that group were hired into that department (at any rank) the subsequent year. This pattern is suggestive of relatively senior African bureaucrats influencing their agencies to hire group members. Importantly, this result does not depend on the group fixed effects (column 1 vs. column 6), suggesting it is not specific to the Ga and Fante alone, but a more general pattern. Moreover, changes in group-specific exposure to education at the time bureaucrats likely began schooling are consistently uncorrelated with marginal changes in future hiring, including when put in alone as a predictor (columns 4 and 5). This suggests that shifts in hiring patterns are not explained by shifts in education access—discussed further below.
Archival Evidence of Bureaucrat-Led Hiring
Ethnic “lock-in” within departments was likely facilitated by how hiring was structured. We examine the extensive correspondence among British officials about African hiring in Ghana’s National Archives, spanning the 1930s through early 1950s. These materials establish three important facts. First, many hiring and promotion decisions for Africans were decentralized to departments. Second, as a result, incumbent bureaucrats had points of discretion to shape hiring. Third, these bureaucrats sometimes abused these powers—and the British were aware of the problem.
Evidence of decentralization comes from materials that show that prospective employees were instructed to apply directly to departments, without a centralized screening process.Footnote 31 The archives include a large volume of handwritten letters from African applicants to top British officials asking about vacancies, with attached originals of exam certificates and (again often handwritten) reference letters. While unqualified applicants were rejected outright, most instead received a curt letter returning their documents and stating that they must write to each state department separately to inquire about jobs.Footnote 32 An exception applied to African clerical staff (First and Second Division Clerks), a narrow stratum of the total civil service, appointed, promoted, and rotated among departments by a central Selection Board (or Promotion Board) staffed by three senior British officials.Footnote 33 But memoranda from this committee demonstrate that these British officers had little independent information about most prospective African clerks, appearing to mostly act on recommendations of department heads, recommendations in turn based on qualitative evaluations relayed upward from conversations with subordinates within each department.Footnote 34
This largely decentralized process should have provided discretion to existing Africans within departments to influence future hiring and promotions by helping to identify and screen potential recruits, as well as in subjective advice and performance evaluations about candidates provided to department heads. As one example, a 1947 memo to customs collectors explicitly instructs that “they should obtain [African] recruits themselves” [emphasis added] for their individual customs offices, and were provided with a list of job applicants who had written to the department head and told to make contact with them “when vacancies occurred” without first working through the head office.Footnote 35
The need to apply to individual departments should have facilitated existing bureaucrats’ discretion by ensuring that information on vacancies was fragmented. These bureaucrats could presumably provide privileged information about vacancies in their departments to preferred recruits. Indeed, that so many applicants painstakingly compiled their documents by hand and wrote directly to central British officials to ask about vacancies, only to be immediately informed this was an invalid way to apply for jobs in the first place, suggests that full information about vacancies did not circulate widely, even among these educated Ghanaians. And the need to then apply across several dozen departments separately, attaching originals of your references and school and exam certificates in the hope there might be a vacancy, erected time-consuming barriers to entry for applicants who lacked inside information.
Finally, the archival materials show that bureaucrats were known to exploit this discretion to achieve hiring outcomes at odds with British intentions. The Colonial Secretary observed in a 1938 bulletin: “Cases have been known to occur in the subordinate ranks of the service in which an African officer’s colleagues required or received from him on his first appointment or promotion a sum of money, gift, or entertainment.”Footnote 36 Although the reason attributed to bureaucrats’ actions in this quote is a distinct, but related motivation for corruption than what we propose (rent extraction vs. social favoritism), the statement exemplifies the same principal–agent dilemma: a top principal explicitly admitting that African agents within departments were using their influence to deviate from merit-based procedures when selecting and promoting other African staff.
Evidence of Ethnic Bias Conditional on Merit
Further evidence consistent with bureaucrat-led ethnic favoritism is that Ga and Fante applicants appear to have been favored over applicants from other groups even when they performed similarly on formal examinations for entry into the bureaucracy.
Between 1906 and 1930, Gold Coast colonial yearbooks list names of individuals who passed civil service examinations to qualify as teachers and agricultural trainers and (often) their rank scores relative to others who passed.Footnote 37 We digitize these lists to obtain data on 111 unique exam sittings by 2,423 unique qualifiers. We assign each qualifier a most likely ethnicity and match against our staff lists, observing which qualifiers were subsequently hired into the central bureaucracy. Unsurprisingly, the most common state posts were as teachers (52%) or agriculture officers (8%), but we also find that 40% of those subsequently hired were employed across a wide range of additional departments. Successful examinees were eligible for many positions, as a teaching exam certification was listed among the formal educational qualifications for broader civil service employment.Footnote 38 We take individual performance on these exams as a general indicator of merit—an indicator the British themselves created for this purpose—and explore subsequent hiring.Footnote 39
Figure 8 visualizes the pool of exam candidates, disaggregated by ethnic group, indicating both exam ranks (scores) and whether each examinee subsequently appeared in staff lists (highlighted by
$ \blacktriangle $
 ). The horizontal bars indicate the average exam rank of hired bureaucrats from each group. These data can help draw conclusions about supply- and demand-side explanations for hiring.
Distribution of Exam Ranks (1906–30) and Subsequent State Hiring Status by Group
Note: Each dot is an exam candidate; triangles are those matched to a subsequent staff list. Horizontal bars indicate the average (mean) rank of hired candidates. Note that these means are calculated from very few observations in groups that experienced little hiring.

Figure 8. Long description
The Y-axis is labeled Exam Rank Percentile ranging from 0.00 to 1.00. The X-axis is labeled Ethnicity with ten categories. Data is presented as vertical clusters of circles for non-hired candidates and triangles for hired candidates.
From left to right, the groups are:
* Akuapem: Sparse circles, no triangles, no average bar.
* Akyem: Sparse circles, one triangle near 0.50, average bar at 0.48.
* Asante: Moderate density, two triangles near 0.95, average bar at 0.73.
* Dangme: Moderate density, several triangles between 0.40 and 0.65, average bar at 0.58.
* Ewe: High density, many triangles throughout, average bar at 0.64.
* Fante: High density, many triangles throughout, average bar at 0.54.
* Ga: High density, many triangles throughout, average bar at 0.53.
* Guan: Very sparse, one circle, no triangles, no average bar.
* Northern: Sparse circles, several triangles, average bar at 0.45.
* Other Akan: Sparse circles, one triangle near 0.10, average bar at 0.10.
A legend on the right identifies the ten ethnicities by color and recruitment status by shape: open circle for 0 (not recruited) and solid triangle for 1 (recruited).
On the supply side, Figure 8 indicates a clear overrepresentation of Ga and Fante among successful examinees (total number of dots by group). Among those who passed exams across these years, 35.0% were Fante and 17.8% were Ga, significantly higher than their 11% and 3% of the population. It is unlikely that this overrepresentation is merely the result of greater access to schooling; while the Ga and Fante initially had greater education access, other groups who later experienced rapid increases in school access never caught up in success on these exams. Gas and Fantes comprise 58.2% of successful examinees in the 1900s, 55.5% in the 1910s, and still 50.4% in the 1920s. Over these decades, the Ga and Fante had stopped being any nearer to schools than, for example, Akyems and Akuapems. However, the proportion of Akyem and Akuapem among successful examinees instead fell, from 4.2% in the 1900s to just 1.7% in the 1920s, even as school access increased. Similarly, the proportion of Asante examinees declined from 6.7% in the 1900s to 5.7% by the 1920s, despite steadily increasing school access.Footnote 40
One potential explanation for this oversupply is the development of cultural norms such that members of some groups particularly aspired to gain state employment. Such norms could have been culturally-reinforced by a history of early access to schooling or state jobs. Alternatively, they may have been due to differences in outside economic opportunities. For example, the Ewe may have been particularly overrepresented among successful examinees, while the Asante were particularly underrepresented, because Ewe areas largely lacked cash crop agriculture, while educated Asante (and Akyem and Akuapem), living in the heart of colonial Ghana’s cocoa economy, may have had less overall need to seek state employment.Footnote 41
But regardless of why some groups became oversupplied among test takers, evidence on hiring demand is where support for ethnic favoritism within the bureaucracy becomes most apparent. The exam data show that demand for Ga and Fante to enter the public sector is disproportionally high even conditional on exam performance. The Ga and Fante represent a startling 31.0% and 43.3% of successful examinees eventually hired, an additional 13.1 p.p. and 8.3 p.p. above their already overrepresented share of those passing the civil service exams. By contrast, and consistent with significant hiring bias on the demand side, despite comprising 25.9% of successful examinees between 1906 and 1930, the Ewe are just 10.5% of hired examinees, a drop of 15.4 p.p. and apparent evidence of significant hiring discrimination. The Asante too had 3.2 p.p. fewer bureaucrats hired, even relative to their small 5.5% of passing examinees. This bias conditional on exam performance persists equally among examinees hired as teachers and agricultural workers, and across those hired into various other state departments. It also cannot be explained by the locations of jobs, such as teaching positions at government-run schools (Section S12 of the Supplementary Material).
Analyzing each exam candidate’s performance relative to their cohortmates at the same exam sitting further emphasizes demand-side bias. The median Ewe hired after passing an exam ranked at the 67th percentile in their exam sitting; the median Asante ranked at the 94th percentile. By contrast, the median Fante hired ranked at the 59th percentile and the median Ga hired ranked at just the 53rd percentile, showing that more mediocre Ga and Fante candidates received jobs over more qualified Ewe and Asante candidates. Most other groups in Figure 8 had so few (or none) of their successful examinees even hired (e.g., just one Akyem, and zero Akuapem) that a comparison of exam ranks among hired bureaucrats is uninformative.
Overall, these data suggest exam performance did not purely guide selection, supporting the idea that nominally-meritocratic institutions were exactly that: examinations gave an appearance of meritocracy, consistent with the de jure priorities of British principals, but in fact, selection was based on other attributes.
Nepotistic Hiring among Euro-African Families
Another piece of evidence for insider capture comes from the further overrepresentation of particular families within the Ga and Fante. As noted above, the earliest opportunities for Western education in the precolonial Gold Coast (seventeenth and eighteenth centuries) were for Africans with mixed European descent, creating high-status families within Ga and Fante society who maintained European surnames into subsequent generations.Footnote 42 Historical sources make clear that these Euro-African families were the very first to be hired into the colonial state in the nineteenth century (Parker Reference Parker2000; von Hesse Reference von Hesse2024). To the extent that any African officials had the ability to use an initial foothold in the colonial state to then employ their own relatives or other close social ties in further positions through nepotistic insider hiring, it was these families.
In Section S9 of the Supplementary Material, we document just this: each additional Ga or Fante bureaucrat from a Euro-African family at a senior- or mid-level position in the past year is a strong correlate of an additional new hire from a Euro-African family within that same state department in the next year, consistent with socially-driven hiring among job seekers from the same narrow social stratum.
ALTERNATIVE ARGUMENTS
Support for our interpretation that ethnic “lock-in” results from bureaucrat-led hiring also emerges from ruling out three major alternative explanations. First, unequal education could explain hiring. Second, these patterns may reflect proximity to physical offices of the state. Third, these patterns could reflect principals’ strategic preferences to prioritize certain groups. However, all three possibilities cannot account for the above patterns.
Ethnic Inequality in Education
Many scholars argue ethnic inequality in colonial hiring was a consequence of inequality in Western education (Johnson-Kanu Reference Johnson-Kanu2021; Lange Reference Lange2025; Mazrui Reference Mazrui1978; Ray Reference Ray2018; Ricart-Huguet Reference Ricart-Huguet2021).Footnote 43 Education reached groups unevenly because of differences in proximity to the coast and other zones of investment (Ricart-Huguet Reference Ricart-Huguet2022), as well as differences in the spread of missionaries (Frankema Reference Frankema2012; Jedwab, Selhausen, and Moradi Reference Jedwab, Selhausen and Moradi2022). With ethnic differences in the supply of qualified candidates, inequality in employment can still be consistent with meritocracy (Kuipers Reference Kuipers2025).
This surely accounts for at least one pattern in Figure 5: the enormous underrepresentation of Northerners cannot be separated from the near-total absence of schools throughout the Northern Territories until the 1950s (Figure 2 above; Grischow Reference Grischow2006; Nathan Reference Nathan2023). Evidence that education accounts for other groups’ hiring is less compelling. As detailed above, the Ga and Fante enjoyed the greatest initial education access in the nineteenth century and before, which partly explains why they were the very first to be hired at these earliest moments of state-building. But these groups’ early advantages are causally overdetermined. The Ga and Fante also initially benefited from their especially fortuitous locations, proximate to the earliest zones of formal British control. For example, Euro-Ga elites already were “in on the ground floor” of the colonial state in Accra from the 1850s in a quite literal sense: they were the British government’s landlords, leasing their homes for state offices and residences (von Hesse Reference von Hesse2024, 4). Meanwhile, regardless of education, at the start of our data in 1897, groups like the Asante mechanically could not have had similar access to jobs because they were not formally incorporated into the colony for another few years.
But the continued dominance of the Ga and Fante deep into the twentieth century remains more puzzling. The exam data above already clearly show that ethnic differences in hiring cannot be fully accounted for by the supply of qualified candidates per group. Moreover, combining the schools data in Figure 2 with geolocated ethnic census data, Table 2 displays the population-weighted average distance of each group to schools between 1894 and 1932.Footnote 44 Using birth dates, we calculate that the typical civil servant was hired in their mid-to-late 20s. Accordingly, we use the availability of primary schools 25 years before a hiring decision to proxy for the supply of educated candidates. Multiple other ethnic groups in Southern Ghana caught up in education access in the early twentieth century. But state hiring never updated, even as the vast majority of African hiring occurred between the 1930s and 1950s.
Approximate Average Distance (km) to the Nearest Primary School by Ethnic Group

Table 2. Long description
The table consists of 8 columns. The first column lists the Ethnic group, followed by seven columns for the years 1894, 1906, 1909, 1914, 1921, 1927, and 1932. All values represent distance in kilometers.
* Akuapem: 15.73 in 1894, decreasing to 4.53 in 1932.
* Akyem: 17.01 in 1894, decreasing to 2.77 in 1932.
* Asante: 45.32 in 1894, decreasing to 8.12 in 1932.
* Dangme: 12.36 in 1894, decreasing to 6.34 in 1932.
* Ewe: 25.19 in 1894, decreasing to 6.46 in 1932.
* Fante: 11.02 in 1894, decreasing to 3.17 in 1932.
* Ga: 6.04 in 1894, decreasing to 3.18 in 1932.
* Guan: 56.42 in 1894, decreasing to 3.70 in 1932.
* Northern: 248.95 in 1894 and 1906, then dropping significantly to 82.14 in 1909 and reaching 31.68 by 1932.
* Other Akan: 36.84 in 1894, decreasing to 12.34 in 1932.
Overall, every group shows a consistent downward trend in distance to the nearest school over the 38-year period.
Table 2 shows that while the Ga and Fante had the best school access in 1894, this advantage soon dissipated. By 1909, the Akyem and Akuapem had become almost as close to schools. By 1921, the Akyem had pulled even, and by 1927, when many bureaucrats hired in the 1950s would have begun school, schools were more numerous in Akyem territory than Ga or Fante areas. The typical member of every other group except Northerners and Other Akans was, on average, now within walking distance of a school. And yet, there is little evidence in Figure 5 or Section S6 of the Supplementary Material that future hiring kept pace, a descriptive pattern we already confirmed above via multivariate regression (Table 1). For example, by 1954, 45 years after the Akyem had reached virtual parity with the Ga in proximity to schools, just 1.4% of Africans in the HSL were Akyem, compared to 38.5% Ga, even as the groups have identical population sizes (both 3% nationally).
In addition, in Figure 9, we also rule out that differences in hiring could be due to differences in school quality. Digitizing annual Education Department reports available from 1906 to 1932 that provide exact enrollment numbers and total operating budgets for primary schools, including the mission schools,Footnote 45 we calculate expenditure per pupil across the schools in each ethnic group’s home region to proxy for school quality. There is no evidence that Ga and Fante areas had systematically better schools, even very early in the twentieth century. School quality instead appears quite similar across groups, and, if anything, the Fante had among the colony’s worst-funded schools despite dominating civil service hiring.
Expenditure (Quality) by School Location
Note: British pounds per enrolled student at primary schools at four snapshots in time. Each individual school (gray dot) is geolocated and categorized by the local ethnic majority in that community. The central bar in each box plot shows mean expenditure per school per ethnic group; the black diamond instead weights the mean by school size, to show mean expenditure per pupil per group.

Figure 9. Long description
The four panels are arranged chronologically. Each panel uses a y-axis labeled Pounds per pupil and an x-axis listing ethnic groups. Individual schools are represented by gray dots, while colored box plots show the distribution. A horizontal line in each box indicates the mean, and a black diamond indicates the mean weighted by school size.
* Top-left panel (1906): The y-axis ranges from 0 to 2.5. Groups from left to right are Ewe, Akuapem, Other Akan, Asante, Akyem, Fante, Ga, and Dangme. Expenditure is generally below 1.5 pounds, with Dangme showing the highest weighted mean.
* Top-right panel (1914): The y-axis ranges from 0 to 3. Groups are Fante, Ga, Other Akan, Akyem, Akuapem, Ewe, Dangme, and Asante. Asante shows the highest weighted mean, exceeding 1 pound.
* Bottom-left panel (1927): The y-axis scale increases significantly, ranging from 0 to 10.0. Groups include Guan, Ewe, Ga, Akyem, and Dangme. Most weighted means cluster between 2.5 and 5.0 pounds, with Dangme remaining the highest.
* Bottom-right panel (1932): The y-axis scale increases further, ranging from 0 to 20. Groups include Guan, Fante, Ewe, Ga, Asante, Akuapem, Other Akan, Akyem, Northern, and Dangme. While most schools cluster below 5 pounds, several outliers in the Dangme and Ewe groups reach between 10 and 20 pounds.
Geographic Proximity to State Offices
Another possible explanation concerns distances to state offices. A challenge in explicitly assessing a proximity mechanism is that virtually all staff lists we digitize list job titles, not locations. However, we can cast doubt on this possibility in several ways.
First, the capital shifted from Cape Coast to Accra in 1877, along with most state jobs (Parker Reference Parker2000, 121). As indigenes of Accra, it may seem natural that the Ga would have become overrepresented among state employees. However, the same is not true of the Fante, whose main population mass (around Cape Coast) lies further from Accra than those of several other groups, such as the Akyem, Dangme, and Akuapem that already had similar education access prior to the main Africanization period.Footnote 46 These groups are more proximate, yet remained underrepresented.
Second, Ga and Fante bureaucrats were also vastly overrepresented in both desk-based jobs in Accra and field-based jobs that would have been spread elsewhere throughout the colony. Without location information in the staff lists, we classify job titles in terms of whether they were likely desk-based or field-based jobs.Footnote 47 Examples of field-based jobs include teachers, postal workers, and nurses. On average, there are more Gas and Fantes in desk-based than field-based jobs, which suggests proximity influenced hiring at least to some extent: 74.8% of desk-job holders are Ga or Fante compared to 56.9% of field-job holders. Yet the extremely large share of Ga and Fante workers in field jobs relative to their combined population size (14%) still strongly implies that a proximity-based explanation remains insufficient.
Third, in Section S12 of the Supplementary Material, we can directly compare the geographic location of jobs to the ethnicity of state employees for the hiring of government teachers in a way that we cannot for other types of civil servants. We confirm that Ga and Fante government teachers were hired in excess of the proportion of government schools located in Ga and Fante communities, providing clear evidence that hiring did not simply reflect the ethnic breakdown of workplace locations.
Finally, the colonial state expanded significantly in complexity and geographic footprint over time, with new departments coming online and new state institutions (e.g., clinics and post offices) opening continually further into the interior. If jobs were a function of location, we should expect a strong upward trend in employment of non-coastal groups. But Ga and Fante dominance remains virtually constant (Figure 5 and Section S6 of the Supplementary Material).
British Ethnic Preferences
A final possibility is that British principals had strategic preferences for Ga and Fante employees, potentially perceiving them as more loyal or competent. For example, Ray (Reference Ray2018; Reference Ray2019) and Lange (Reference Lange2025) suggest that British colonial leaders often favored historically weak, especially precolonially non-centralized, ethnic groups for key posts to offset the existing strength of groups that had precolonial states.
We cast doubt on this possibility in several ways. Most directly, Ray (Reference Ray2018; Reference Ray2019) and Lange’s (Reference Lange2025) theory of British strategy would explicitly not predict the Ga and Fante dominance we observe: unlike some other Ghanaian groups (Nathan Reference Nathan2023), both the Ga and Fante were centralized in the precolonial period; the Fante, in particular, came from a well-established state. To our knowledge, historical literature on Africanization in the Gold Coast also does not document such a preference (e.g., Rathbone Reference Rathbone2000; Shaloff Reference Shaloff1974). We also found no evidence of it in the materials on hiring in Ghana’s National Archives: it is notable that across the many hundreds of documents we reviewed discussing African hiring and promotions, we found zero mentions of anyone’s ethnicity. If the British did have an explicit and sustained preference for these groups, it is reasonable to expect they would have discussed it internally.Footnote 48
More indirectly, we assess observable implications of such a preference. First, the archival documents described above demonstrate that senior British officials took an active role in hiring and promotion decisions for the minority of African employees who were First or Second Division Clerks, while leaving other decisions decentralized to individual departments. But in Section S13 of the Supplementary Material, we show that the Ga and Fante are still heavily overrepresented across positions for which hiring was not handled centrally and also that the overrepresentation of Fante bureaucrats, in particular, is higher for jobs not directly selected by top British leadership, seemingly inconsistent with this bias only occurring due to these same officials’ top-down directive.
Second, if a top-down directive existed, hiring should have been sensitive to changes in the principals overseeing the process. Until 1951, Africanization was conducted under the ultimate command of British officials. Starting from 1952, before independence in 1957, senior authority passed to Kwame Nkrumah’s new CPP government. The CPP leadership primarily came from other ethnic groups, and Nkrumah (an Nzema; “Other Akan”) viewed existing African civil servants (the large majority of whom were Ga or Fante) as part of his opposition (Zolberg Reference Zolberg1966, 71), such that he had little incentive to continue favoring Ga or Fante hires. Yet in Figure 10, we find no sharp discontinuity in ethnic hiring across the 1951–52 transfer in power: the right panel shows that Ga and Fante were similarly overrepresented as a proportion of new hires regardless of which principal led the process.Footnote 49 This relative stasis in new hiring meant little meaningful aggregate shift in the years after Nkrumah took internal power in the overall proportion of Ga and Fante in the central bureaucracy (left panel), inconsistent with their overrepresentation having been due to top-down British orders to favor them.
Distribution of Ethnicity among Ghanaian Bureaucrats around 1951
Note: Drops all observations below the bottom 25th percentile on the name distinctiveness score.

Figure 10. Long description
A two-panel line graph. Both panels share a horizontal X axis representing Year from 1946 to 1955 and a vertical Y axis representing Proportion. A vertical dashed line marks the year 1951 in both panels.
Left Panel: All Employed Bureaucrats.
* The Ga group starts as the highest proportion at approximately 50 in 1946, peaks near 55 in 1947, then steadily declines to about 35 by 1955.
* The Fante group starts at approximately 30 and shows a gradual upward trend, ending near 35, converging with the Ga group.
* The Ewe group remains relatively stable between 10 and 15.
* Other groups including Asante, Dangme, Northern, Akuapem, Akyem, Guan, and Other Akan remain clustered near the bottom, generally below 10.
Right Panel: Newly Hired Bureaucrats.
* The Ga group begins at 100 in 1946, drops sharply to 50 in 1947, and continues a volatile decline to approximately 30 by 1955.
* The Fante group starts at 50 in 1947, fluctuates significantly with a dip in 1949, peaks near 45 in 1951, and ends around 30.
* The Ewe group shows high volatility, ranging from near 5 to 20.
* Other ethnic groups remain low, mostly under 10, with slight increases in the Asante and Dangme proportions toward the end of the period.
Third, other accounts of strategic efforts to favor specific groups in hiring suggest such preferences should be visible in variation across positions, departments, or time. For example, groups perceived as inherently more loyal should be privileged for key security or administrative posts (Harkness Reference Harkness2018; Hassan Reference Hassan2017; Reference Hassan2020; Ray Reference Ray2012), or assigned to higher-rank jobs. Similarly, assuming British leaders’ most pressing local threats must have evolved across our long time series, we would expect the groups favored in hiring to have changed as well (Hassan Reference Hassan2020).
Yet in Figure 11, we see no systematic pattern in other groups’ presence across departments of varying strategic importance, while the Ga and Fante dominate across the board.Footnote 50 Ga and Fante bureaucrats are not differentially concentrated in core security or administrative departments most vital to law and order or political governance. They were also actually less overrepresented in departments concerned with agricultural production and customs—the primary revenue streams sustaining British rule—than in other less vital parts of the state.Footnote 51 Ga and Fante dominance also holds across both senior (Figure 5) and junior (African staff list; Section S6 of the Supplementary Material) roles, and at all tiers of the salary distribution—a pattern inconsistent again with British prioritization of groups thought most competent for higher-rank positions.
Distribution of Ethnicity among Ghanaian Bureaucrats by Strategic Importance of Department
Note: Drops all observations below the bottom 25th percentile on the name distinctiveness score.

Figure 11. Long description
The chart consists of three vertical panels. The Y-axis represents Proportion from 0 to 100 percent. The X-axis for each panel compares High and Low strategic importance. A legend on the right identifies ten ethnicities. From bottom to top, the stacked categories are: Other Akan (grey), Guan (tan), Northern (dark red), Dangme (purple), Ewe (orange), Asante (light blue), Akyem (dark green), Akuapem (yellow), Fante (teal), and Ga (pink).
* Agricultural Panel: In the High importance bar, Fante and Ga occupy the top 65 percent. In the Low importance bar, the Fante proportion increases significantly, while the Asante and Ewe proportions remain relatively stable.
* Governance Panel: The distribution is more uniform between High and Low importance. Ga and Fante combined consistently occupy the top 75 percent of the bars.
* Law and Order Panel: Similar to Governance, the Ga and Fante ethnicities dominate the upper half of the proportion. The Ewe and Northern groups show slightly higher concentrations in the bottom 25 percent compared to the Agricultural sector.
Across all panels, Ga and Fante consistently represent the largest proportions, while groups like Guan and Other Akan represent the smallest slivers at the base of each bar.
IMPLICATIONS FOR POSTINDEPENDENCE POLITICS
Similar to many other postcolonial settings in which ethnic grievances sparked by uneven colonial state-building led to postcolonial competition and conflict (Kuipers Reference Kuipers2025; Lange Reference Lange2025; Ray Reference Ray2018; Reference Ray2019; Wimmer Reference Wimmer2013b), the already ethnically-captured and non-meritocratic central state inherited at independence created challenges for Ghana’s immediate postindependence leaders, who struggled to dismantle existing hiring practices and create more diverse institutions.
Ethno-regional opposition parties quickly formed partly in response to their exclusion from state institutions, centered around three disadvantaged groups. Anticipating marginalization under a strong postindependence government, the Asante-led, pro-federalist National Liberation Movement (NLM) emerged in 1954, also drawing support from other major Akan groups (e.g., the Akyem). The NLM was sustained at the grassroots by educated, but underemployed Asante who were frustrated by their exclusion from both traditional power structures and the civil service (Allman Reference Allman1990; Reference Allman1993). Similarly, the Northern People’s Party (NPP) pushed for greater Northern inclusion in national institutions, while Ewe elites established the Togoland Congress and Anlo Youth Association, mobilizing around (ultimately failed) 1956 UN-sponsored referendum on secession of Togoland, the core Ewe area (Austin Reference Austin1964; Skinner Reference Skinner2015).
Confronted with these widespread ethnic grievances, Ghana’s new leaders attempted to address imbalances in state institutions. In the early 1960s, Nkrumah’s government pivoted toward explicitly recruiting more personnel from then-marginalized groups (Adei Reference Adei and Agyeman-Duah2008), especially the Akan, into both the bureaucracy and military (Harkness Reference Harkness2018)—efforts at rebalancing that future scholars would instead (erroneously in our view) cite as examples of new ethnic patrimonialism (e.g., Adei Reference Adei and Agyeman-Duah2008; Zolberg Reference Zolberg1966). Nonetheless, given the large accumulated stock of Ga and Fante bureaucrats, their advantages proved fairly durable, as suggested by a 1968 staff list produced a decade after independence (Republic of Ghana 1968).
Ethnic imbalances in the central state also had implications for political stability, as disgruntled, educated youths unable to find central state employment instead joined the army, an institution where Ga and Fante advantages were less entrenched. While the army’s rank-and-file was predominantly Northern (Ray Reference Ray2012, 565), a consequence of British assumptions that uneducated Northerners made better soldiers (Harkness Reference Harkness2018, 146), the officer corps was more diverse. Educated Ewe, in particular, had joined the army in large numbers in the 1950s. Consistent with our exam data above, Hutchful (Reference Hutchful1985, 168) notes that “an important factor that made the Army appealing to Ewe
$ \dots $
 was the limited opportunities for educated youth,” as other “government departments” could not “offer employment that met the aspirations of [Ewe] school leavers.” In response to the resulting ethnic imbalances, Nkrumah attempted to diversify the officer corps by also incorporating more Akan (including Asante) officers (Harkness Reference Harkness2018). Yet this strategy backfired, as the new Asante and Ewe officers ultimately (briefly) united to depose him (Asante and Gyimah-Boadi Reference Asante and Gyimah-Boadi2004). Ghana then cycled through multiple further military coups and purges from the state.
Thus, despite Nkrumah’s efforts at ethnic inclusion, entrenched patterns of dominance contributed to instability, and sparked further struggles for ethnic rebalancing. After the Asante and Ewe coup plotters fell out and Asante elites consolidated control in the late 1960s, new attempts to increase Akan representation sparked fears of exclusion among other groups. Under the Busia government (1969) more than 560 civil servants—predominantly Ewe and Ga—were dismissed in an effort to reverse their bureaucratic power, another case cited as evidence of new patrimonial practices in the bureaucracy (Asante and Gyimah-Boadi Reference Asante and Gyimah-Boadi2004).
The exact manner in which legacies of patrimonialism in colonial-era hiring shaped postindependence politics is no doubt a function of a wider set of factors that varied across African cases. Among others, this includes the overall extent of Africanization prior to independence, the resulting level of ethnic (im)balance in hiring, whether the initial postcolonial leader was from the same group(s) favored or excluded from the colonial bureaucracy, and how these distributions of power corresponded to overall demographic and economic conditions. But the Ghanaian experience elucidates the broader insight that the manner in which the nascent bureaucracy was staffed in the colonial period cannot be separated from our understanding of a country’s immediate postindependence political contestation over who controlled the state.
CONCLUSION
This article theorizes public sector recruitment and argues that bureaucrats’ preferences in hiring will outweigh those of politicians when politicians lack social connections to the communities they govern and have relatively low intensity preferences about who to hire. Both social distance and weak preferences exacerbate principal–agent problems in recruitment by making it more difficult for politicians to overcome information asymmetries with existing bureaucrats. Digitizing colonial records of bureaucrats in Ghana under British colonial rule and using a novel method to link individuals to ethnic groups, we reveal the overwhelming dominance of bureaucrats from two small ethnic groups. We argue that this dominance was the result of first-mover advantages combined with bureaucrat-led insider capture, with groups with more existing bureaucrats at high ranks within state departments able to hire more of their own regardless of formal policies of meritocracy.
Our work is not the first to observe ethnic disparities in colonial hiring (Johnson-Kanu Reference Johnson-Kanu2021; Kuipers Reference Kuipers2025; Lange Reference Lange2025; Ray Reference Ray2012; Ricart-Huguet Reference Ricart-Huguet2021). But our key contribution is to propose a novel explanation for why this imbalance occurred. In addition to arguing that imbalances resulted from strategic British preferences (e.g., Harkness Reference Harkness2018; Lange Reference Lange2025), the most common explanation in existing literature is that colonial inequality in access to education drove colonial hiring (Johnson-Kanu Reference Johnson-Kanu2021; Kuipers Reference Kuipers2025; Lange Reference Lange2025; Mazrui Reference Mazrui1978; Ray Reference Ray2018; Ricart-Huguet Reference Ricart-Huguet2021). We suggest, however, that when using richer data than previously available to unpack dynamics in hiring within the colonial period against dynamics in the development of colonial education systems, this common explanation may not always retain the power its proponents claim. Even in settings with stronger ethnic educational inequalities than Ghana, particularly those that were non-settler colonies, our theory suggests bureaucrat-led ethnic lock-in may have played a previously-unexplored role in explaining ethnic imbalances. We leave it to future work to investigate evidence for bureaucrat-led ethnic lock-in across other cases.
Our results also suggest the need to update conventional wisdom about postcolonial leaders as the chief orchestrators of ethnic packing within the central state after independence. Postcolonial central bureaucracies were not blank slates upon which new leaders built. Instead, many leaders inherited packed bureaucracies. They then faced the challenge of both building the public sector and dismantling existing biases. As they did so, postcolonial bureaucracies sometimes became less ethnically homogeneous over time (Hassan Reference Hassan2020), challenging standard accounts of rampant postcolonial favoritism.
More generally, fruitful avenues for future work also include developing a deeper understanding of the strategies that bureaucrats take to informally influence hiring outcomes. We also hope that our analysis stimulates further research using contemporary data to classify the relevant social identities of bureaucrats in prior periods, thereby developing a deeper understanding of how historical events may continue to shape modern states.
SUPPLEMENTARY MATERIAL
To view supplementary material for this article, please visit https://doi.org/10.1017/S0003055426101993.
DATA AVAILABILITY STATEMENT
Research documentation and data that support the findings of this study are openly available at the American Political Science Review Dataverse: https://doi.org/10.7910/DVN/SDH31B. Limitations on public availability of three raw datasets are discussed in the Supplementary Material (Section S15).
ACKNOWLEDGMENTS
We thank Kweku Darko Ankrah, Benjamin Ayamga, Ruth Okumko, Manasi Rao, Katharin Tai, Michael Thompson-Brusstar, Erik Williams, Patrick Wu, and, especially, Naomi Tilles for research assistance. Jeremy Bowles, Mai Hassan, Nicholas Kuipers, Carl Müller-Crepon, Carles Boix, and the anonymous reviewers, and participants at EPSA, IE University, Universidad Carlos III de Madrid, the London School of Economics and Political Science, MIT Global Diversity Lab, and WGAPE at Ohio State University provided helpful comments on earlier versions.
FUNDING STATEMENT
Funding for initial digitization was provided by a University of Michigan LSA Social Science Research Award.
CONFLICT OF INTEREST
The authors declare no ethical issues or conflicts of interest in this research.
ETHICAL STANDARDS
The authors affirm this research did not involve human participants.


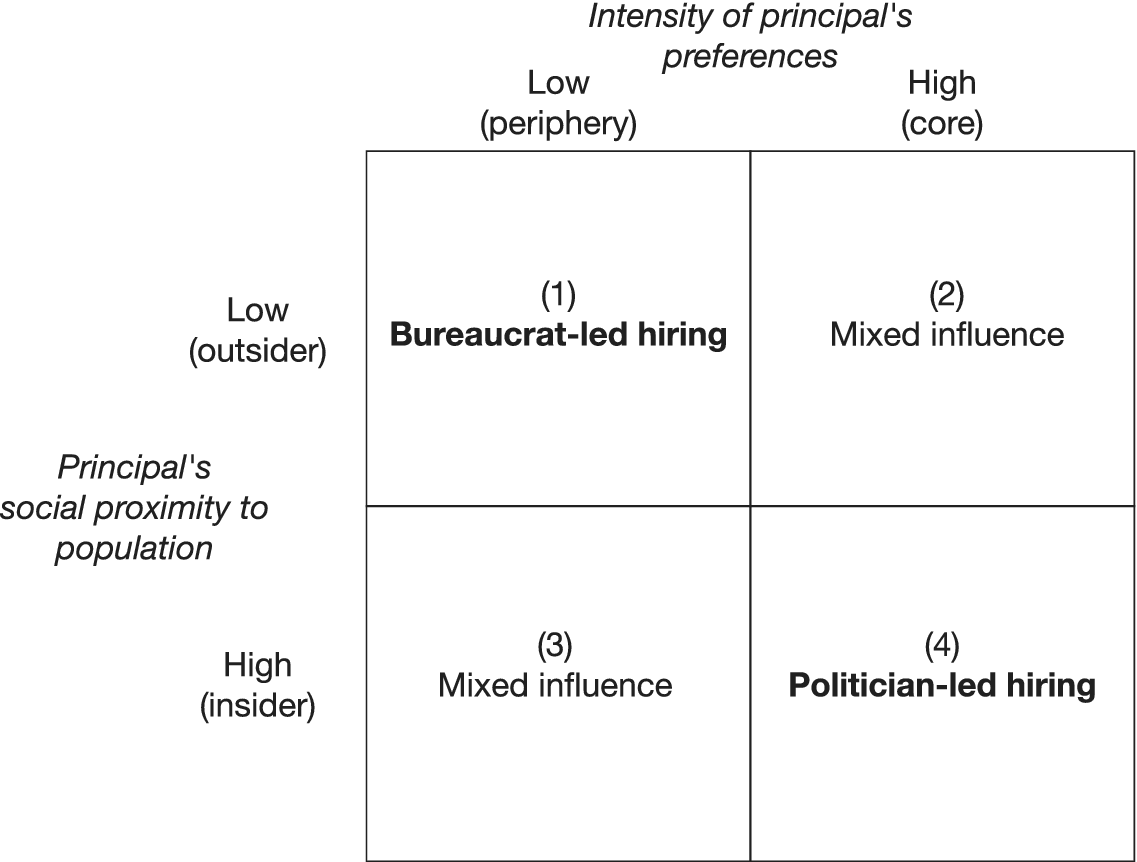


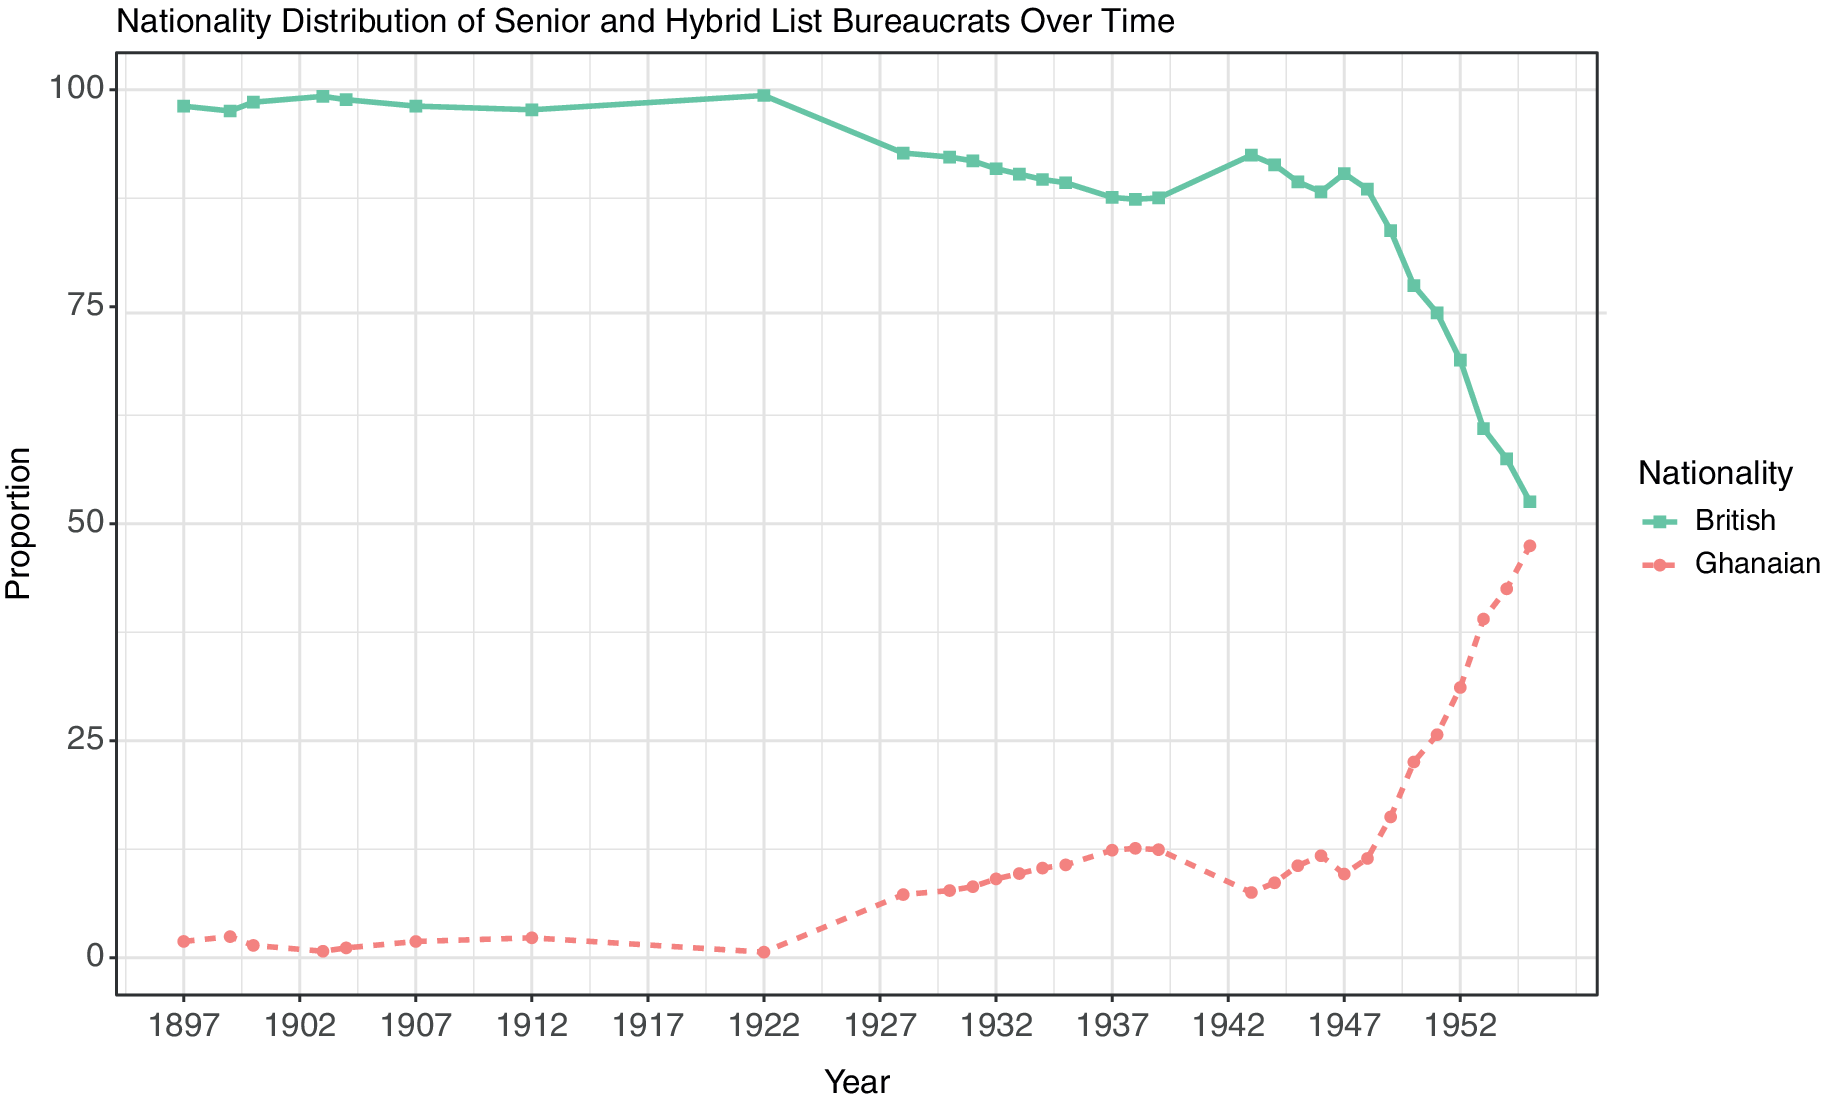

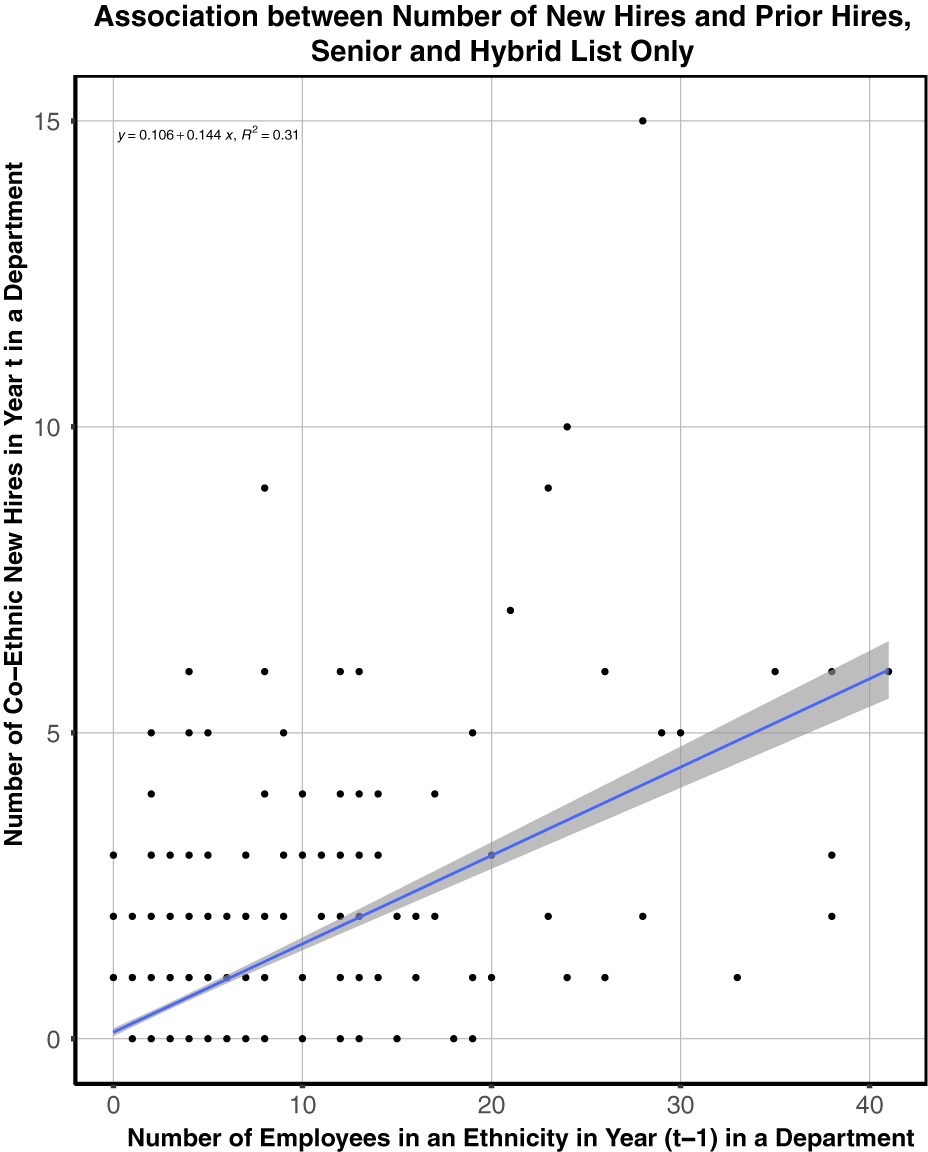
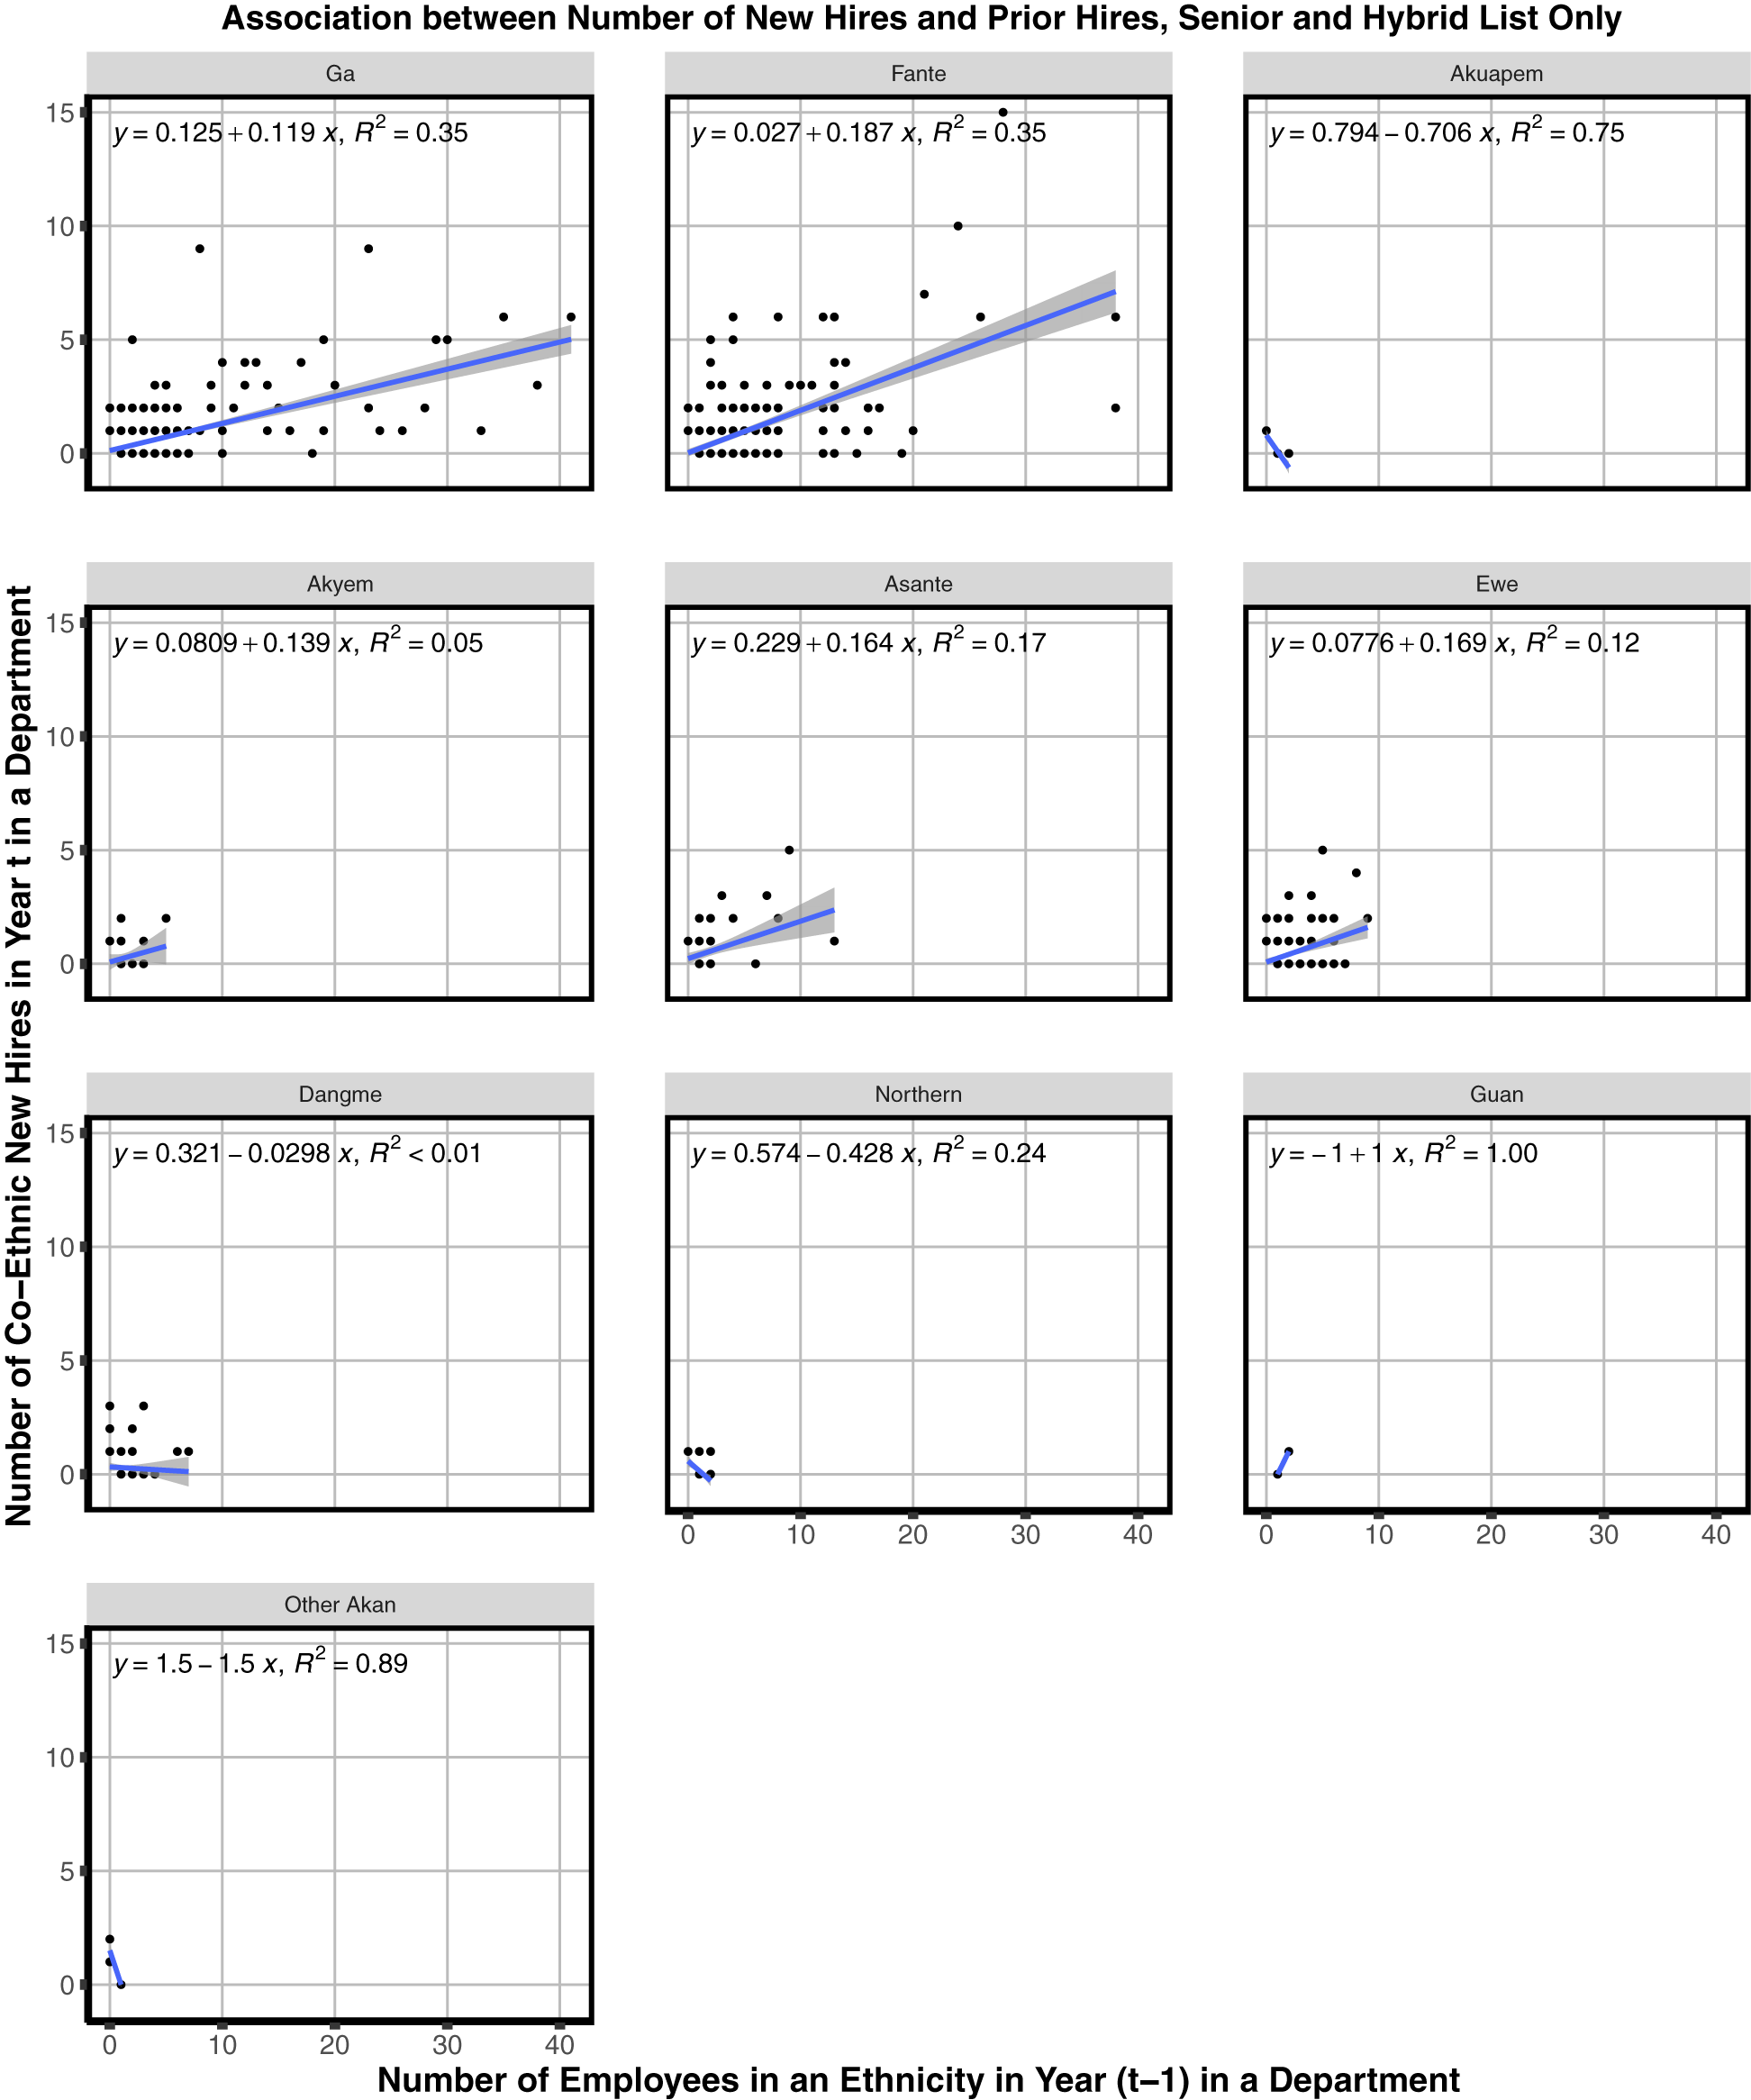
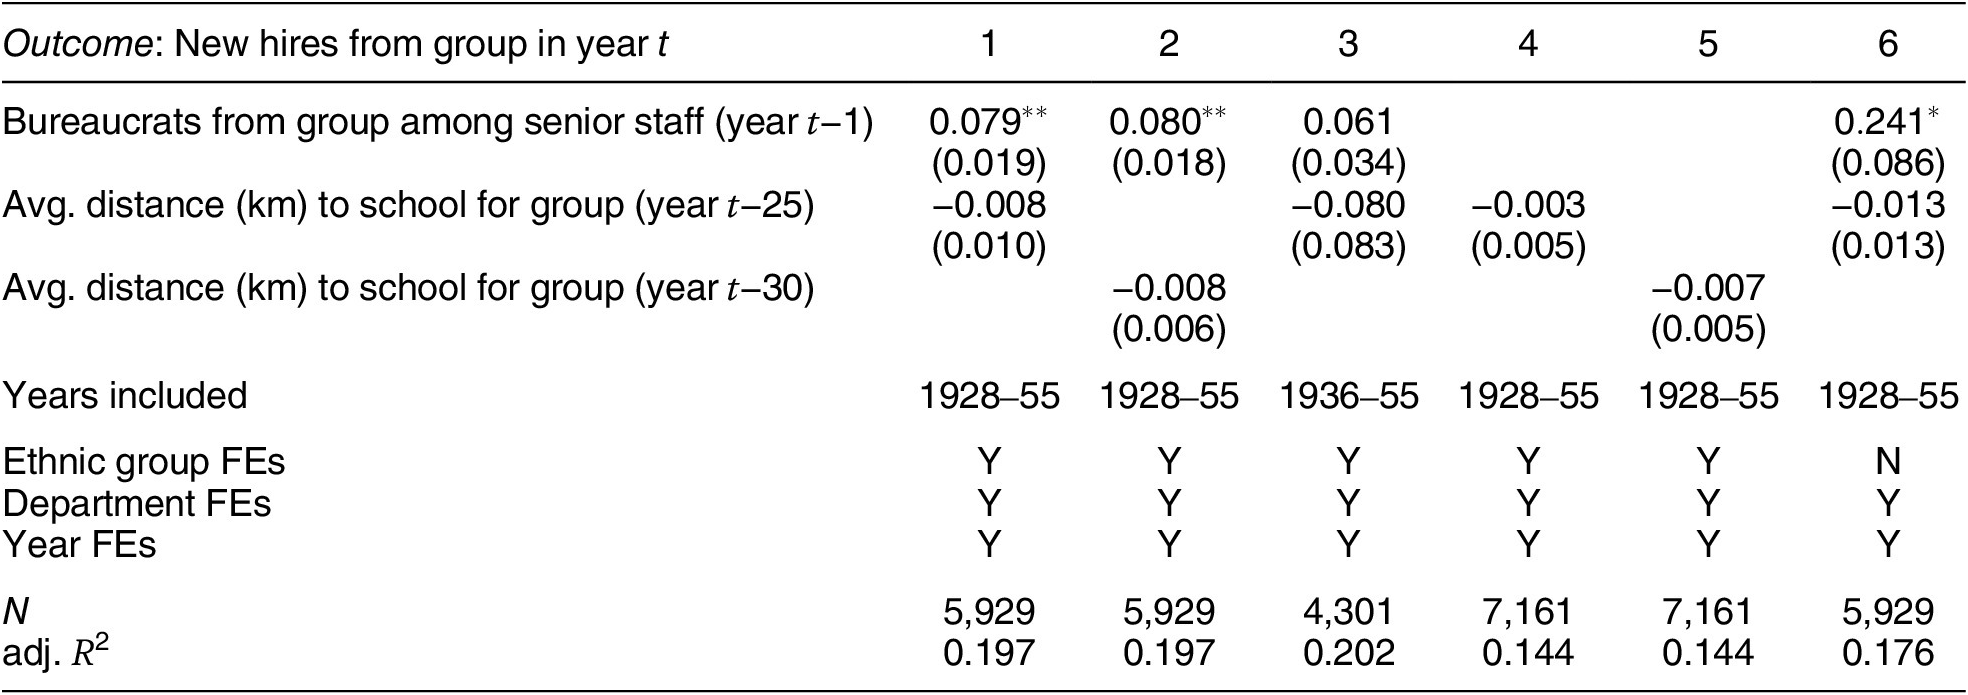

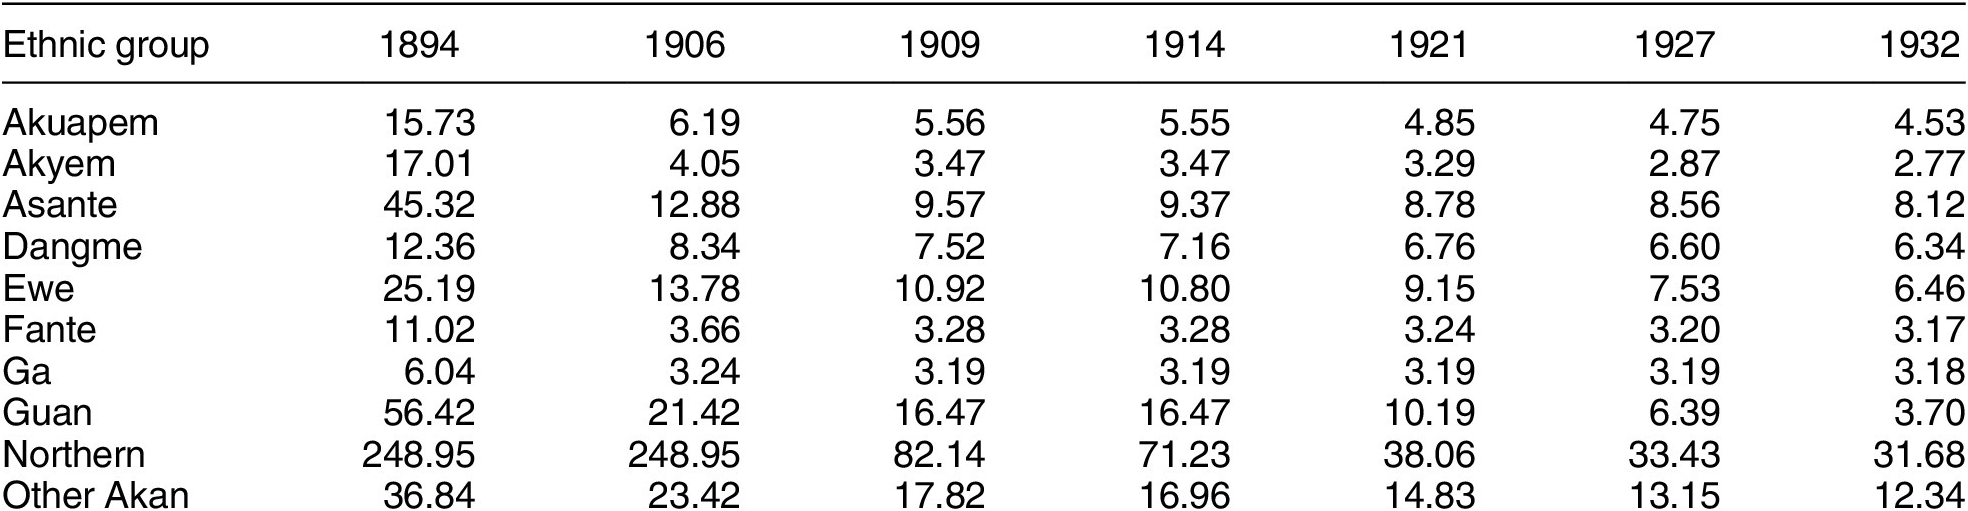

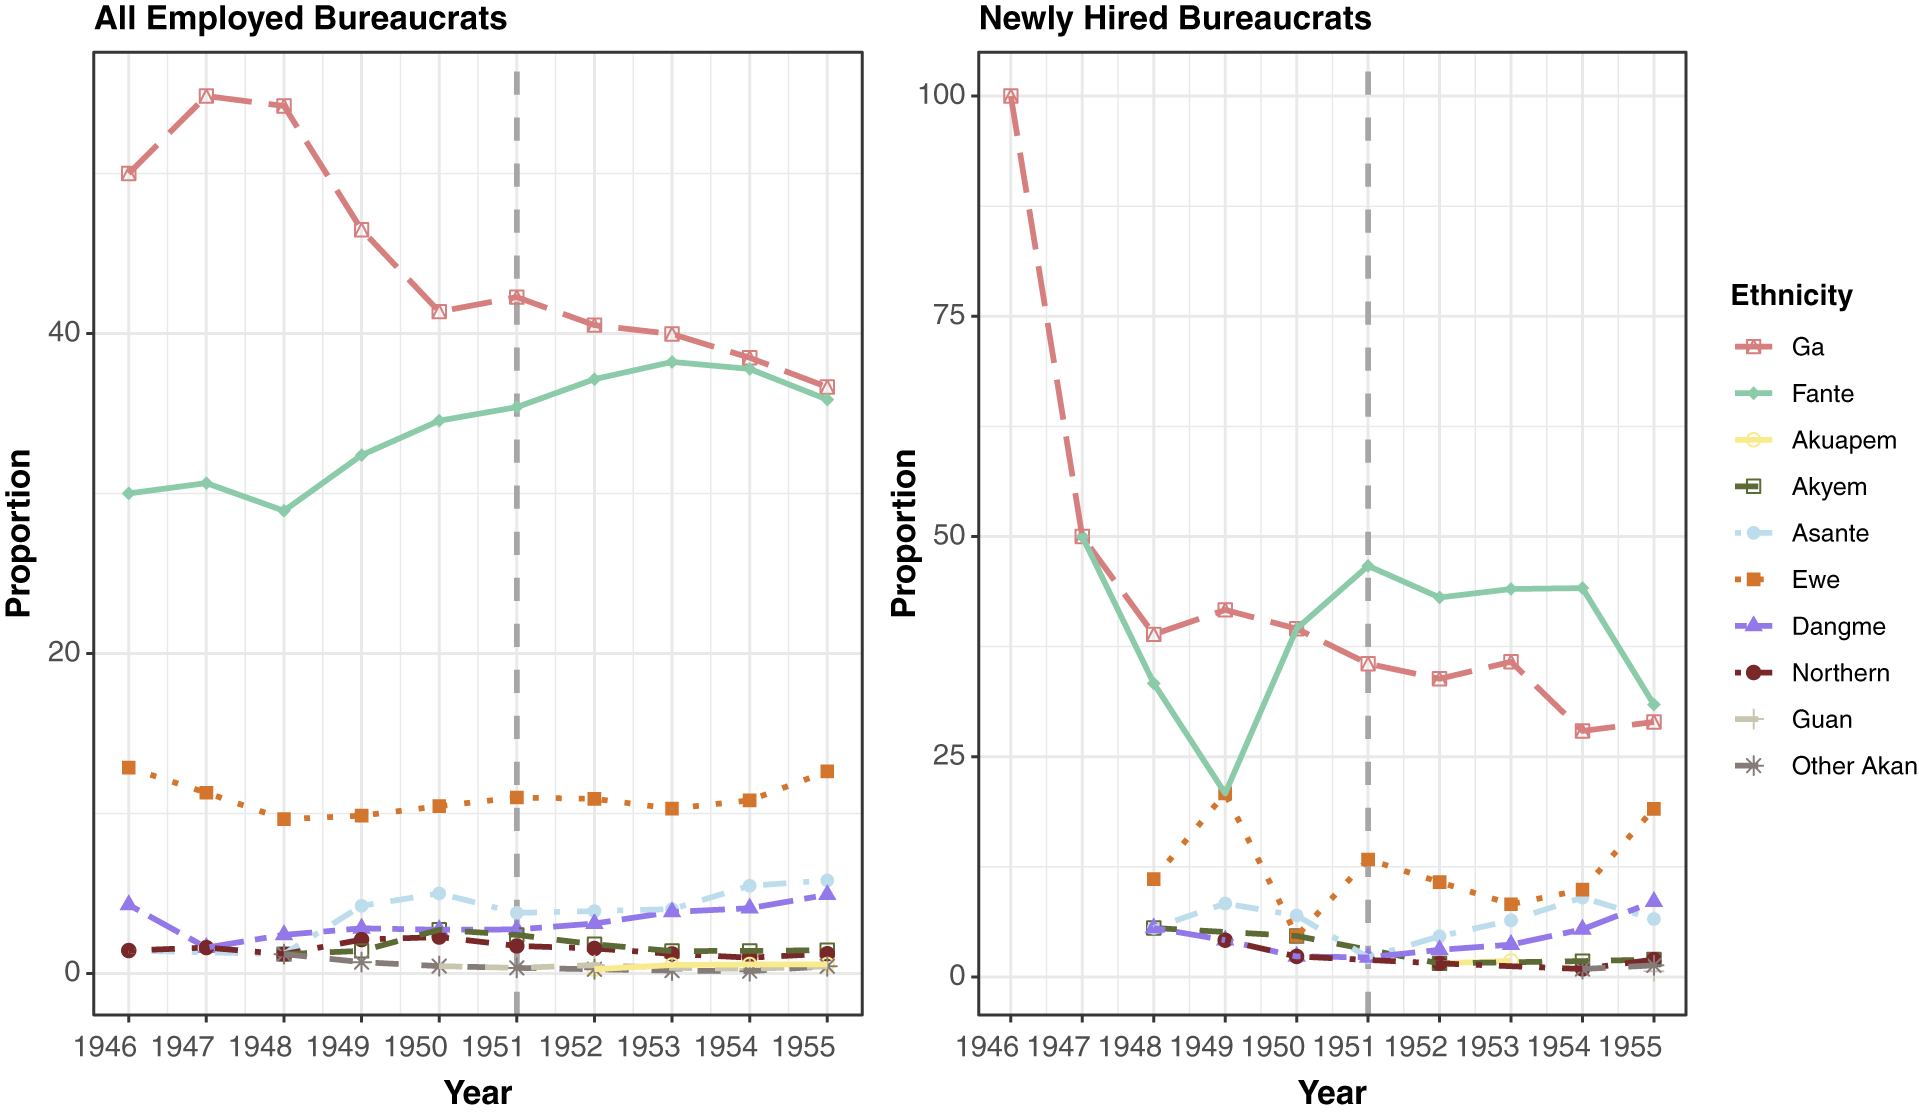
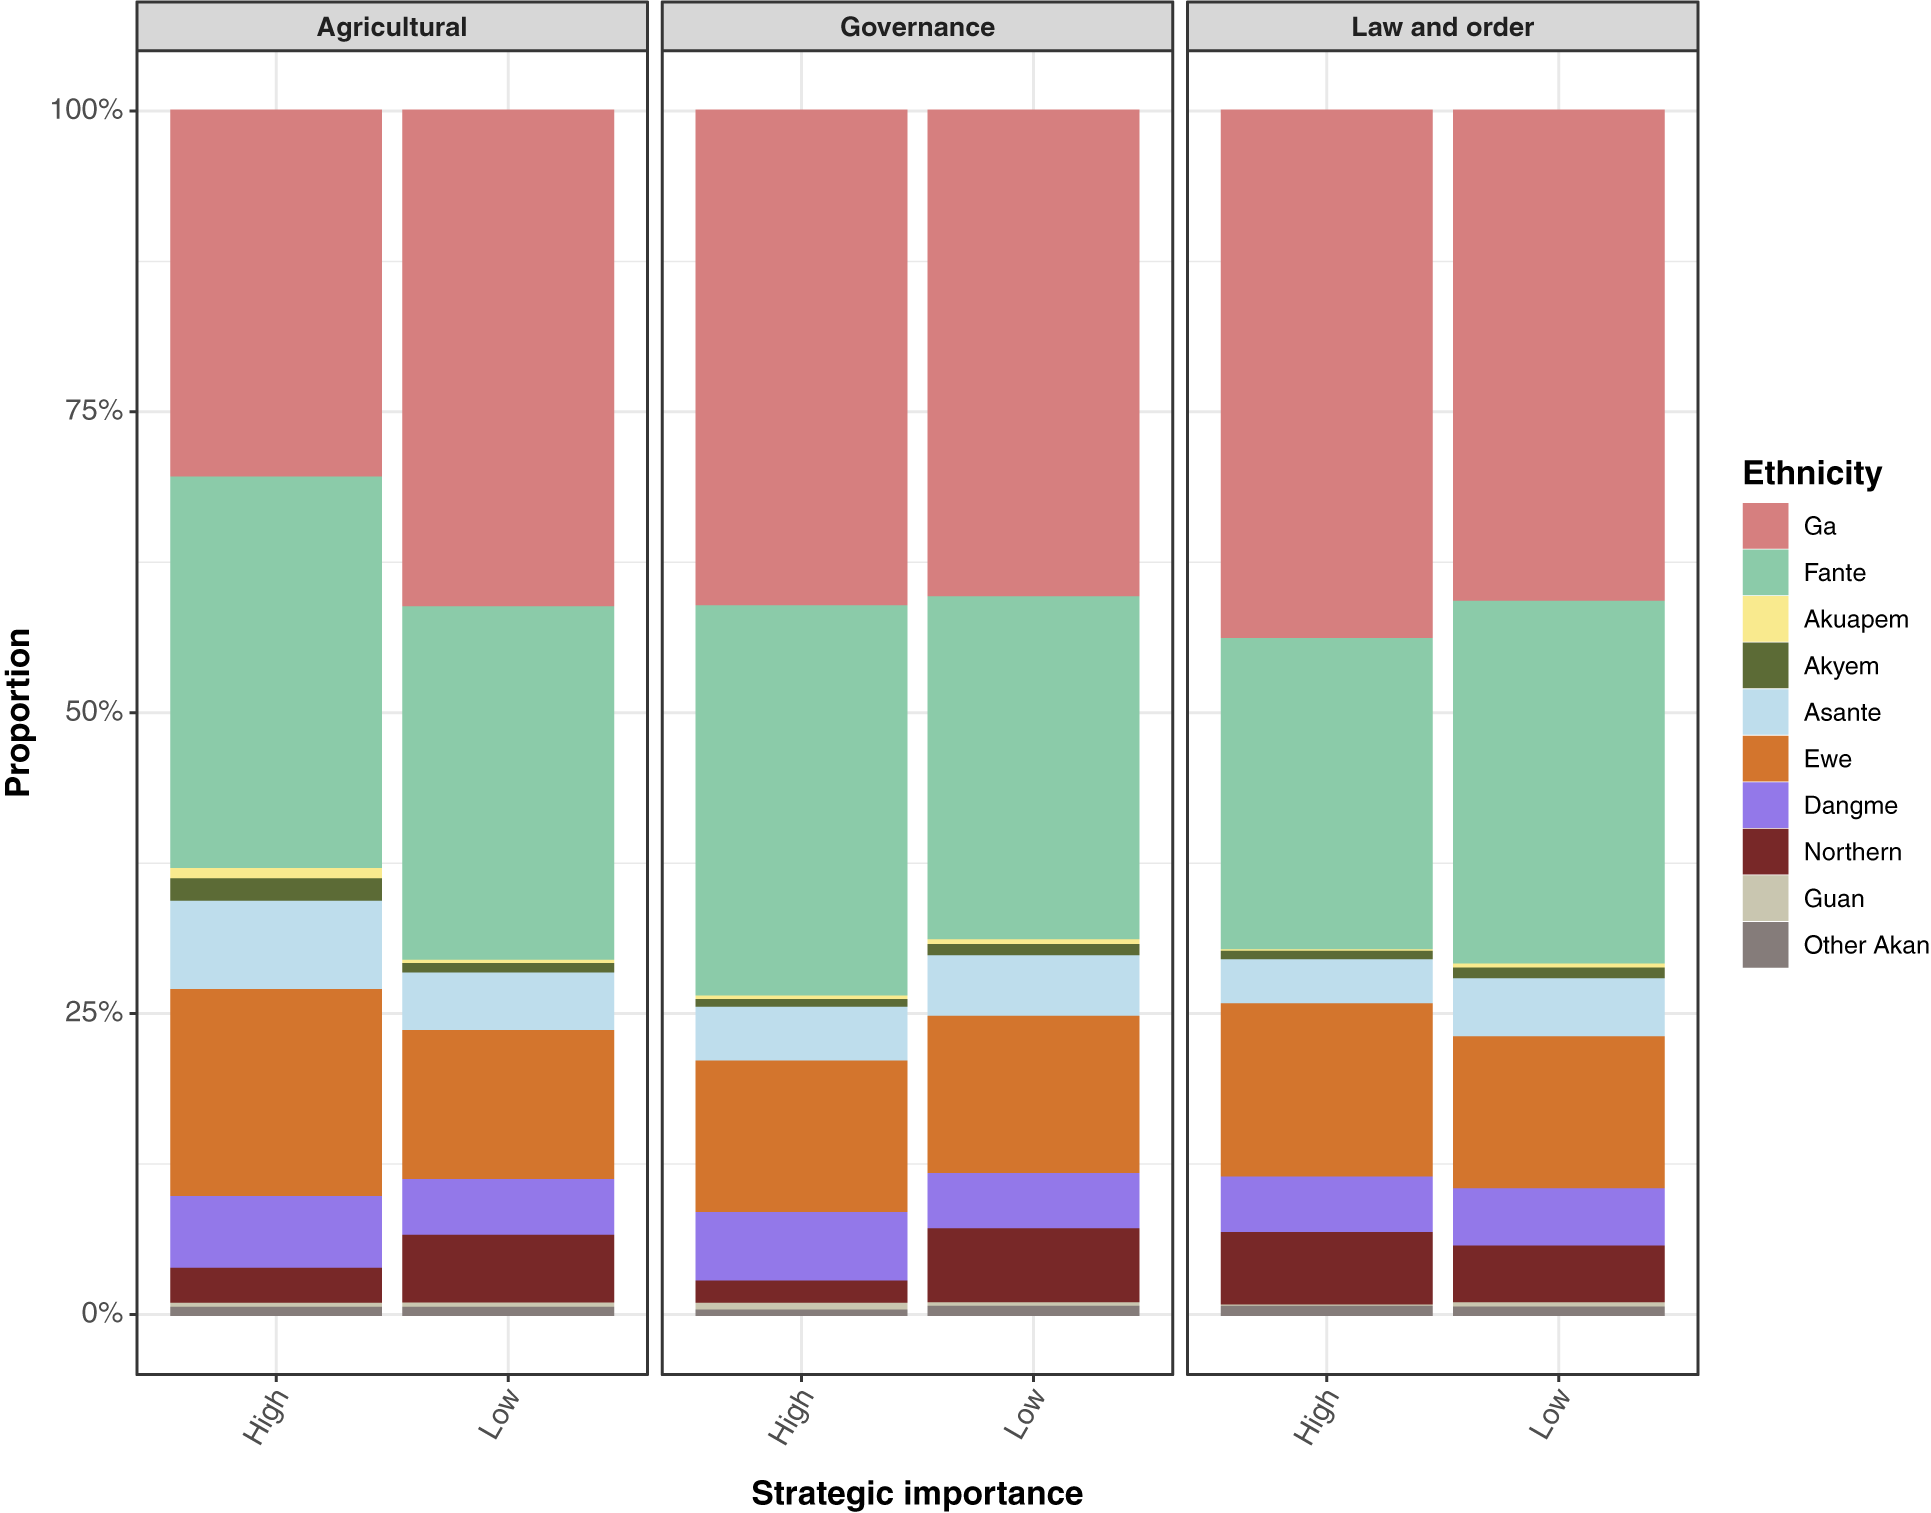


 Open access


Comments
No Comments have been published for this article.