1 Introduction
Many existing studies use the inviscid theories of Michell (Reference Michell1898) and Havelock (Reference Havelock1919, Reference Havelock1932) to investigate the optimum design of ship hulls (Zakerdoost, Ghassemi & Ghiasi Reference Zakerdoost, Ghassemi and Ghiasi2013; Zhao, Zong & Zou Reference Zhao, Zong and Zou2015; Dambrine, Pierre & Rousseaux Reference Dambrine, Pierre and Rousseaux2016; Boucher et al. Reference Boucher, Labbé, Clanet and Benzaquen2018). However, asymmetric hull shapes are not addressed, since there is no well-accepted predictive theory for the effect of asymmetry on wave resistance. Some studies have shown that viscosity plays an important role in the wave resistance of ship hulls (Gotman Reference Gotman2002; Lazauskas Reference Lazauskas2009). In particular, it is argued that the development of the turbulent boundary layer and its detachment point, where applicable, is crucial. It is well known that the development of a boundary layer on an asymmetric body is different depending on the direction of motion, due to the dependence of the boundary layer growth rate on the streamwise pressure gradients. This indicates that a viscous description of the flow is a possible way of studying asymmetric effects, although this is not addressed explicitly in any of the above studies.
More than a century ago, Michell derived the integral formula for the wave resistance on a body, using the approximation of a slender body in an irrotational, inviscid fluid (Michell Reference Michell1898). The major shortcoming of this formula is that, due to the reversibility of the steady potential-flow formulation, it does not distinguish the difference in wave drag when an asymmetric object moves forwards or backwards. However, it is clear that a large number of boats are designed with an asymmetric shape that is more pointed at the front than at the rear, precisely to reduce the wave disturbance. Hence, this theory cannot be used to reliably test design spaces.
Another commonly used method for estimating the wave drag on a body is the formula derived by Havelock (Reference Havelock1919, Reference Havelock1932). This approach, which also makes the assumption of an irrotational and inviscid fluid, requires knowledge of the pressure disturbance along the walls of the body. Hence, for an asymmetric body, if the difference in the pressure disturbance between forward and backward motion is known, then this formulation can capture the effects of asymmetry on wave drag. However, in practice it is very difficult to have a priori knowledge of the pressure distribution for a given body shape (Boucher Reference Boucher2018), which is why, despite the failure to capture asymmetric effects, the Michell formula is much the more popular.
In the present study, we first show the effects of asymmetry experimentally and then discuss how such effects can be predicted theoretically using either computational fluid dynamics, or our new proposed modification to Michell’s theory which includes the development of a turbulent boundary layer.
2 The asymmetry parameter
 $\unicode[STIX]{x1D716}$

To quantify the asymmetry of a body shape, it is useful to introduce an asymmetry parameter. Throughout this study, for the sake of simplicity, we restrict our attention to shapes which do not vary in the vertical direction. Furthermore, we only consider front–back asymmetry and not asymmetry in the transverse direction. That is to say, if we take a Cartesian coordinate system with the
 $x$
direction aligned with the positive direction of motion, and the origin centred at where the object mid-length meets the resting water surface level, then the shape is given by
 $$\begin{eqnarray}y=\left\{\begin{array}{@{}ll@{}}\pm f(x),\quad & \text{for }-L/2\leqslant x\leqslant L/2,\,-D\leqslant z\leqslant -D+H,\\ 0,\quad & \text{otherwise},\end{array}\right.\end{eqnarray}$$
where
 $L$
and
 $H$
are the body length and height, and
 $D$
is a typical distance between the air–water interface and the deepest part of the body (as illustrated in figure 1). To define a non-dimensional asymmetry parameter, it is useful to create non-dimensional variables
 $\hat{x}=x/L$
and
 $\hat{f}=f/(2\max \{\,f(x)\})$
(see figure 1
a). In terms of these new dimensionless variables, we define the asymmetry parameter as the
 $L_{2}$
norm of the odd function
 $$\begin{eqnarray}\unicode[STIX]{x1D716}=\unicode[STIX]{x1D705}\left(\int _{-1/2}^{1/2}(\,\hat{f}(\hat{x})-\hat{f}(-\hat{x}))^{2}\,\text{d}\hat{x}\right)^{1/2},\end{eqnarray}$$
where
 $\unicode[STIX]{x1D705}=\text{sgn}(\int _{-1/2}^{1/2}\hat{x}\,\hat{f}(\hat{x})\,\text{d}\hat{x})$
distinguishes the difference between forward and backward motion.
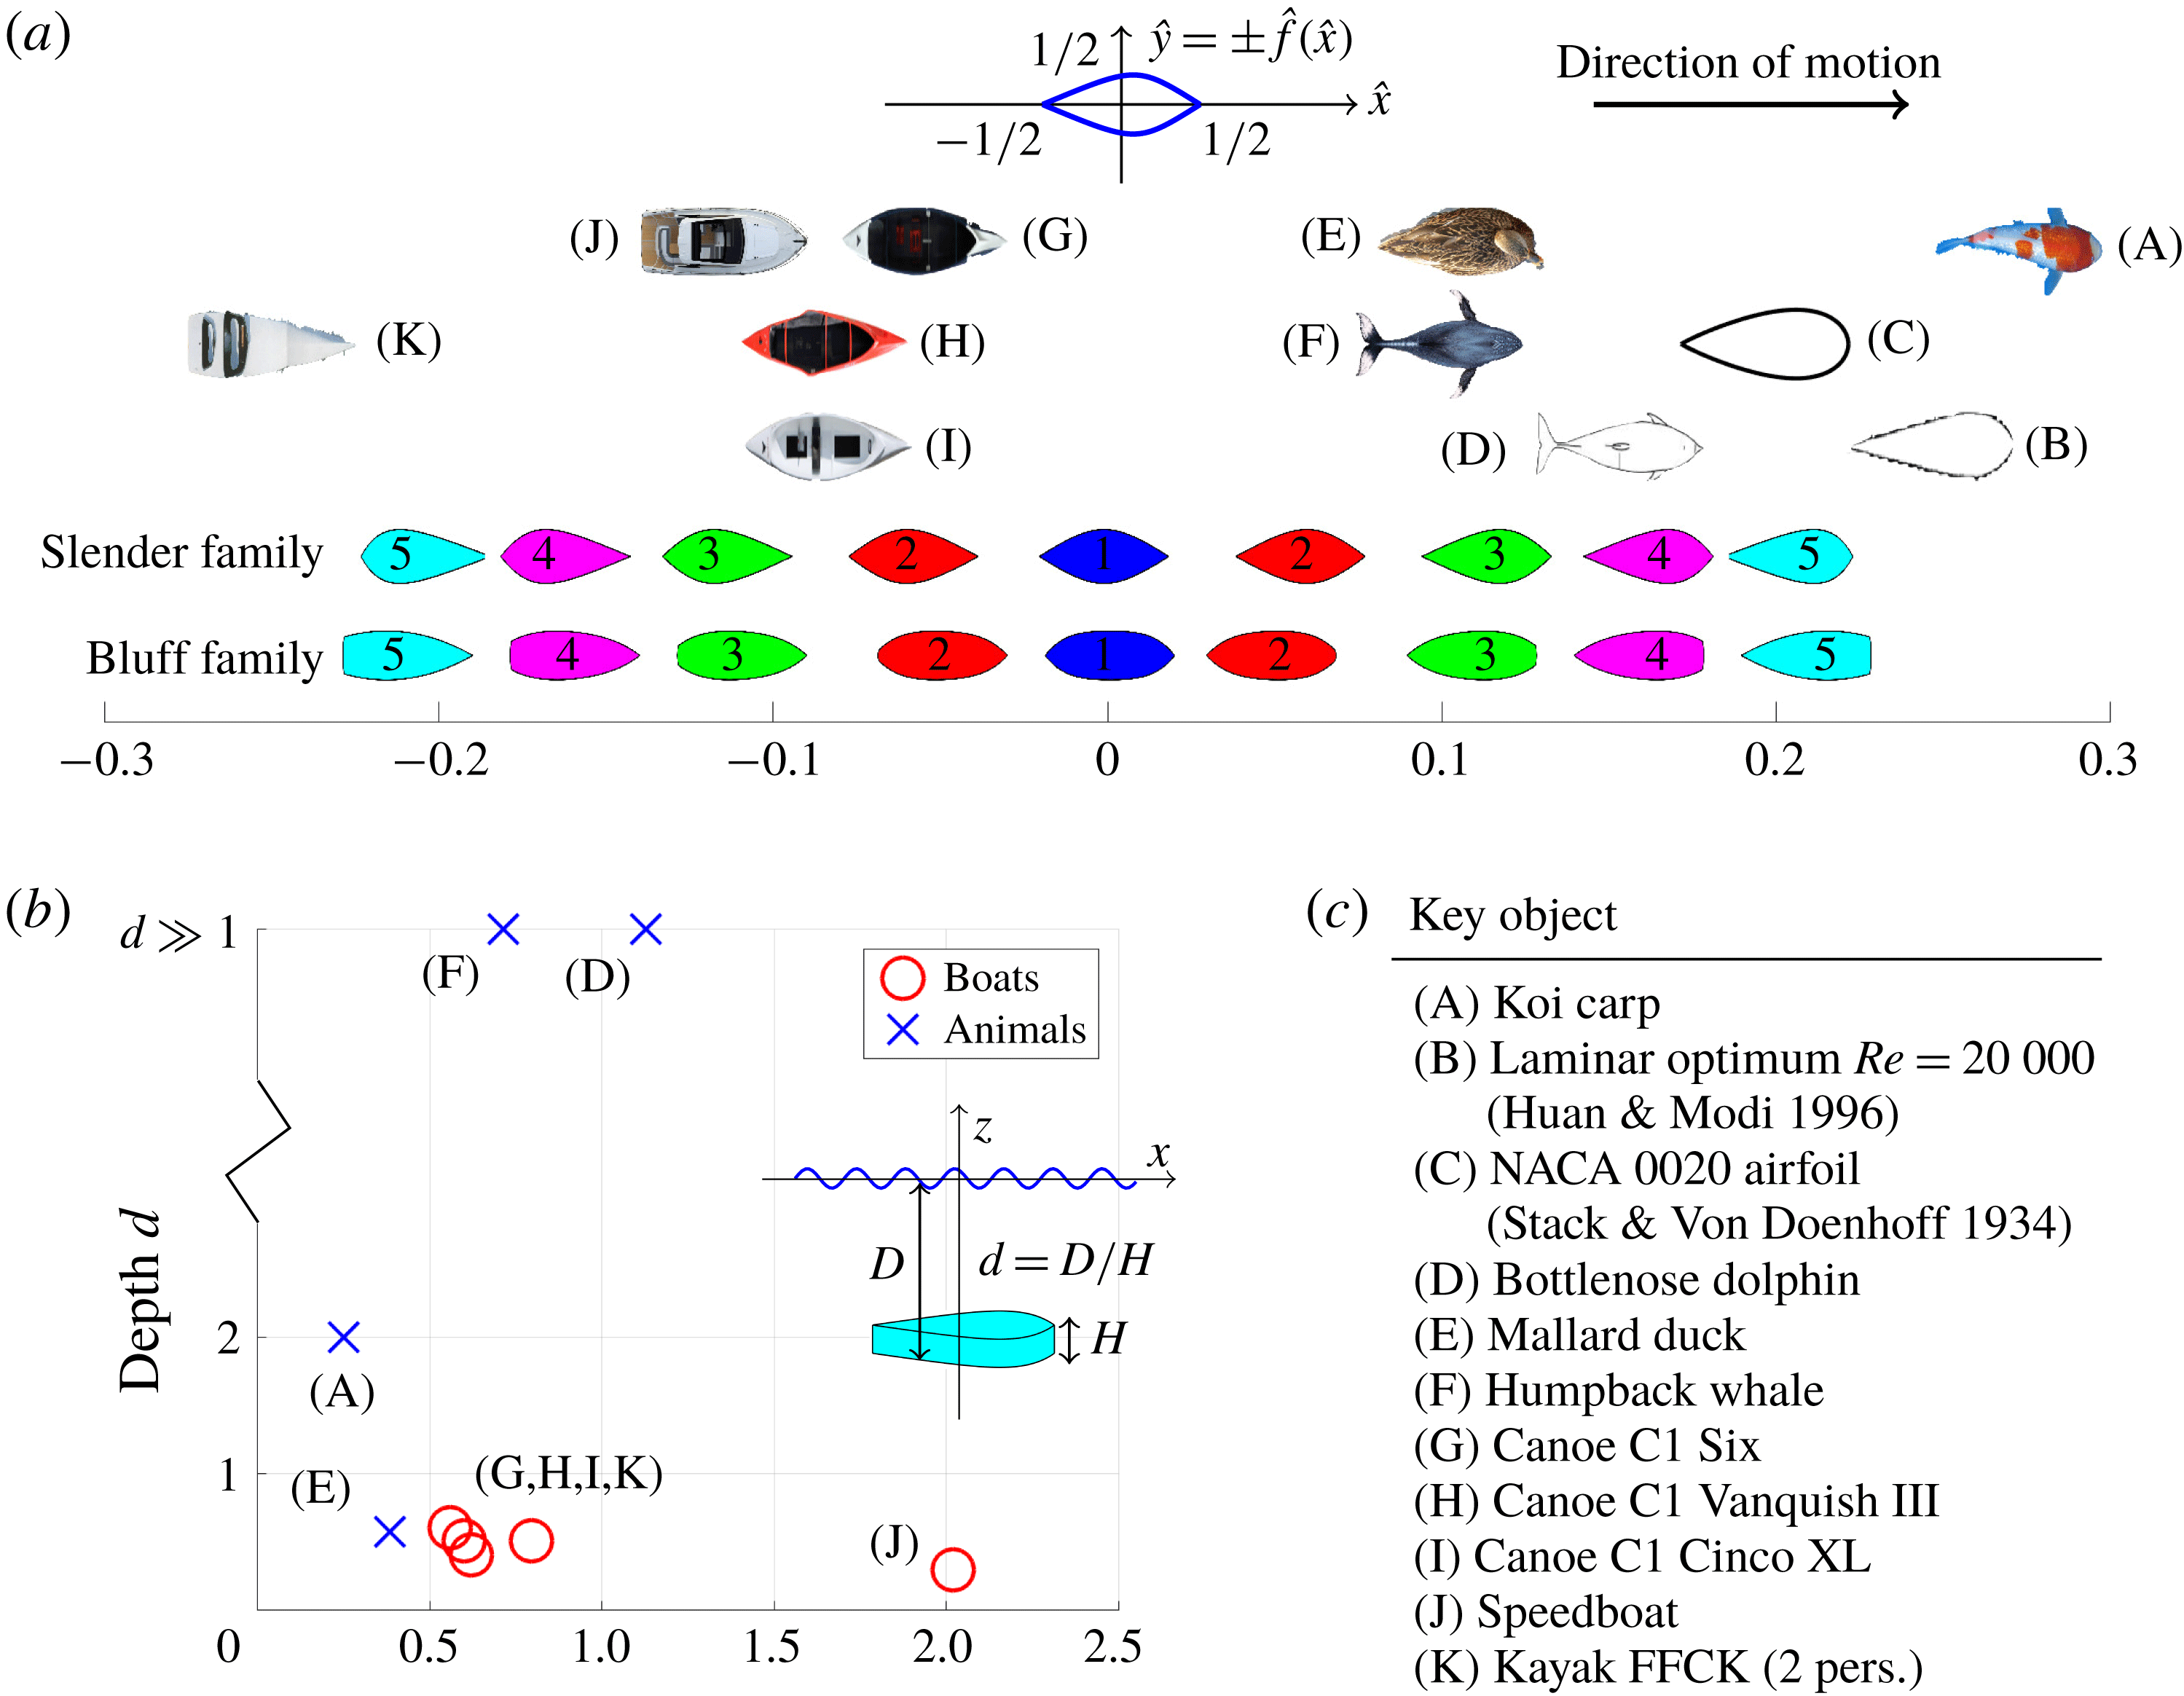
(a) Examples of different artificial and natural bodies that move near the water surface. All bodies have been scaled to have the same aspect ratio. (b) Non-dimensional average depth of motion
 $d=D/H$
and Froude number
 $Fr=U/\sqrt{gL}$
for each of these bodies. (c) Table of the different bodies.

In figure 1(a) we compare the value of
 $\unicode[STIX]{x1D716}$
for a variety of natural and artificial bodies that move near the air–water interface. In each case we approximate
 $\hat{f}(\hat{x})$
as the outline of the plan view of the body (ignoring fins in the case of aquatic creatures), and we ignore variations of the shape with depth. For each object we also compare values of the Froude number
 $Fr=U/\sqrt{gL}$
and the non-dimensional depth
 $d=D/H$
, where
 $U$
is a typical velocity scale and
 $g$
is the gravitational constant.
For aquatic creatures with
 $d\gg 1$
, such as the humpback whale or the bottlenose dolphin, we observe positive values of
 $\unicode[STIX]{x1D716}$
. We expect that this is because, at large depths wave drag is less important than form drag and, hence, for a given body volume, drag is minimised with a streamlined shape with a trailing edge more pointed than its leading edge (Videler Reference Videler2012). By contrast, for canoes and other boats with
 $d\approx 0.5$
, we observe negative values of
 $\unicode[STIX]{x1D716}$
. We expect that this is because at smaller depths, wave drag is more important than form drag and, hence, a pointed leading edge is preferable.
Except for the case of the speedboat (
 $Fr=2.0$
), all of the other bodies in figure 1 have Froude numbers in the range
 $0.2\leqslant Fr\leqslant 1.2$
. It is well known that this is the regime where wave drag is typically most significant (Michell Reference Michell1898; Havelock Reference Havelock1932; Tuck Reference Tuck1989). Hence, in this study we restrict our attention to Froude numbers in this range and investigate the effect of body asymmetry on drag. Furthermore, we do not investigate the effects of planing (Darmon, Benzaquen & Raphaël Reference Darmon, Benzaquen and Raphaël2014; Rabaud & Moisy Reference Rabaud and Moisy2014).
To investigate the effect of asymmetry, we introduce two families of shapes which have
 $\unicode[STIX]{x1D716}$
values in the same range as the existing body shapes, and we number the shapes from 1 to 5, as displayed in figure 1. One set of shapes is slender, whilst the other is more bluff. The slender family, which we use for the majority of this study, is useful for comparison with Michell’s theory for slender bodies. Except for the speedboat (J) and the two-person kayak (K), all of the objects in figure 1(a) are well approximated by the slender family. However, clearly these two boat shapes (J, K) are more similar to the bluff family. Indeed, a shape with a completely flat trailing edge, as in the bluff family, has massive boundary layer separation and large form drag. Therefore, we use the bluff family to explore such shapes, but we keep the experimental measurements in appendix B. Furthermore, there is a larger difference in performance between each of the shapes in the bluff family, since they have more of an extreme profile, and this granularity makes them useful for finding optimal asymmetry, which we discuss later in § 5.
The shapes from both families have the same vertical and horizontal aspect ratios
 $L/H=3.6$
and
 $L/W=6$
, where
 $W$
is the body width. The non-dimensional volume
 $\hat{V}=1/(HLW)\iint f\text{d}x\,\text{d}z$
is given by
 $\hat{V}=0.31$
for the slender family and
 $\hat{V}=0.38$
for the bluff family. Each family of shapes is defined by an analytical function which is given in appendix A.
In the next section we use the slender family of shapes to experimentally investigate the effect of asymmetry on drag at varying depths and Froude numbers. In the subsequent section we replicate the experimental results using a
 $k$
–
 $\unicode[STIX]{x1D714}$
shear stress transport (SST) turbulence model, as well as a simple modification of Michell’s theory where we account for the development of the turbulent boundary layer. Then we close with a discussion on the effect of the depth of motion, and a summary of all the results.
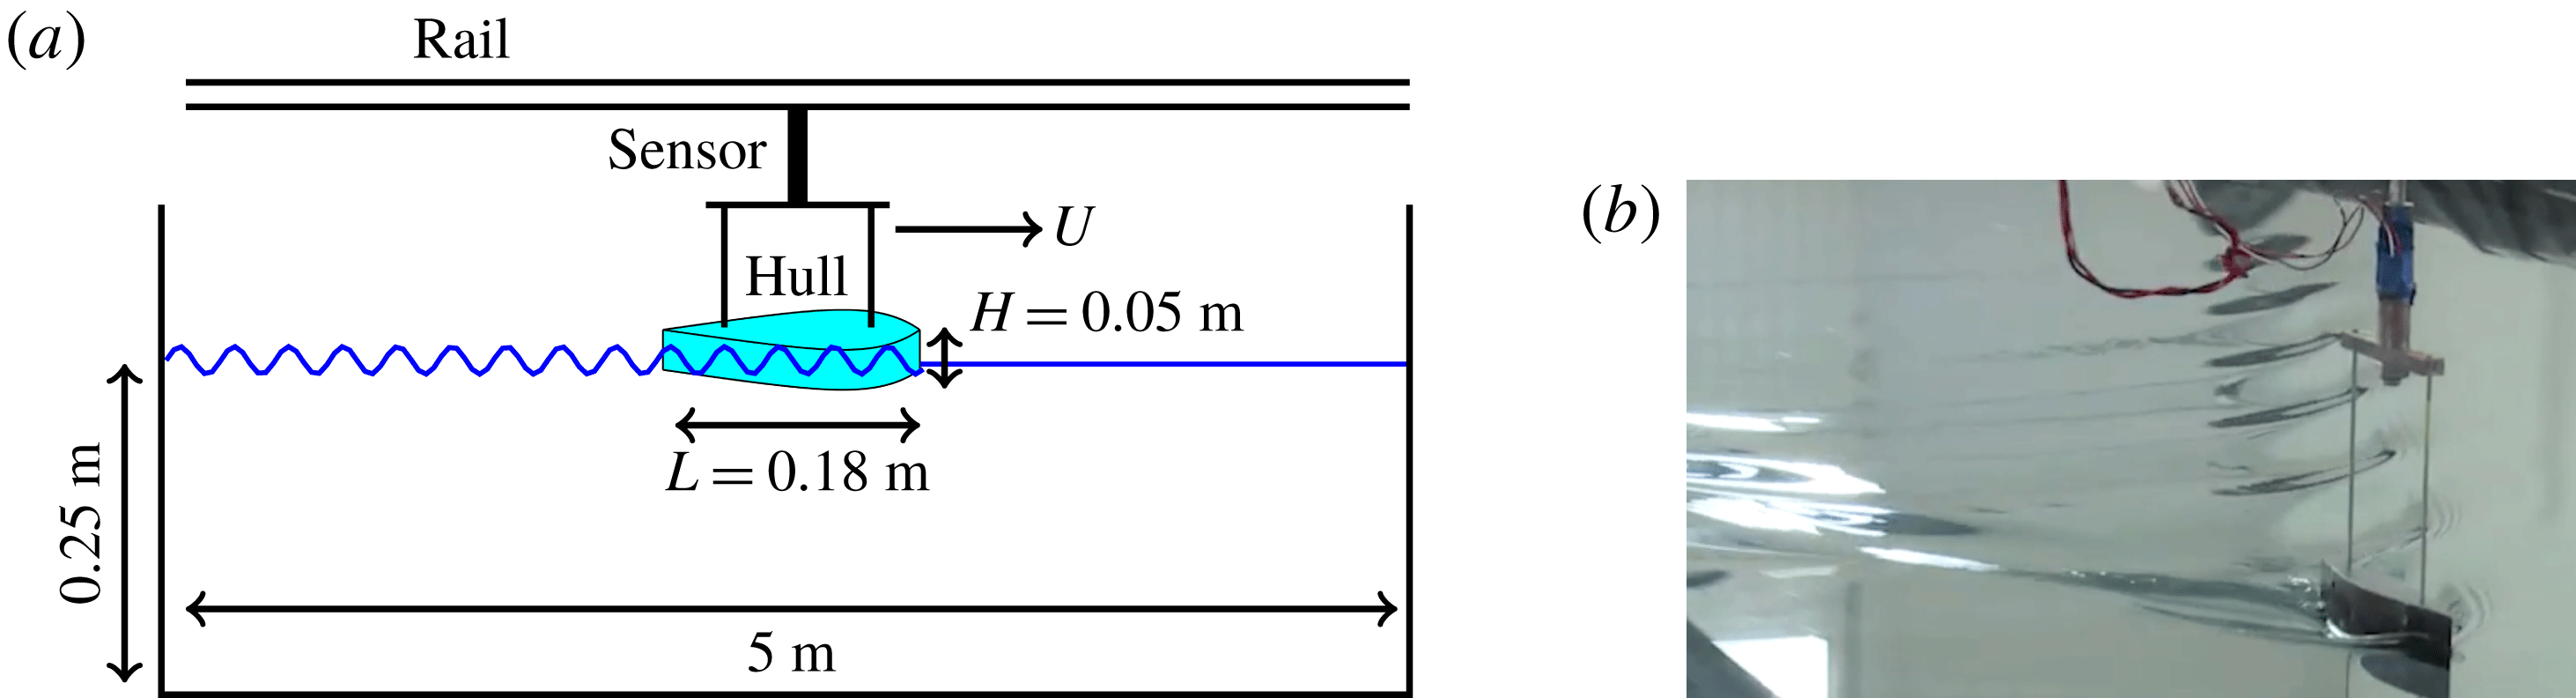
(a) Schematic diagram showing the body hull being pulled through the water at constant velocity by a linear motor and connected via supporting bars to a force sensor. (b) Photograph showing the towed body and its wake pattern.

3 Experimental investigation
In figure 2 we display a schematic diagram and a photograph of our experimental set-up. We use a three-dimensional (3-D) printer to manufacture the two families of asymmetric bodies. These are pulled through the water in a large basin (
 $5~\text{m}\times 2~\text{m}\times 0.25~\text{m}$
) by a linear motor at constant velocity (in the range
 $0.4{-}1.4~\text{m}~\text{s}^{-1}$
). The hull is connected to the motor by two supporting bars and a force/displacement sensor. Different body depths are achieved using a vertical winch. The pitch angle is always fixed at zero degrees to the horizontal, such that planing is never achieved. However, we note that in realistic situations, some planing is expected for boats which travel at
 $Fr>0.6$
(Maynord Reference Maynord2005). Experiments are repeated at least three times for accuracy. The dimensions of the hull and water basin are given in the diagram (except for the width of the hull, which is
 $W=0.03~\text{m}$
).
Using this set-up we measure the drag force on the two families of shapes at non-dimensional depths
 $d=D/H$
between
 $0.5$
and
 $2.0$
, and at Froude numbers
 $Fr=U/\sqrt{gL}$
between
 $0.3$
and
 $1.0$
. We do not study Froude numbers smaller than
 $Fr=0.3$
because the signal-to-noise ratio of the force measurements is too large. We convert the measured force
 $R$
into a non-dimensional drag coefficient
 $C_{d}$
via the relationship
 $$\begin{eqnarray}C_{d}=\frac{R}{\unicode[STIX]{x1D70C}U^{2}\unicode[STIX]{x1D6FA}^{2/3}},\end{eqnarray}$$
where
 $\unicode[STIX]{x1D70C}$
is the water density and
 $\unicode[STIX]{x1D6FA}=LWH_{w}$
is a typical volume scale, where
 $H_{w}$
is the wetted depth, which is equal to
 $H$
when the hull is fully immersed and
 $dH$
when partly immersed.
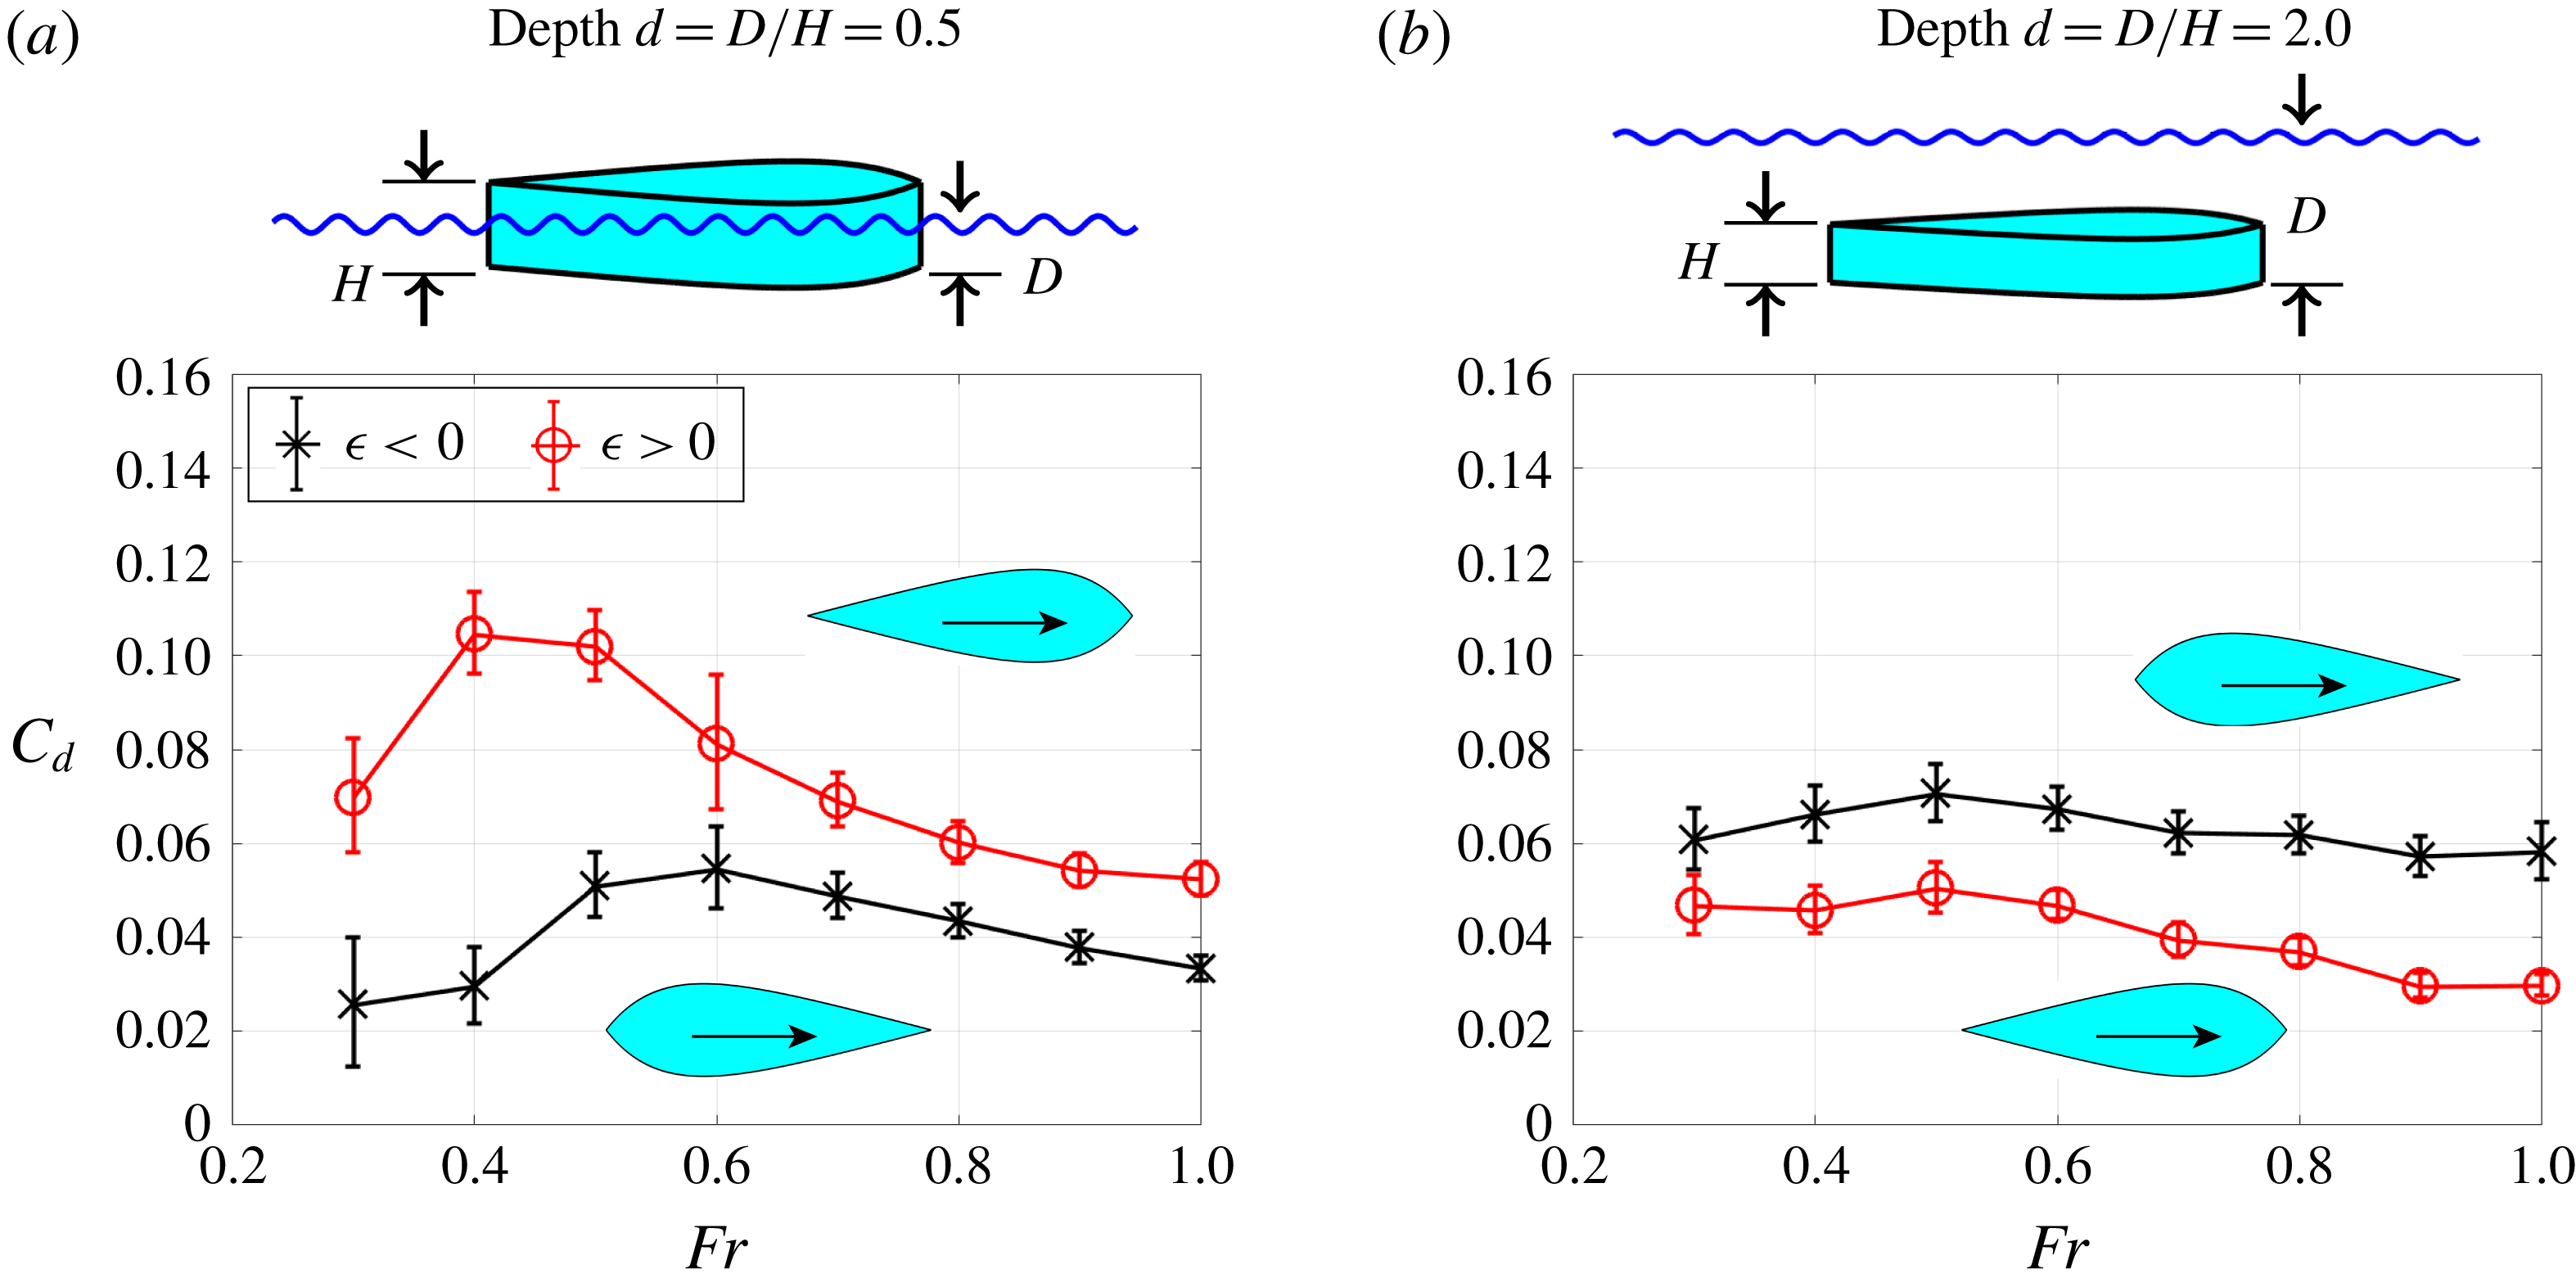
In figure 3 we display drag coefficients measured for hull 5 from the slender family at depth
 $d=0.5$
(a) and
 $d=2.0$
(b) at Froude numbers between
 $0.3$
and
 $1.0$
. For the shallow case
 $d=0.5$
, the drag coefficient for
 $\unicode[STIX]{x1D716}<0$
is lower than
 $\unicode[STIX]{x1D716}>0$
for all measured Froude numbers. This is because when the body moves at the water surface, the total drag is dominated by its wave drag component, and for
 $\unicode[STIX]{x1D716}>0$
, where the leading edge is less pointed than the trailing edge, there is a larger wave disturbance than for
 $\unicode[STIX]{x1D716}<0$
. For the deep case
 $d=2.0$
(figure 3
b), the total drag is dominated by its form drag component. Hence, for all Froude numbers there is lower drag when the body moves in its more streamlined direction, with its more pointed end at the trailing edge (
 $\unicode[STIX]{x1D716}>0$
).
In the intermediate depths between
 $d=0.5$
and
 $2.0$
, as we will discuss later, neither
 $\unicode[STIX]{x1D716}<0$
nor
 $\unicode[STIX]{x1D716}>0$
is optimal for all Froude numbers. Instead, there is a range of Froude numbers for which wave drag is more important than form drag (and
 $\unicode[STIX]{x1D716}<0$
optimal) and the complimentary range where form drag is more important (and
 $\unicode[STIX]{x1D716}>0$
optimal).
Experimentally measured drag coefficient (3.1) for hull 5 from the slender family at different Froude numbers and at depths (a)
 $d\,=\,0.5$
and (b)
 $d\,=\,2.0$
. The difference between positive and negative asymmetry
 $\unicode[STIX]{x1D716}$
is indicated. Error bars correspond to one standard deviation of the time signal given by the force sensor.

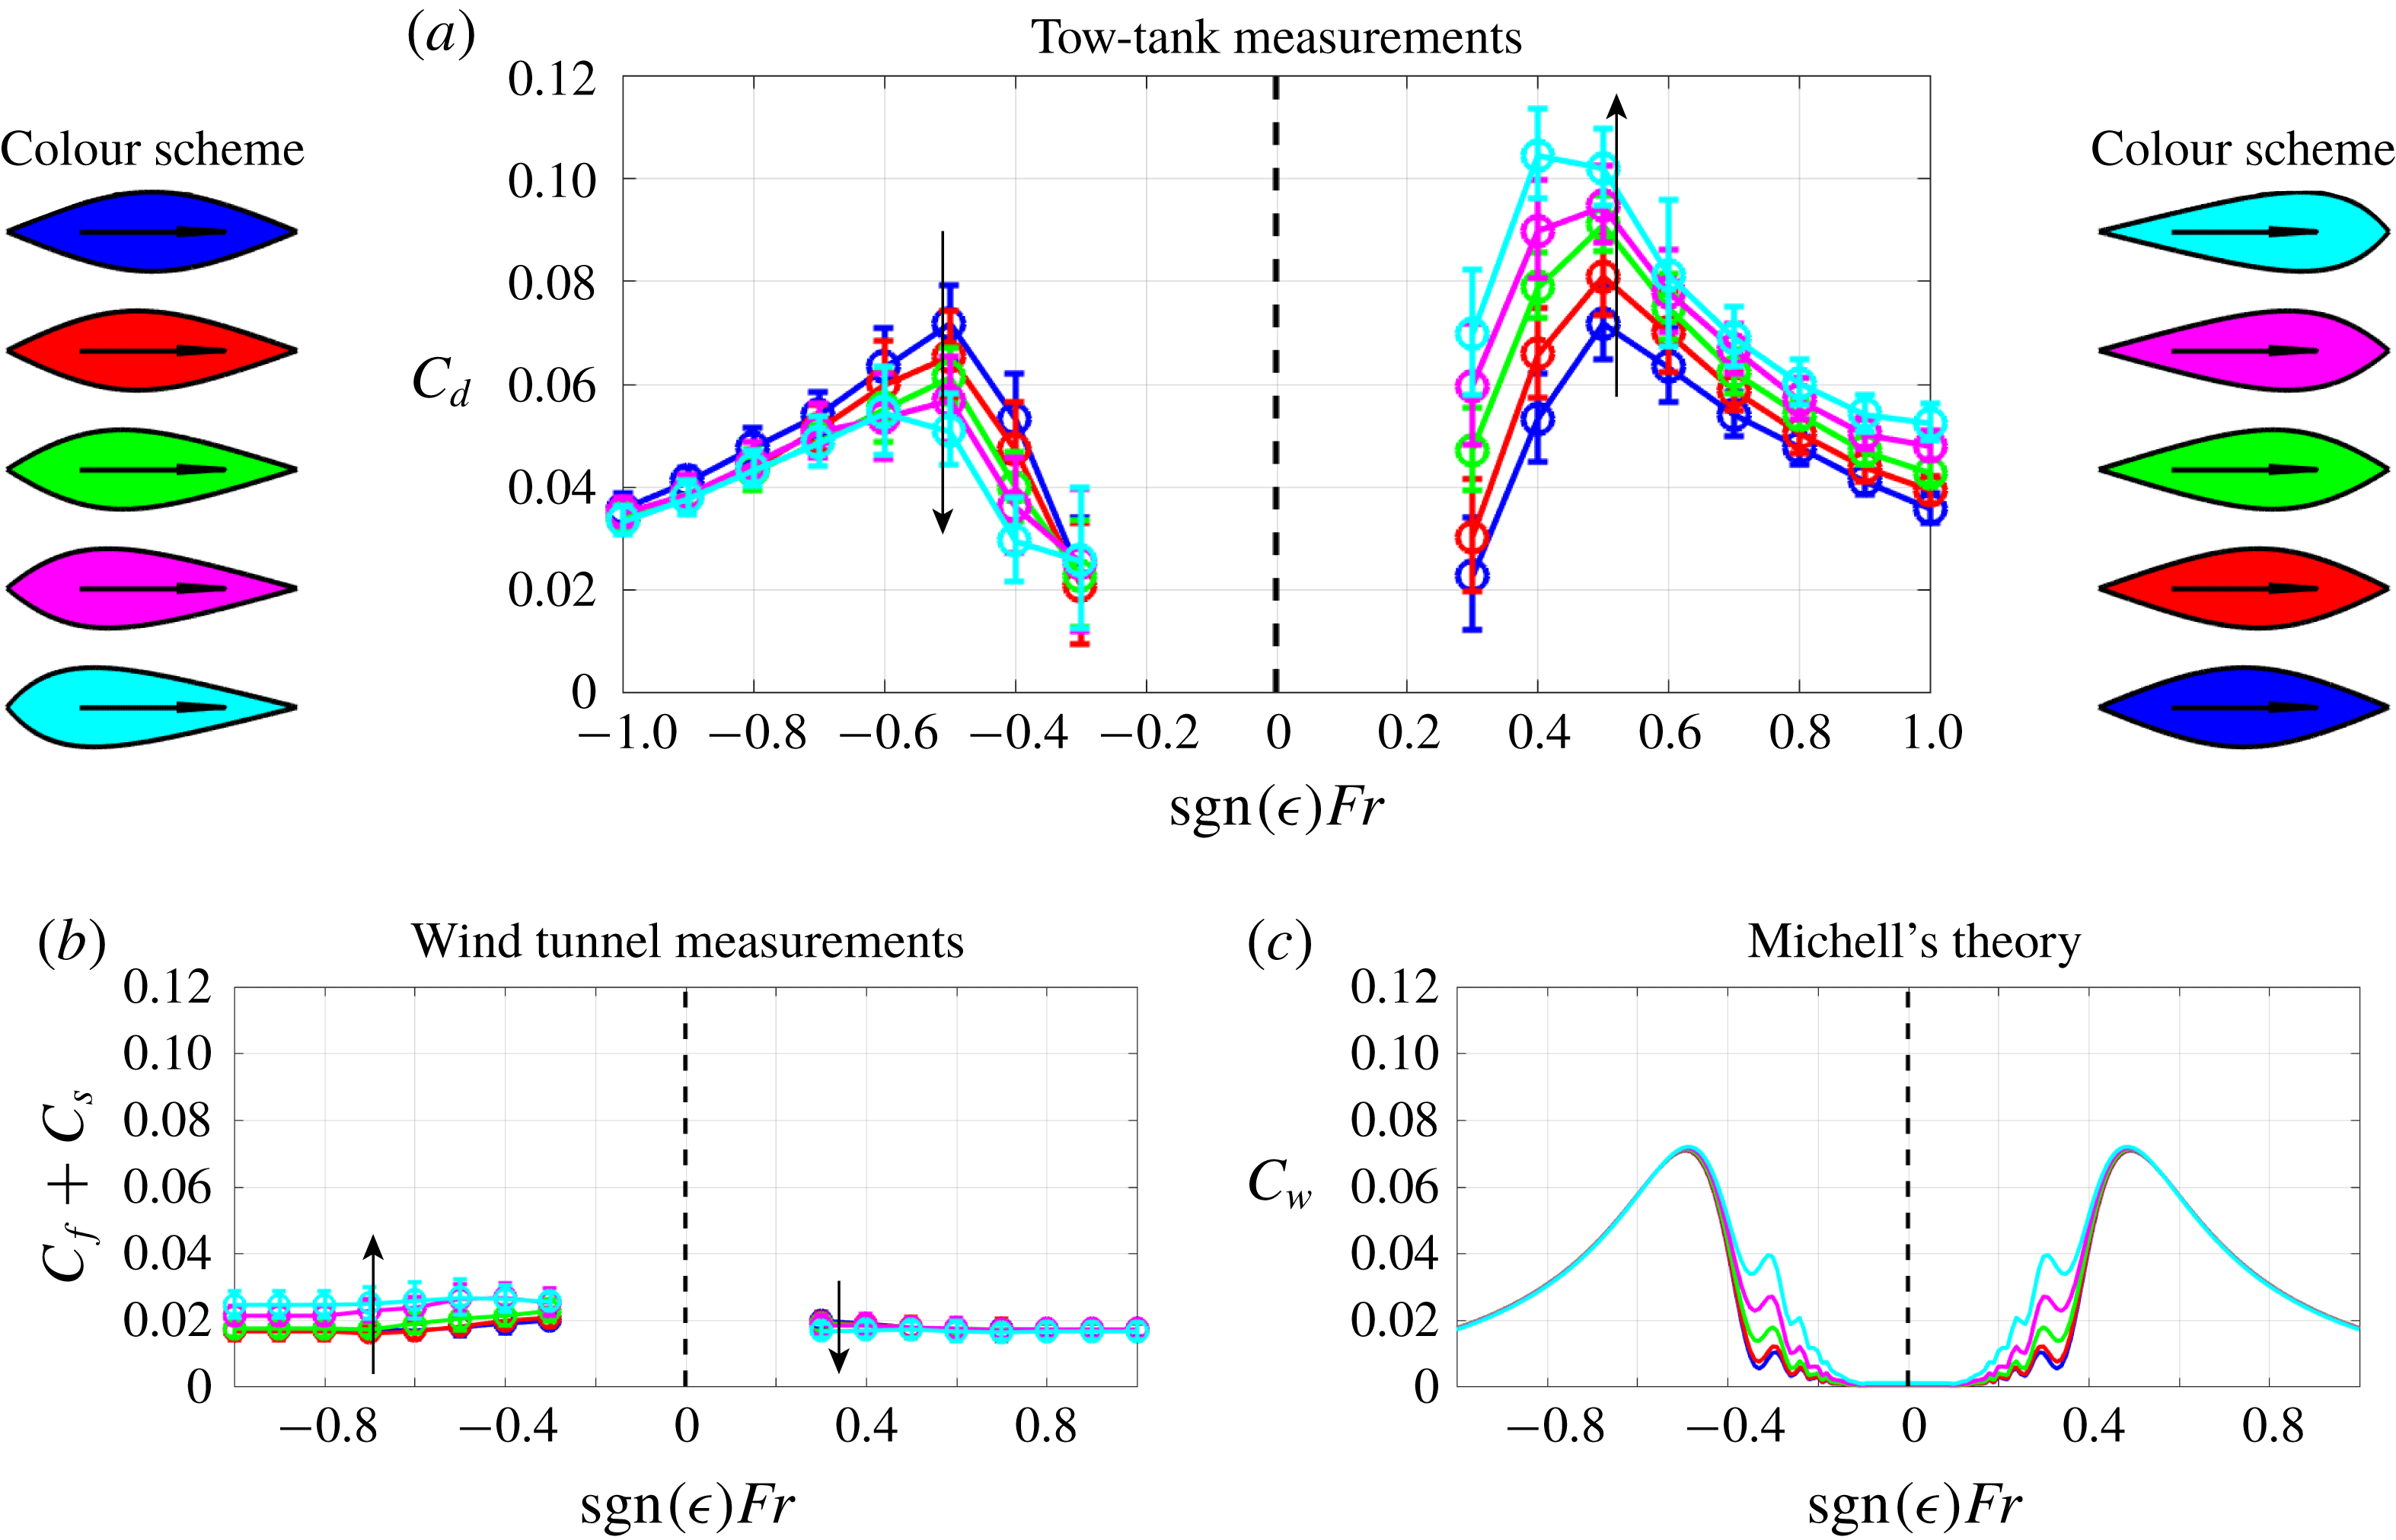
Next we investigate the other hull shapes from the same slender family. In figure 4(a) we show measured values of
 $C_{d}$
for
 $d=0.5$
, for each of the five different hull shapes, and in both directions of motion. We can see that the drag increases with increasing
 $\unicode[STIX]{x1D716}>0$
(i.e. for hull numbers from 1 to 5), whereas drag decreases with decreasing
 $\unicode[STIX]{x1D716}<0$
. This is consistent with figure 3, and indicates that bodies with pointed leading edges are optimal at shallow depths. The drag curves exhibit characteristic maxima near
 $Fr=0.5$
, as is often seen in the literature (Tuck Reference Tuck1989; Videler Reference Videler2012).
(a) Drag coefficient (3.1) measured using a tow-tank experiment for each of the five hulls from the slender family with both positive and negative
 $\unicode[STIX]{x1D716}$
at fixed depth
 $d=0.5$
and at different Froude numbers. (b) Form and skin drag coefficient
 $C_{f}+C_{s}$
(3.3) measured in a wind tunnel, in absence of the air–water interface. (c) Theoretical symmetric prediction of the wave drag coefficient
 $C_{w}$
using Michell’s formula (3.4).

There are three major contributions to the measured drag: wave drag, form drag and skin drag (Newman Reference Newman2018). We have already described wave and form drag, and skin drag is the force associated with viscous friction on the wetted surface of the hull. We write the total drag coefficient in terms of this decomposition
 $$\begin{eqnarray}C_{d}=C_{w}+C_{f}+C_{s}.\end{eqnarray}$$
Note that the skin and form drag,
 $C_{s}$
and
 $C_{f}$
, are classically normalised by a factor
 $1/2\unicode[STIX]{x1D70C}U^{2}S$
, where
 $S$
is the wetted surface area. Here, they form part of the total drag coefficient
 $C_{d}$
, and so are normalised by
 $\unicode[STIX]{x1D70C}U^{2}\unicode[STIX]{x1D6FA}^{2/3}$
, as in (3.1). It is difficult to isolate and measure any one of these components. However, by measuring the drag on the hull shapes when placed in a wind tunnel, it is possible to isolate the skin and form contributions from the wave contribution. In doing this, we make the key assumption that the air–water interface does not affect the skin and form drag. For the small amplitude waves we consider, we expect this assumption to be valid since the problem is sufficiently linear that the coupling is weak.
To compare the wind tunnel and the tow-tank measurements, we use equivalent values of the Reynolds number in both air and water. For the tow-tank experiment the Reynolds number is given in terms of the Froude number by
 $Re_{water}=FrL\sqrt{gL}/\unicode[STIX]{x1D708}_{water}$
, where
 $\unicode[STIX]{x1D708}$
denotes the kinematic viscosity. The Reynolds number of the air in the wind tunnel is given by
 $Re_{air}=U_{air}L/\unicode[STIX]{x1D708}_{air}$
. By equating these, we obtain the required air velocity, which is given in terms of the Froude number as
 $U_{air}=Fr\sqrt{gL}(\unicode[STIX]{x1D708}_{air}/\unicode[STIX]{x1D708}_{water})$
.
In figure 4(b) we display measurements of the combined skin and form drag from the wind tunnel experiments, where the measured force
 $R_{air}$
is converted into the sum of the drag coefficients by the relationship
 $$\begin{eqnarray}C_{f}+C_{s}=\frac{R_{air}}{\unicode[STIX]{x1D70C}_{air}U_{air}^{2}\unicode[STIX]{x1D6FA}^{2/3}}.\end{eqnarray}$$
The measured coefficients in the plot are given in terms of the Froude number for the purpose of comparison with (a). In contrast to the tow-tank experiments, here we see an increase in drag for decreasing
 $\unicode[STIX]{x1D716}<0$
, and a decrease in drag for increasing
 $\unicode[STIX]{x1D716}>0$
. This is expected since hull shapes with
 $\unicode[STIX]{x1D716}>0$
are more streamlined for hull numbers increasing from one to five, whereas hull shapes with
 $\unicode[STIX]{x1D716}<0$
are less streamlined. Hence, it is clear that the effect of asymmetry on skin and form drag is completely the opposite to that on wave drag.
We also observe that the contribution of form and skin drag in this case is relatively small compared to the total drag. Therefore, it is expected that the wave drag component is responsible for the dominant behaviour seen in (a). In particular, the characteristic shape of the drag curves in (a), with peaks near
 $Fr=0.5$
are typical of wave drag measurements (Tuck Reference Tuck1989; Videler Reference Videler2012).
Now let us consider Michell’s theoretical prediction of the wave drag
 $C_{w}$
(Michell Reference Michell1898; Tuck Reference Tuck1989), which is given by the formula
 $$\begin{eqnarray}C_{w}=\frac{4\unicode[STIX]{x1D6FD}^{2/3}}{\unicode[STIX]{x03C0}\unicode[STIX]{x1D6FC}^{4/3}Fr^{4}}\int _{1}^{\infty }\frac{\unicode[STIX]{x1D706}^{2}}{\sqrt{\unicode[STIX]{x1D706}^{2}-1}}|G(\unicode[STIX]{x1D706})|^{2}\,\text{d}\unicode[STIX]{x1D706},\end{eqnarray}$$
where
 $\unicode[STIX]{x1D6FC}=L/W$
and
 $\unicode[STIX]{x1D6FD}=L/H_{w}$
are the horizontal and vertical aspect ratios of the wetted hull, and
 $G$
is an integral expression defined in terms of non-dimensional variables as
 $$\begin{eqnarray}G(\unicode[STIX]{x1D706})=\int _{-D/L}^{(-D+H_{w})/L}\int _{-1/2}^{1/2}[\,\hat{f}^{\prime }(\hat{x})]\text{e}^{(\unicode[STIX]{x1D706}^{2}\hat{z}+\text{i}\unicode[STIX]{x1D706}\hat{x})/Fr^{2}}\,\text{d}\hat{x}\,\text{d}\hat{z},\end{eqnarray}$$
where
 $\unicode[STIX]{x1D706}$
is a non-dimensional wavenumber. The central term in (3.5),
 $\hat{f}^{\prime }(\hat{x})$
, corresponds to a distribution of sources located along the
 $\hat{x}$
axis, with strength equivalent to forcing the impermeability condition along the body walls
 ${\hat{y}}=\pm \hat{f}(\hat{x})$
. Clearly, if
 $\hat{f}(\hat{x})$
is an asymmetric function, it makes no difference to (3.5) whether the body moves forwards or backwards (consider the transformation
 $\hat{x}\rightarrow -\hat{x}$
).
We use (3.4) and (3.5) to compute the theoretical prediction of
 $C_{w}$
, which we display in figure 4(c). We can see that Michell’s formula captures the general behaviour of the wave drag, exhibiting the characteristic peaks near
 $Fr=0.5$
, as seen in (a). However, it fails to distinguish between forward and backward motion. Indeed, if we sum Michell’s wave drag prediction
 $C_{w}$
and the wind tunnel measurements of form and skin drag
 $C_{f}+C_{s}$
, the only asymmetry effect observed comes from the form and skin components, which display the opposite trend to the tow-tank experiments in (a). Furthermore, apart from at small Froude numbers, there is no significant difference in the drag between the five hull shapes. Hence, such a model cannot be used to replicate the observed experimental results, and cannot be used to accurately search design spaces, or to find optimum asymmetry, for example.
We have also performed experimental measurements for each of the five slender and bluff bodies at depths between
 $d=0.5$
and
 $2.0$
and at Froude numbers between
 $0.3$
and
 $1.5$
, and these are presented in appendix B.
There are two further effects that we have not yet discussed but which deserve mentioning: capillary waves and nonlinear waves. As discussed by Fourdrinoy et al. (Reference Fourdrinoy, Caplier, Devaux, Rousseaux, Gianni, Zacharias, Jouteur, Martin, Dambrine and Petcu2019), capillary waves can have an impact on the wave resistance for small scale experiments. However, as shown by Benzaquen, Chevy & Raphaël (Reference Benzaquen, Chevy and Raphaël2011, figure 7), there is little difference between the pure gravity wave resistance and the gravity–capillary wave resistance provided the typical size of the object exceeds five capillary lengths, or approximately
 $1.5~\text{cm}$
. The smallest dimension of our hulls is the width
 $W=3~\text{cm}$
. Hence, whilst capillary waves may be present, and have wavelength
 $2\unicode[STIX]{x03C0}$
times the capillary length (
 $1.88~\text{cm}$
), which is comparable to the width of the hull, their contribution to the wave drag is a minor correction.
Secondly, it should be noted that the steepness of the generated waves in our experiments increases slightly with
 $Fr$
, and hence it is important to discuss the possible effect of nonlinearities (Pethiyagoda, McCue & Moroney Reference Pethiyagoda, McCue and Moroney2017). By photographing the wave patterns from above and from the side it is possible to estimate the maximum value of the wave steepness
 $kA$
, where
 $A$
is the amplitude and
 $k$
is the wavenumber, measured normal to the wave crest. Using this approach, the maximum value we find for the hulls in the slender family is
 $kA\approx 0.5$
(at
 $Fr=1$
). For the majority of cases in the slender family
 $kA$
is well below
 $0.5$
(particularly for
 $\unicode[STIX]{x1D716}<0$
and small
 $Fr$
) indicating that the effect of nonlinear waves is small and linear theory is appropriate. However, for the bluff family of shapes with
 $\unicode[STIX]{x1D716}>0$
we observe values of
 $kA$
closer to 1, and hence nonlinearities undoubtedly play a more important role (for example, see the very large drag coefficients calculated in figure 10
a).
4 Breaking the symmetry
In this section we use a combination of theoretical and numerical approaches to interpret the asymmetry effects observed in our experimental results. We start by proving that the wave resistance problem, as formulated by Michell using the steady Euler equations, has an inherent symmetry, rendering it incapable of predicting asymmetry effects. By adding dissipation the symmetry is broken. Hence, by using a
 $k$
–
 $\unicode[STIX]{x1D714}$
SST model (which is dissipative) we show that our experimentally observed asymmetry effects can be replicated. Finally, as a simpler alternative approach, we show that these asymmetry effects can also be captured by modifying Michell’s theory to account for the growth of a turbulent boundary layer.
4.1 A note on reversibility
Firstly, we describe the original formulation of the problem described by Michell (Reference Michell1898). We revert back to dimensional coordinates
 $(x,y,z)$
for convenience. In this framework, the velocity and pressure are denoted
 $\boldsymbol{u}=(u,v,w)$
and
 $p$
. Assuming incompressible, inviscid flow, the governing equations are the steady Euler equations
 $$\begin{eqnarray}\displaystyle & \displaystyle \unicode[STIX]{x1D735}\boldsymbol{\cdot }\boldsymbol{u}=0, & \displaystyle\end{eqnarray}$$
 $$\begin{eqnarray}\displaystyle & \displaystyle \unicode[STIX]{x1D70C}(\boldsymbol{u}\boldsymbol{\cdot }\unicode[STIX]{x1D735})\boldsymbol{u}=-\unicode[STIX]{x1D735}p-\unicode[STIX]{x1D70C}g\hat{\boldsymbol{k}}, & \displaystyle\end{eqnarray}$$
where
 $\hat{\boldsymbol{k}}$
is the unit vector in the vertical
 $z$
direction. The boundary conditions consist of the impermeability conditions on the hull walls, which are
 $$\begin{eqnarray}v=\pm u\,f^{\prime }(x),\quad \text{on }y=\pm f(x),\end{eqnarray}$$
the kinematic and dynamic conditions at the air–water interface
 $z=\unicode[STIX]{x1D701}(x,y)$
, which are
 $$\begin{eqnarray}\displaystyle & \displaystyle w=u\unicode[STIX]{x1D701}_{x}+v\unicode[STIX]{x1D701}_{y},\quad \text{on }z=\unicode[STIX]{x1D701}(x,y), & \displaystyle\end{eqnarray}$$
 $$\begin{eqnarray}\displaystyle & \displaystyle p=p_{atm},\quad \text{on }z=\unicode[STIX]{x1D701}(x,y), & \displaystyle\end{eqnarray}$$
as well as appropriate conditions at infinity
 $$\begin{eqnarray}\boldsymbol{u}\rightarrow (-U,0,0),\quad x,y,z\rightarrow \pm \infty ,\end{eqnarray}$$
where we have chosen the frame of the moving body. Following this, Michell then assumes an irrotational flow so that the above formulation can be written in terms of a velocity potential, and then applies slender body theory to linearise the boundary conditions. However, it is clear that, even before making these final assumptions, there is already an inherent symmetry in the problem formulation.
To illustrate this, first consider that
 $\boldsymbol{u}^{\ast }$
,
 $p^{\ast }$
and
 $\unicode[STIX]{x1D701}^{\ast }$
are solutions to the free boundary problem (4.1)–(4.6). Then consider switching the direction of the free stream
 $U\rightarrow -U$
. It is straightforward to show that the reversed flow problem has a solution
 $-\boldsymbol{u}^{\ast }$
,
 $p^{\ast }$
and
 $\unicode[STIX]{x1D701}^{\ast }$
, regardless of whether
 $\hat{f}(\hat{x})$
is an asymmetric function. Hence, the problem is invariant under a change in the direction of motion. Consequently, such a formulation cannot predict the effects of asymmetry, such as those we have observed experimentally.
There are several possible explanations for the failure of the above formulation to capture asymmetry effects. Firstly, we observe that by including a viscous term
 $\unicode[STIX]{x1D707}\unicode[STIX]{x1D6FB}^{2}\boldsymbol{u}$
on the right-hand side of (4.2), the variables
 $-\boldsymbol{u}^{\ast }$
,
 $p^{\ast }$
and
 $\unicode[STIX]{x1D701}^{\ast }$
no longer satisfy the reversed flow problem. This indicates that neglecting viscosity in the Euler equations may be responsible for the failure. One could similarly argue that the failure is caused by choosing the steady equations, which neglect the acceleration term
 $\unicode[STIX]{x1D70C}\unicode[STIX]{x2202}\boldsymbol{u}/\unicode[STIX]{x2202}t$
term on the left-hand side of (4.2).
Here, we show that it is sufficient to account for viscosity to capture the effect of body asymmetry on drag. We illustrate this in two ways. Firstly, with a steady
 $k$
–
 $\unicode[STIX]{x1D714}$
SST turbulence model. Then, by modifying Michell’s theory to include the growth of a turbulent boundary layer.
4.2 Results from a
$k$
–
$\unicode[STIX]{x1D714}$
SST model


Since we consider situations where the Reynolds number is between
 $Re=10^{5}$
and
 $Re=10^{8}$
, the flow near the hull is expected to be turbulent. Hence, we model the flow with a steady three-dimensional
 $k$
–
 $\unicode[STIX]{x1D714}$
SST model (Menter Reference Menter1994), where the air–water interface is treated with the volume of fluid method (Ubbink Reference Ubbink1997; Berberovi et al.
Reference Berberović, van Hinsberg, Jakirlić, Roisman and Tropea2009). The momentum equation of the
 $k$
–
 $\unicode[STIX]{x1D714}$
SST model contains a term on the right-hand side of the form
 $(\unicode[STIX]{x1D735}\boldsymbol{ : }(\unicode[STIX]{x1D707}+\unicode[STIX]{x1D707}_{t})(\unicode[STIX]{x1D735}\boldsymbol{u}+\unicode[STIX]{x1D735}\boldsymbol{u}^{\text{T}}))$
, where
 $\unicode[STIX]{x1D707}_{t}=\unicode[STIX]{x1D707}_{t}(k,\unicode[STIX]{x1D714})$
is a nonlinear eddy viscosity. As explained above, this term breaks the symmetry of the problem, allowing us to distinguish between forward and backward motion.
Since it is not possible to perform computations on an infinite domain, instead we use a finite domain with boundaries more than
 $20$
hull lengths away from the centre of the hull. We find this is sufficient to avoid significant effects due to wave reflections from the edges. In addition, since the problem is symmetric about the plane
 $y=0$
, we only solve for
 $y\geqslant 0$
. We use a cuboid mesh with
 $(40,20,120)$
elements in the
 $(x,y,z)$
directions, spaced non-uniformly such that the resolution near the hull walls and at the air–water interface is much higher than in the far field. We have also tried finer mesh resolutions, and we find that this mesh resolution is sufficient to resolve all the details of the flow.
In addition to the boundary conditions (4.3)–(4.6), we also impose no-slip conditions on the hull walls, and appropriate conditions for the turbulence variables
 $k$
and
 $\unicode[STIX]{x1D714}$
, which we do not describe here, but which are given by Menter (Reference Menter1994). We use standard values for all the turbulence parameters, which are also given by Menter (Reference Menter1994).
Computational results from a
 $k$
–
 $\unicode[STIX]{x1D714}$
SST model at depth
 $d=0.5$
. (a,b) Surface plots of the air–water interface for hull 5 from the slender family at Froude number
 $Fr=0.5$
with positive and negative
 $\unicode[STIX]{x1D716}$
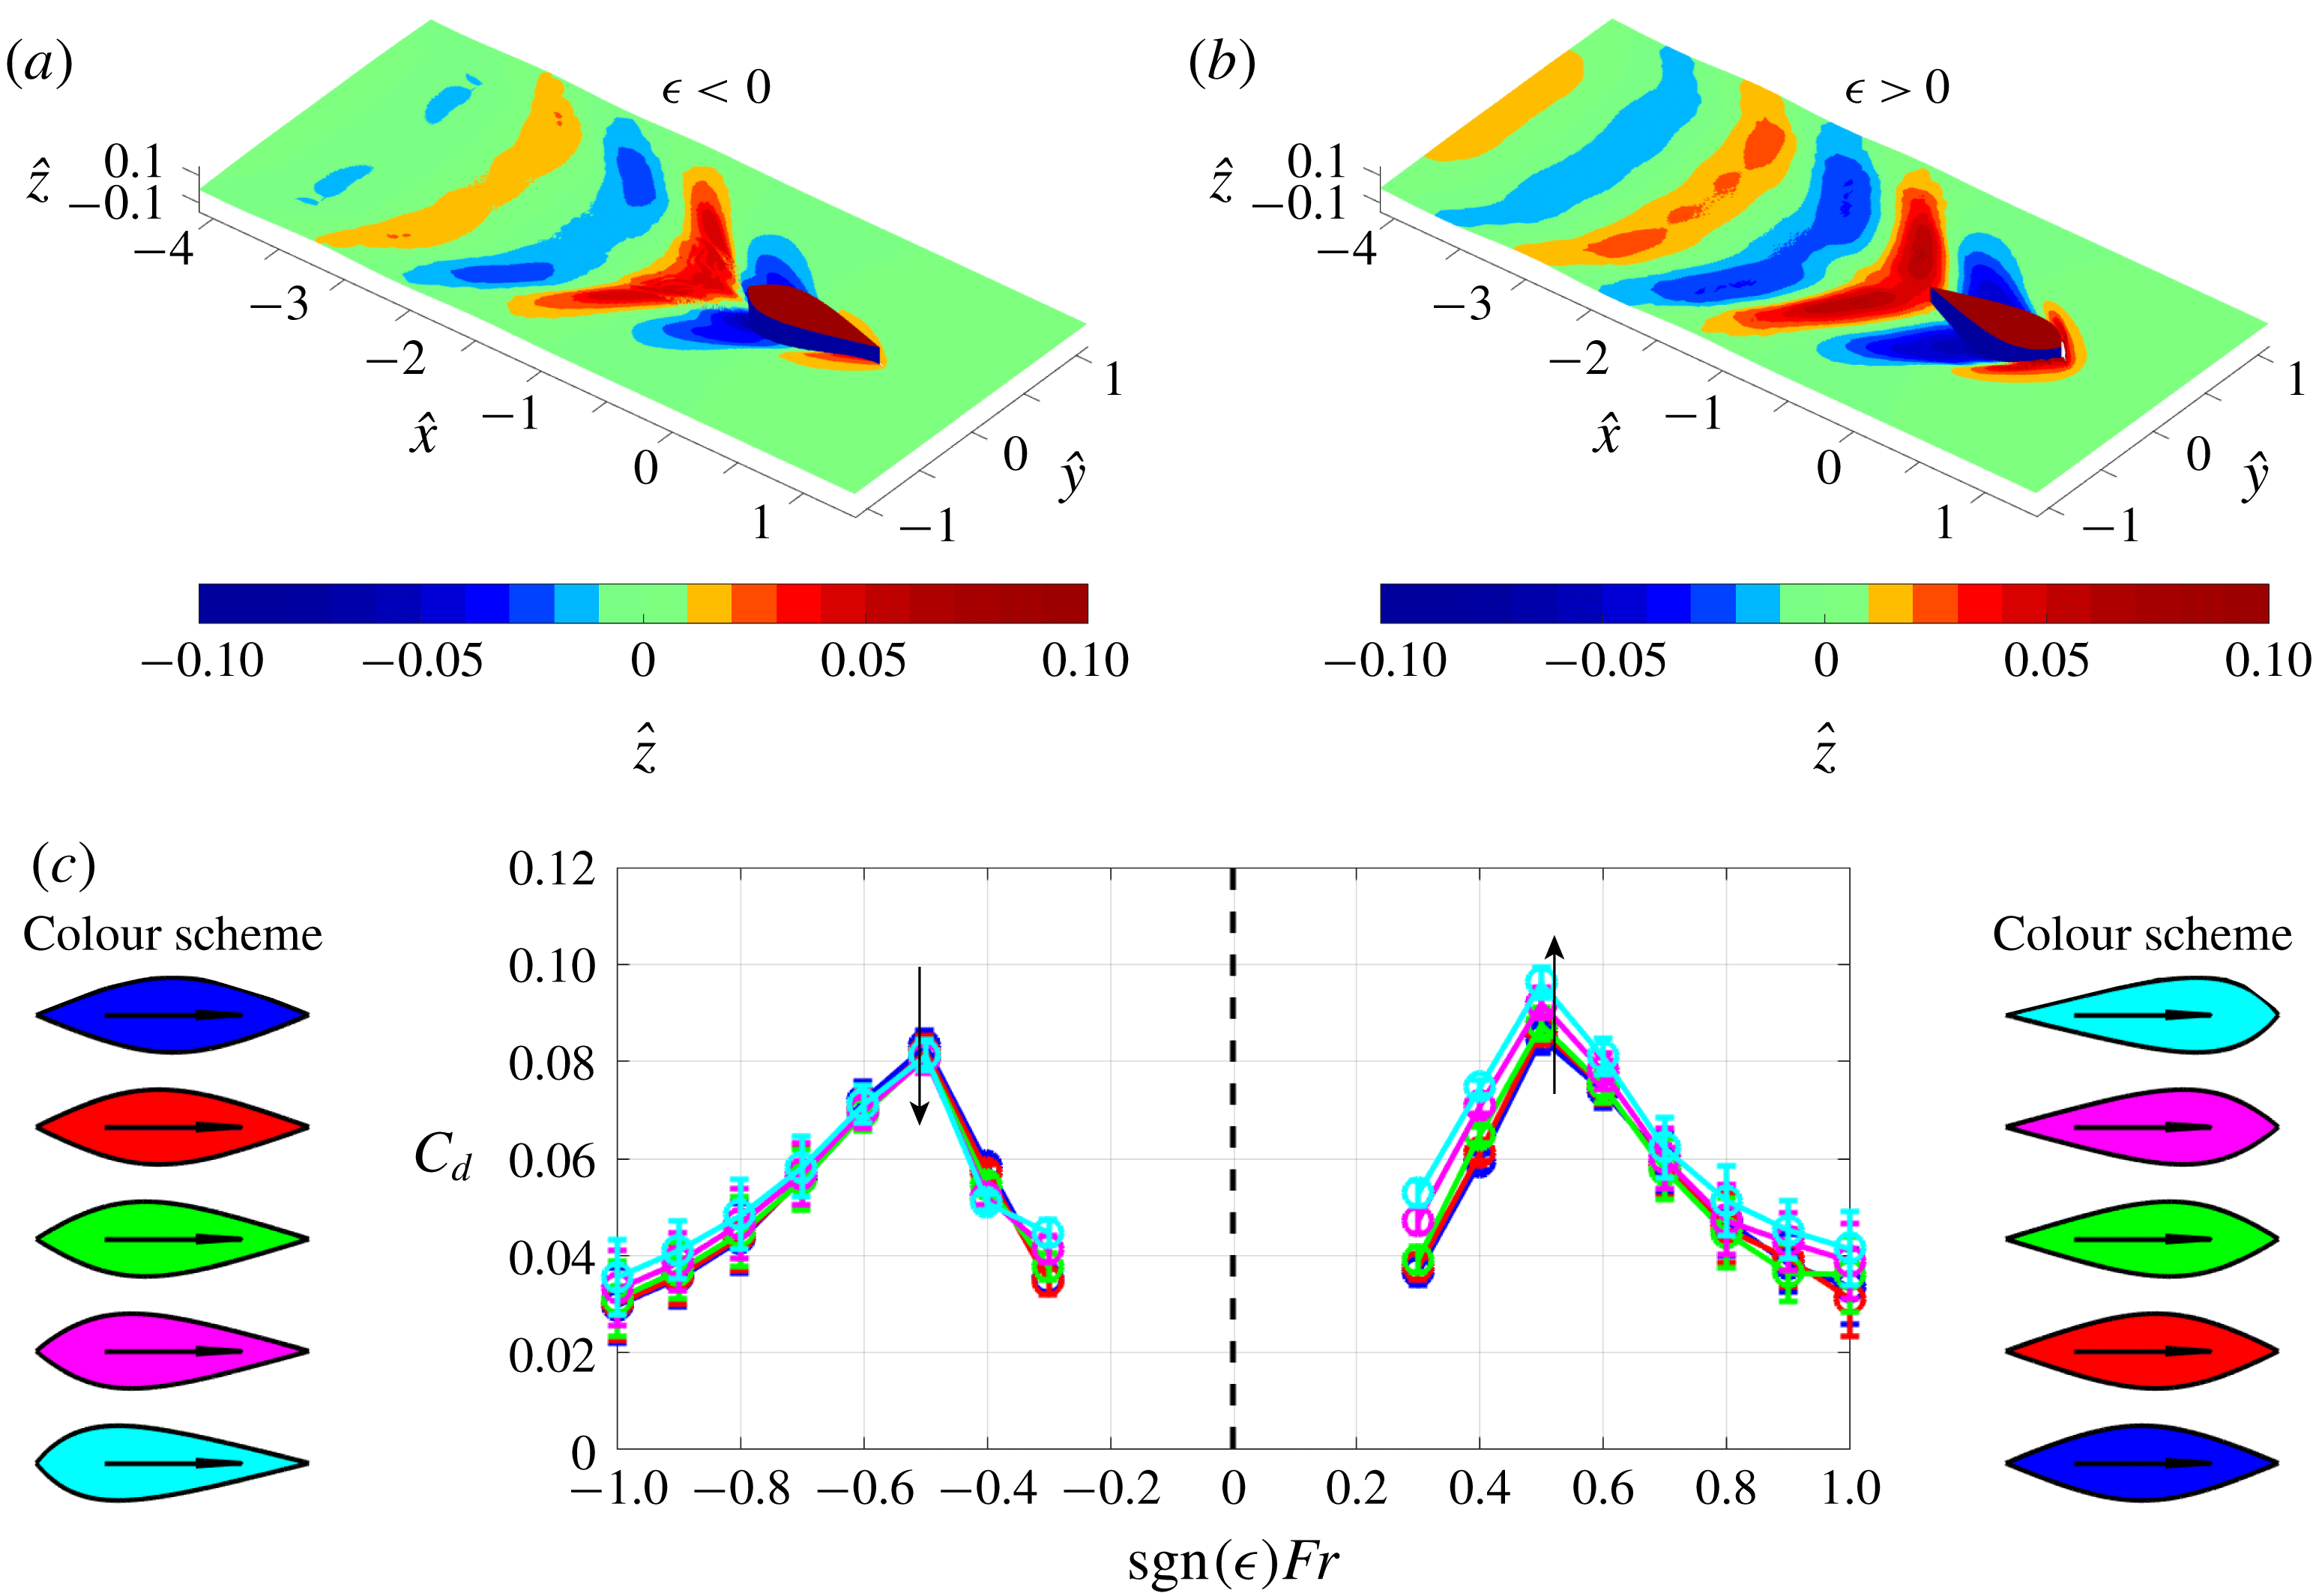
. (c) Numerically computed drag coefficient for comparison with figure 4.

In figure 5(a,b) we display surface plots of the air–water interface solution for the case of hull 5 (from the slender family) with both positive and negative
 $\unicode[STIX]{x1D716}$
. In each case the Froude number is
 $Fr=0.5$
. We can see the classic Kelvin wake pattern behind the hulls, although the waves for
 $\unicode[STIX]{x1D716}>0$
are larger in amplitude and persist further downstream, illustrating just one asymmetry effect.
In figure 5(c) we display drag coefficients calculated for all five hull shapes from the slender family, with both positive and negative
 $\unicode[STIX]{x1D716}$
, and for Froude numbers
 $Fr=0.3{-}1.0$
. The depth is fixed at
 $d=0.5$
for the sake of comparison with figure 4. In each case the drag coefficients are calculated by integrating the stress around the hull surface and normalising by a factor
 $\unicode[STIX]{x1D70C}U^{2}\unicode[STIX]{x1D6FA}^{2/3}$
, as in (3.1).
Overall, there is relatively good agreement between the experimental and numerical results. The
 $k$
–
 $\unicode[STIX]{x1D714}$
SST model captures the correct magnitude of the drag coefficient, as well as the appropriate increase in
 $C_{d}$
for increasing
 $\unicode[STIX]{x1D716}>0$
and the decrease for decreasing
 $\unicode[STIX]{x1D716}<0$
. However, the difference in
 $C_{d}$
between the different hull shapes is not as large as measured in the experiments. This discrepancy is most likely due to inaccurate treatment of the water surface using the volume of fluid method, which is known to over-diffuse sharp interfaces (Theodorakakos & Bergeles Reference Theodorakakos and Bergeles2004). Accuracy could possibly be improved using other techniques, such as the level set method, or mesh deforming. Nevertheless, the
 $k\text{-}\unicode[STIX]{x1D714}$
SST model with the volume of fluid method is clearly capable of capturing asymmetry effects, at least qualitatively.
We have also performed computations for the bluff family of shapes at various depths, and these are presented in appendix B. In particular, the bluff family of shapes exhibits more of an extreme difference in drag between
 $\unicode[STIX]{x1D716}>0$
and
 $\unicode[STIX]{x1D716}<0$
, and this is detected more clearly with the
 $k$
–
 $\unicode[STIX]{x1D714}$
SST simulations (e.g. figure 10
e).
4.3 Modification of Michell’s theory
Next we show that a simple modification to Michell’s theory can account for the effects of body asymmetry, capturing the distinction between forward and backward motions. A possible theoretical underpinning for such distinction is the effect of viscosity. Since, with a viscous description of the flow, there is a boundary layer near the hull walls, our approach here is to modify Michell’s theory to account for the growth of this boundary layer. We find that this effective approach captures the trends observed experimentally.
With a viscous description of the flow, the impermeability condition (4.3) is replaced by a no-slip condition on the body walls. The flow is then decomposed into an inner boundary layer region, where the effect of viscosity is important, and an outer inviscid potential-flow region. In our current approach, we treat the edge of the boundary layer as an impermeable surface to the potential flow region (or equivalently a streamline which passes around the hull). Then, we advance in the same manner as Michell (Reference Michell1898), as described in § 4.1, except that we impose the impermeability condition (4.3) on the combined shape of the hull plus its boundary layer. By doing so, we replace the hull with a new larger shape which has non-zero width at the trailing edge. We expect the boundary layer to have approximately the same aspect ratio as the hull shape, so that slender body theory still applies. Furthermore, the wave drag force due to pressure variations along the hull wall are transmitted to the edge of the boundary layer, since pressure is expected to be uniform across the boundary layer width (Schlichting et al. Reference Schlichting, Gersten, Krause, Oertel and Mayes1960).
For the purposes of this study, we take the boundary layer thickness as the 99 % definition
 $\unicode[STIX]{x1D6FF}_{0.99}(x)$
: for a given
 $(x,y)$
plane, this is defined as the
 $y$
value that corresponds to where the streamwise velocity is at 99 % of its maximum
 $u(x,y=\unicode[STIX]{x1D6FF}_{0.99}(x))=0.99\max \{u(x,y)\}$
. Inserting the combined shape of the hull plus its boundary layer into Michell’s non-dimensional formula for the wave drag (3.5), we get
 $$\begin{eqnarray}G(\unicode[STIX]{x1D706})=\int _{-D/L}^{(-D+H_{w})/L}\int _{-1/2}^{1/2}[\,\hat{f}^{\prime }(\hat{x})+\hat{\unicode[STIX]{x1D6FF}}_{0.99}^{\prime }(\hat{x})]\text{e}^{(\unicode[STIX]{x1D706}^{2}\hat{z}+\text{i}\unicode[STIX]{x1D706}\hat{x})/Fr^{2}}\,\text{d}\hat{x}\,\text{d}\hat{z}.\end{eqnarray}$$
Here, we have made the assumption that
 $\hat{\unicode[STIX]{x1D6FF}}_{0.99}^{\prime }(\hat{x})=0$
for
 $|\hat{x}|>1/2$
. This is equivalent to a boundary layer which begins growing at the leading edge and at the trailing edge, it turns into a wake region which remains at constant width downstream.
To estimate the boundary layer thickness, we make use of our
 $k\text{-}\unicode[STIX]{x1D714}$
SST simulations. To reduce noise, we extract the boundary layer thickness from simulations where the hull is deeply submerged beneath the water surface (
 $d=2.0$
). We assume that the boundary layer profile does not change much with depth, and it is therefore acceptable to use the profile measured at
 $d=2.0$
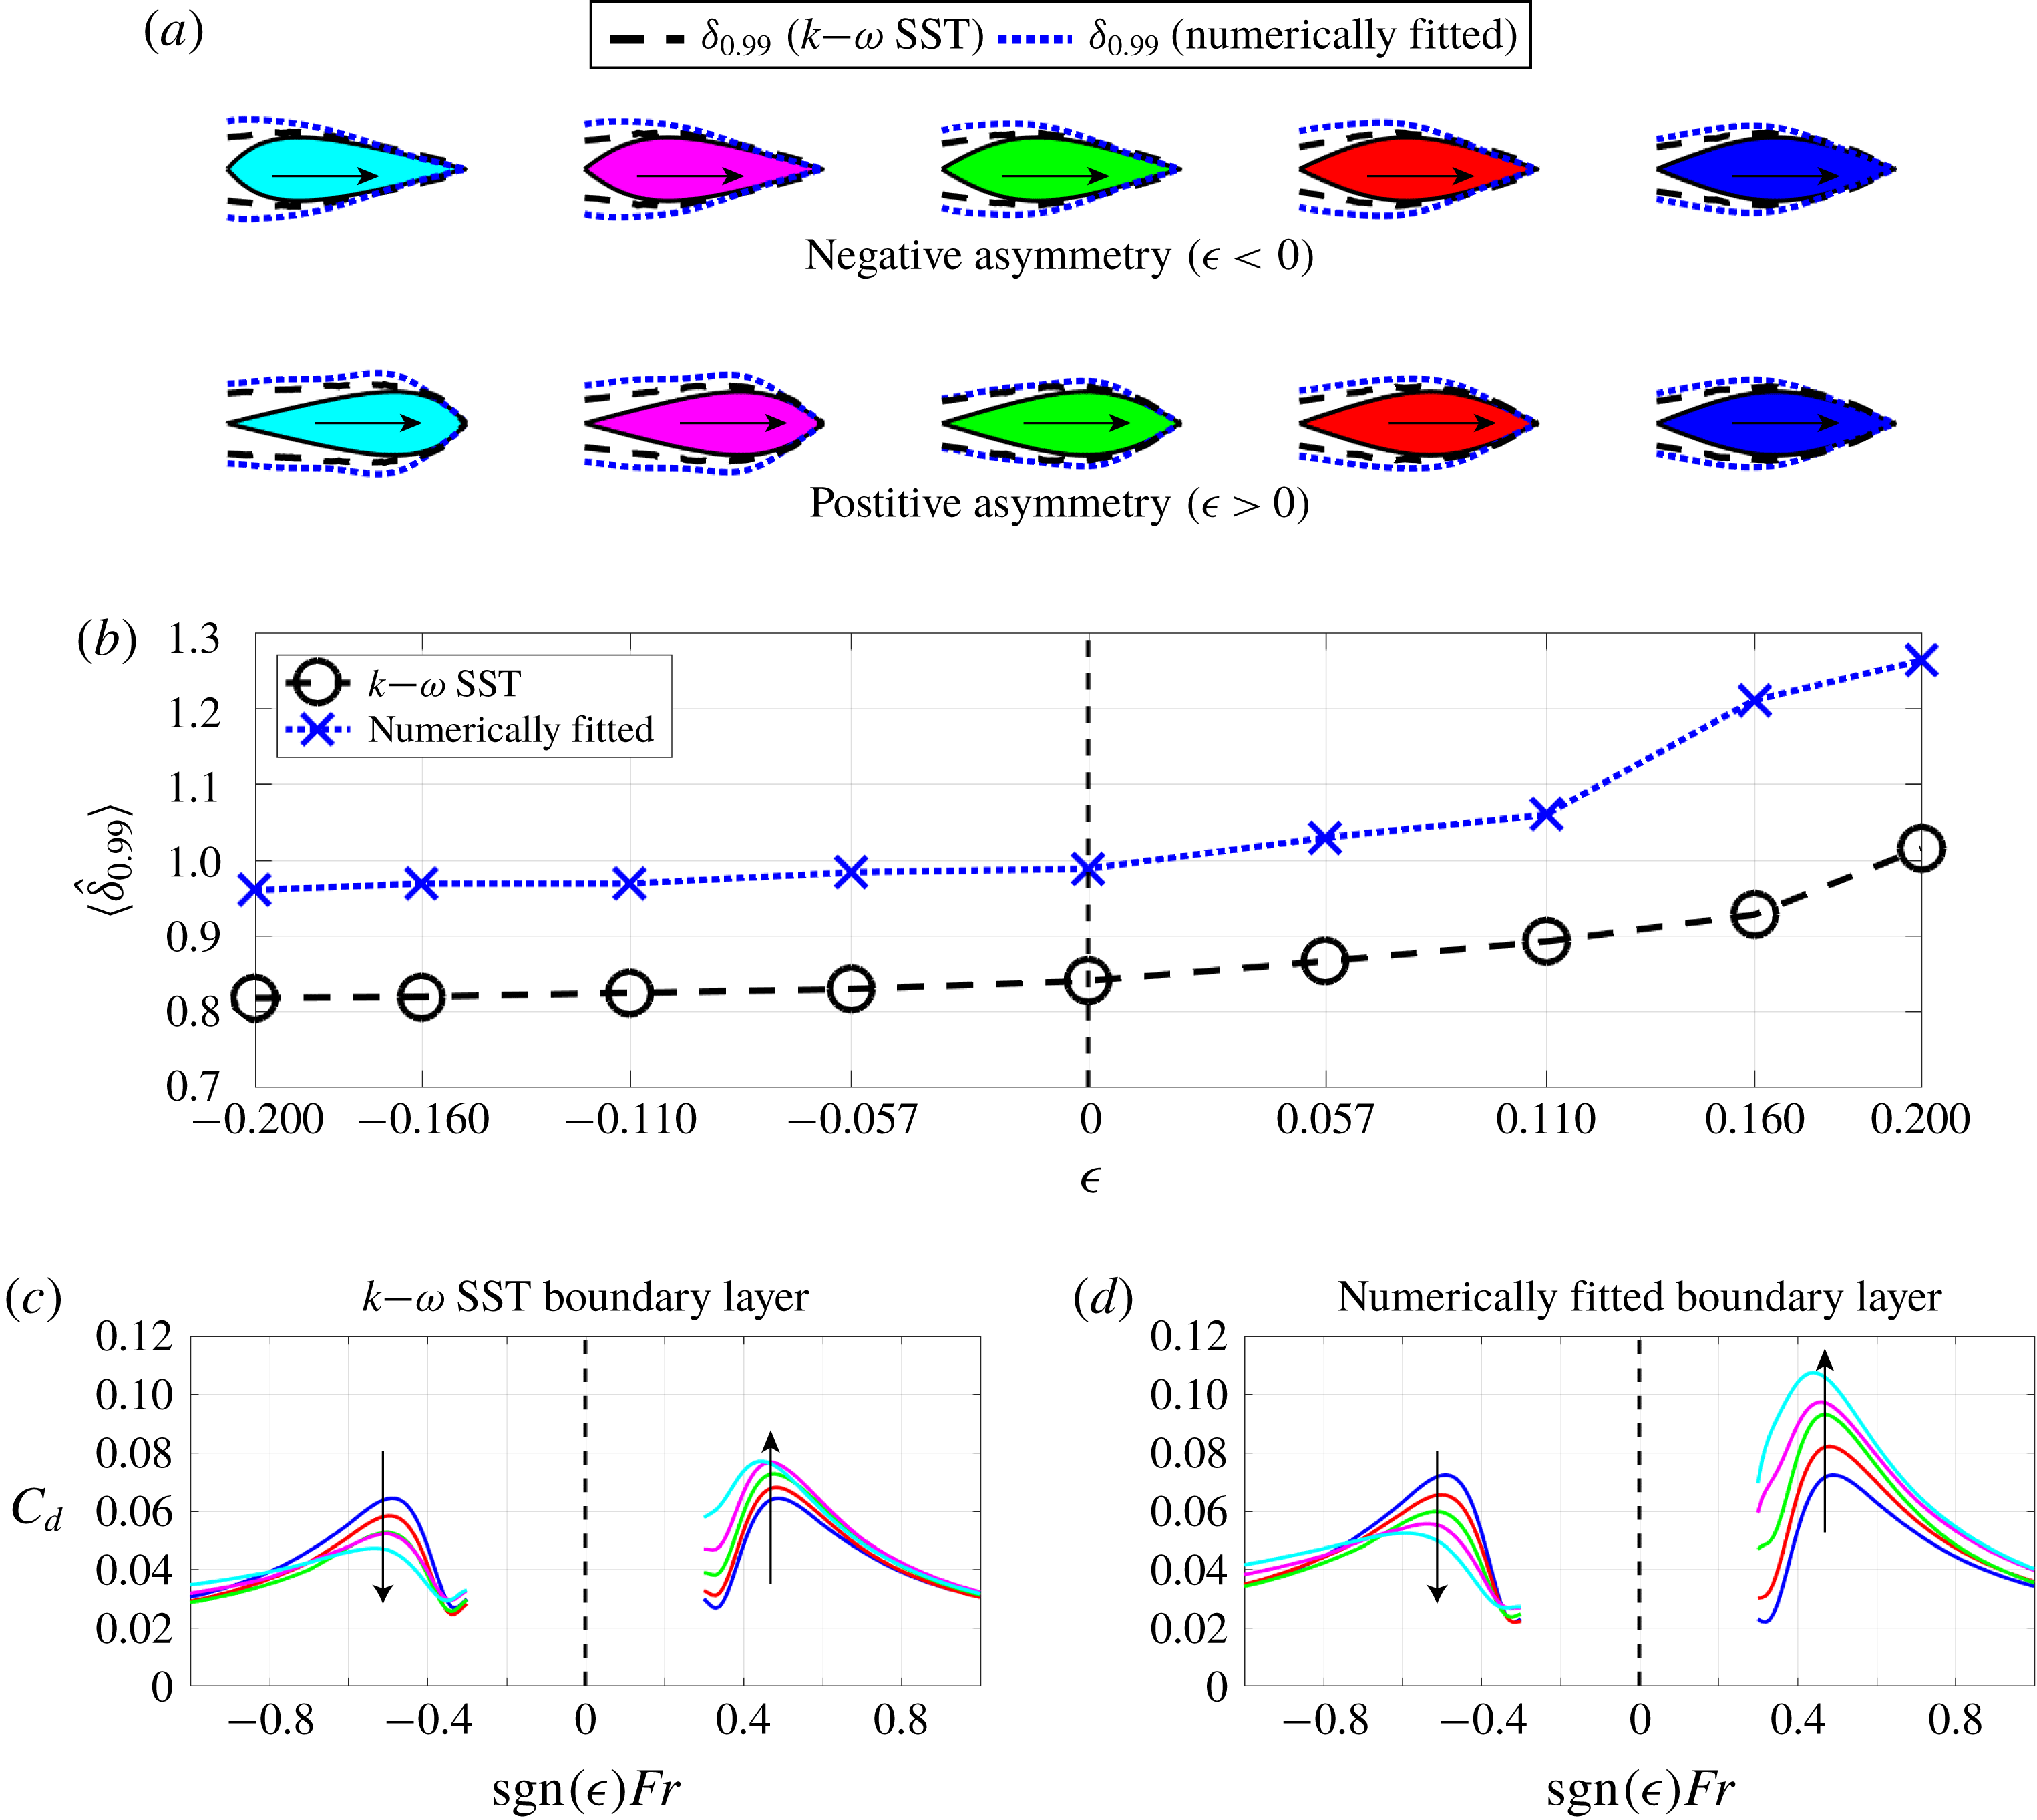
for all depths. The boundary layer thickness for each hull shape is displayed in figure 6(a) with black dashed lines. For
 $\unicode[STIX]{x1D716}<0$
the boundary layer grows slowly for the majority of the hull shape, and then very rapidly at the trailing edge. By contrast, for
 $\unicode[STIX]{x1D716}>0$
the boundary layer only grows slowly near the leading edge, and then rapidly thereafter. A useful measure for the size of the boundary layer is the average width
 $\langle \hat{\unicode[STIX]{x1D6FF}}_{0.99}\rangle =\int _{-1/2}^{1/2}\hat{\unicode[STIX]{x1D6FF}}_{0.99}\,\text{d}\hat{x}$
. We plot
 $\langle \hat{\unicode[STIX]{x1D6FF}}_{0.99}\rangle$
calculated for each of the hull shapes in (b). Clearly, we see that the average boundary layer thickness is larger for
 $\unicode[STIX]{x1D716}>0$
than for
 $\unicode[STIX]{x1D716}<0$
(e.g. 24 % larger for hull 5).
(a) Turbulent boundary layers for the five hulls from the slender family, with
 $\unicode[STIX]{x1D716}>0$
and
 $\unicode[STIX]{x1D716}<0$
. For the
 $k$
–
 $\unicode[STIX]{x1D714}$
SST model we take the boundary layer as the 99 % thickness. For the numerically fitted boundary layer, we use (4.7) and a numerical optimisation routine to find the boundary layer profile that best matches the theoretical and experimental drag coefficients. (b) Corresponding average boundary layer thickness. (c,d) Theoretical drag coefficients for
 $d=0.5$
calculated using (4.7) with the corresponding boundary layer profiles, in conjunction with wind tunnel measurements for
 $C_{f}+C_{s}$
(to be compared with figures 4 and 5).

Using the modification to Michell’s theory (4.7) with the boundary layer thicknesses extracted from the
 $k$
–
 $\unicode[STIX]{x1D714}$
simulations, in conjunction with the wind tunnel measurements of the skin and form drag, we calculate the total drag (3.2) for each of the five slender hulls with both
 $\unicode[STIX]{x1D716}<0$
and
 $\unicode[STIX]{x1D716}>0$
. The results are plotted in figure 6(c). We see that the trend observed in the experimental results from figure 4 is replicated very well, even better than the numerical calculations in figure 5. The hulls with positive
 $\unicode[STIX]{x1D716}$
have increased drag, whilst those with negative
 $\unicode[STIX]{x1D716}$
have decreased drag. However, there is clearly still some discrepancy for the shapes with large
 $\unicode[STIX]{x1D716}>0$
(e.g. the drag on hull 5 at
 $Fr=0.5$
is too small).
It is interesting to note that, whilst the modified Michell theory uses a boundary layer extracted from the
 $k$
–
 $\unicode[STIX]{x1D714}$
SST model, the drag coefficients show better comparison with experimental data than those calculated directly by the
 $k$
–
 $\unicode[STIX]{x1D714}$
SST model. As described earlier, the discrepancy between the numerically calculated drag coefficients and the experimentally measured ones is most likely explained by an over-diffusion of the interface that is associated with the volume of fluid method. Hence, it seems that Michell’s theory, modified to account for the boundary layer, has a better reconstruction of the interface than the volume of fluid method.
We also note that even though the combined shape of the hull plus its boundary layer is bigger than the original hull
 $\hat{f}+\hat{\unicode[STIX]{x1D6FF}}_{0.99}\geqslant \hat{f}$
, the modification (4.7) can produce either an increase or a decrease in wave drag, depending on the sign of
 $\unicode[STIX]{x1D716}$
. Therefore, the average width
 $\langle \hat{\unicode[STIX]{x1D6FF}}_{0.99}\rangle$
does not provide enough information alone to indicate whether the asymmetry is advantageous or disadvantageous. Instead, we require full knowledge of the boundary layer profile
 $\hat{\unicode[STIX]{x1D6FF}}_{0.99}(\hat{x})$
, inserted into (4.7).
We have also tried fitting the shape of the boundary layer
 $\hat{\unicode[STIX]{x1D6FF}}_{0.99}(\hat{x})$
to match the theoretical wave drag coefficient (4.7) and the experimental data in figure 4(a), using a numerical least-squares optimisation method. We give the details of this optimisation to appendix C, but we display the results in figure 6(d). The corresponding boundary layer thicknesses are displayed in (a) with blue dotted curves, and the mean thickness in (b). The numerical optimisation matches the theoretical data with the experimental data extremely well. The average relative error is approximately 5 %, compared to 18 % using the
 $k$
–
 $\unicode[STIX]{x1D714}$
SST boundary layer in (c), and 26 % using no boundary layer at all.
The numerical optimisation finds a slightly larger boundary layer thickness than that extracted from the
 $k$
–
 $\unicode[STIX]{x1D714}$
SST model. There are several possible reasons for this discrepancy. For example, the
 $k$
–
 $\unicode[STIX]{x1D714}$
SST model may under-predict the growth of the turbulent boundary layer. Or, perhaps the fitted boundary layer naturally corresponds to a larger thickness than the 99 % definition. In any case, it is evident from the boundary layer profiles in figure 6(a) that the fitted boundary layer and the
 $k$
–
 $\unicode[STIX]{x1D714}$
SST boundary layer are similar in shape. This suggests that our modification to Michell’s theory is appropriate, and provided good knowledge of the boundary layer profile, the wave drag on an asymmetric body can be predicted much more reliably than the original formulation (3.5). However, we acknowledge that this is an effective approach, and does not manifest a complete description of the flow in the boundary layer.
5 Influence of the depth of motion
In figure 3 we showed that asymmetry can be advantageous or disadvantageous, depending on whether the body is near or far away from the air–water interface. This is explained by the relative importance of wave and form drag. For large depths, form drag dominates over wave drag, such that positive asymmetry is favourable. On the other hand, at shallower depths wave drag dominates over form drag, such that negative asymmetry is better. Whilst we have shown that, using a wind tunnel, it is possible to measure wave drag independently from the combined total of skin and form drag, it is quite challenging to treat form and skin components independently, at least from an experimental point of view. However, with numerical simulations, such as the
 $k\text{-}\unicode[STIX]{x1D714}$
SST model, this is relatively straightforward. Being able to decompose the drag into these three components is very useful when comparing their relative magnitudes.
From the results of our
 $k$
–
 $\unicode[STIX]{x1D714}$
SST model, it is possible to extract the time-averaged pressure and viscous stresses integrated over the hull surface. Since form and wave drag result from a pressure force, these are lumped together to form a pressure coefficient, which we denote
 $C_{p}$
. This is given in dimensional terms as
 $$\begin{eqnarray}C_{p}:=C_{f}+C_{w}=\frac{1}{\unicode[STIX]{x1D70C}U^{2}\unicode[STIX]{x1D6FA}^{2/3}}\int _{S}(p\,\unicode[STIX]{x1D644}\boldsymbol{\cdot }\hat{\boldsymbol{n}})\boldsymbol{\cdot }\hat{\boldsymbol{\imath }}\,\text{d}S,\end{eqnarray}$$
where
 $\hat{\boldsymbol{\imath }}$
is the unit vector in the
 $x$
direction,
 $\hat{\boldsymbol{n}}$
is the unit outward-pointing normal to the hull surface
 $S$
, and
 $\unicode[STIX]{x1D644}$
is the identity matrix. Similarly, the skin drag can be calculated from the viscous stress component
 $$\begin{eqnarray}C_{s}=\frac{1}{\unicode[STIX]{x1D70C}U^{2}\unicode[STIX]{x1D6FA}^{2/3}}\int _{S}\unicode[STIX]{x1D707}((\unicode[STIX]{x1D735}\boldsymbol{u}+\unicode[STIX]{x1D735}\boldsymbol{u}^{\text{T}})\boldsymbol{\cdot }\hat{\boldsymbol{n}})\boldsymbol{\cdot }\hat{\boldsymbol{\imath }}\,\text{d}S.\end{eqnarray}$$
It is not immediately obvious how to split
 $C_{f}$
and
 $C_{w}$
in (5.1). However, this can be achieved by noting two particular properties of
 $C_{f}$
and
 $C_{w}$
. Firstly, in the limit
 $Fr\rightarrow 0$
or
 $Fr\rightarrow \infty$
, we expect
 $C_{w}\rightarrow 0$
(Michell Reference Michell1898; Tuck Reference Tuck1989). Secondly, we do not expect
 $C_{f}$
to depend strongly on the Reynolds number, and hence the Froude number (see figure 4
b). Hence, the form drag can be extracted as
 $$\begin{eqnarray}C_{f}=\lim _{Fr\rightarrow 0}C_{p}(Fr),\end{eqnarray}$$
and, consequently, the wave drag can be approximated as
 $$\begin{eqnarray}C_{w}(Fr)=C_{p}(Fr)-C_{f}.\end{eqnarray}$$
We are unable to compute
 $C_{d}$
in the limit
 $Fr\rightarrow 0$
since the
 $k$
–
 $\unicode[STIX]{x1D714}$
SST model is only valid for turbulent flows. Hence, we approximate (5.3) by averaging
 $C_{d}$
over a few small values of
 $Fr$
. We think this is an acceptable approach, since from figure 4(c) we can see that Michell’s theory predicts rapid decay of
 $C_{w}$
for
 $Fr<0.2$
.
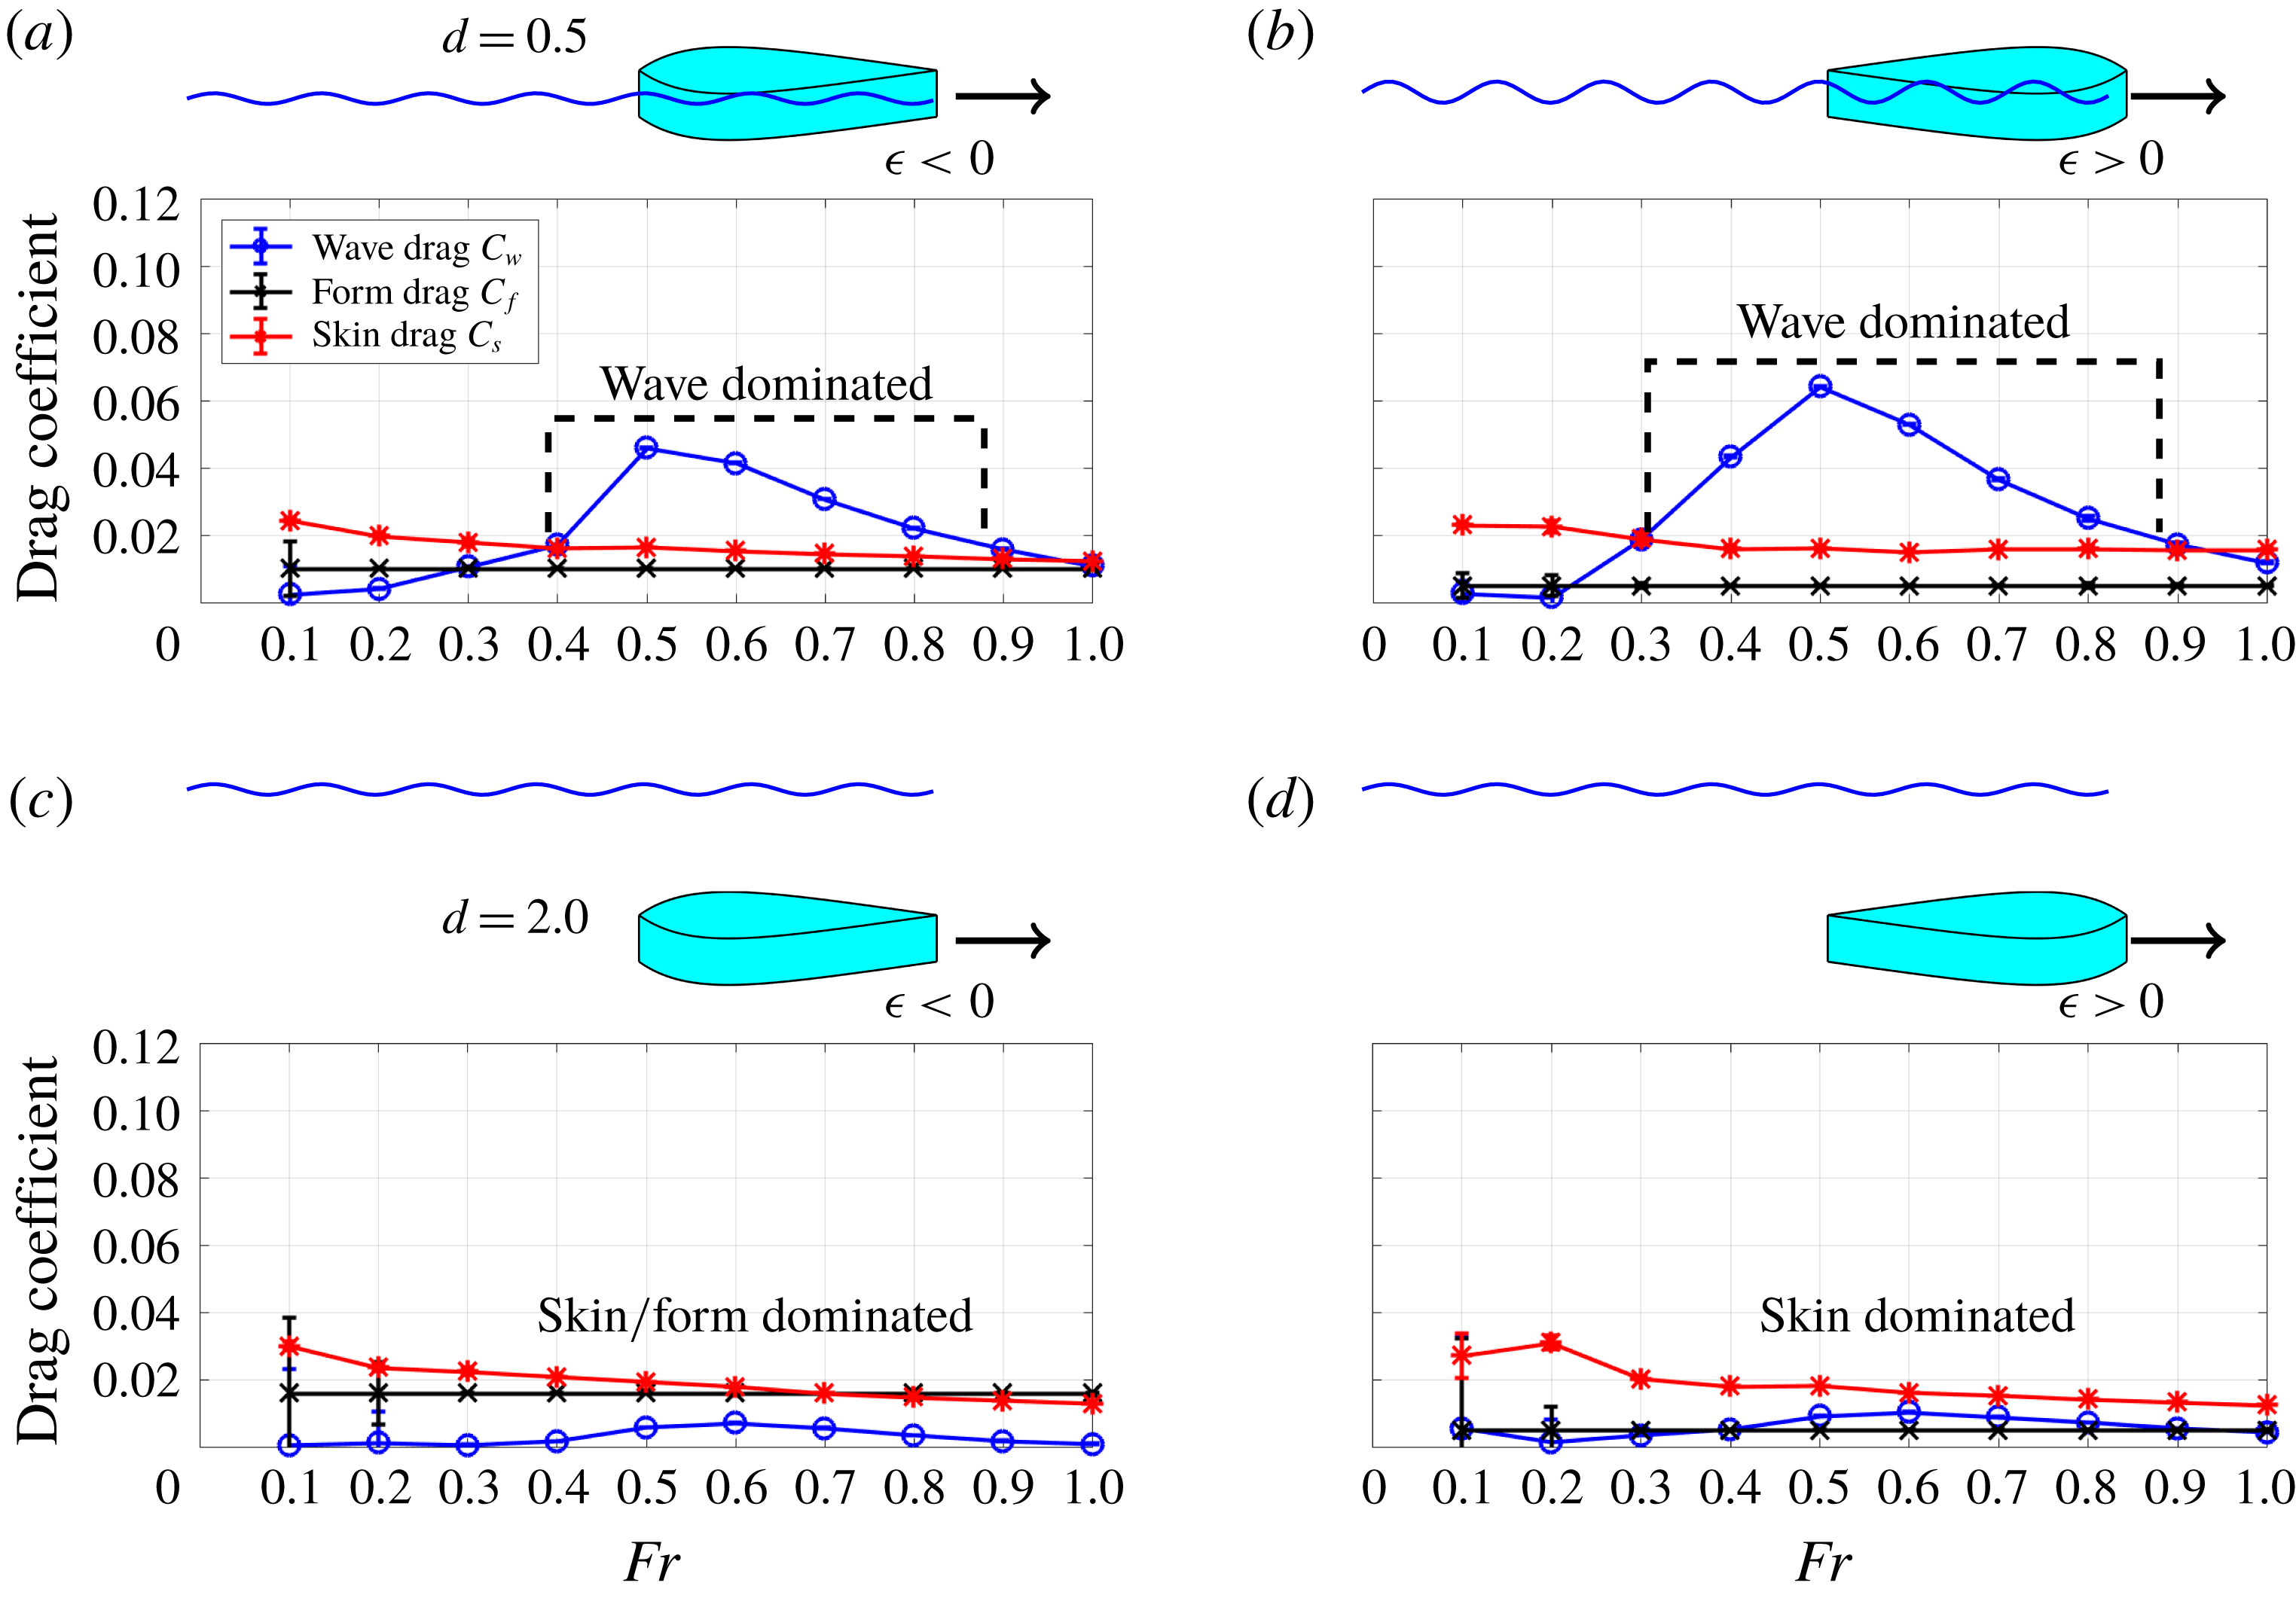
Results from the
 $k$
–
 $\unicode[STIX]{x1D714}$
SST model, where the numerically computed drag coefficient is decomposed into wave, form and skin components
 $C_{w},C_{f},C_{s}$
. (a,b) Hull 5 from the slender family at depth
 $d=0.5$
with
 $\unicode[STIX]{x1D716}<0$
(a) and
 $\unicode[STIX]{x1D716}>0$
(b). (c,d) Hull 5 from the slender family at depth
 $d=2.0$
with
 $\unicode[STIX]{x1D716}<0$
(c) and
 $\unicode[STIX]{x1D716}>0$
(d).

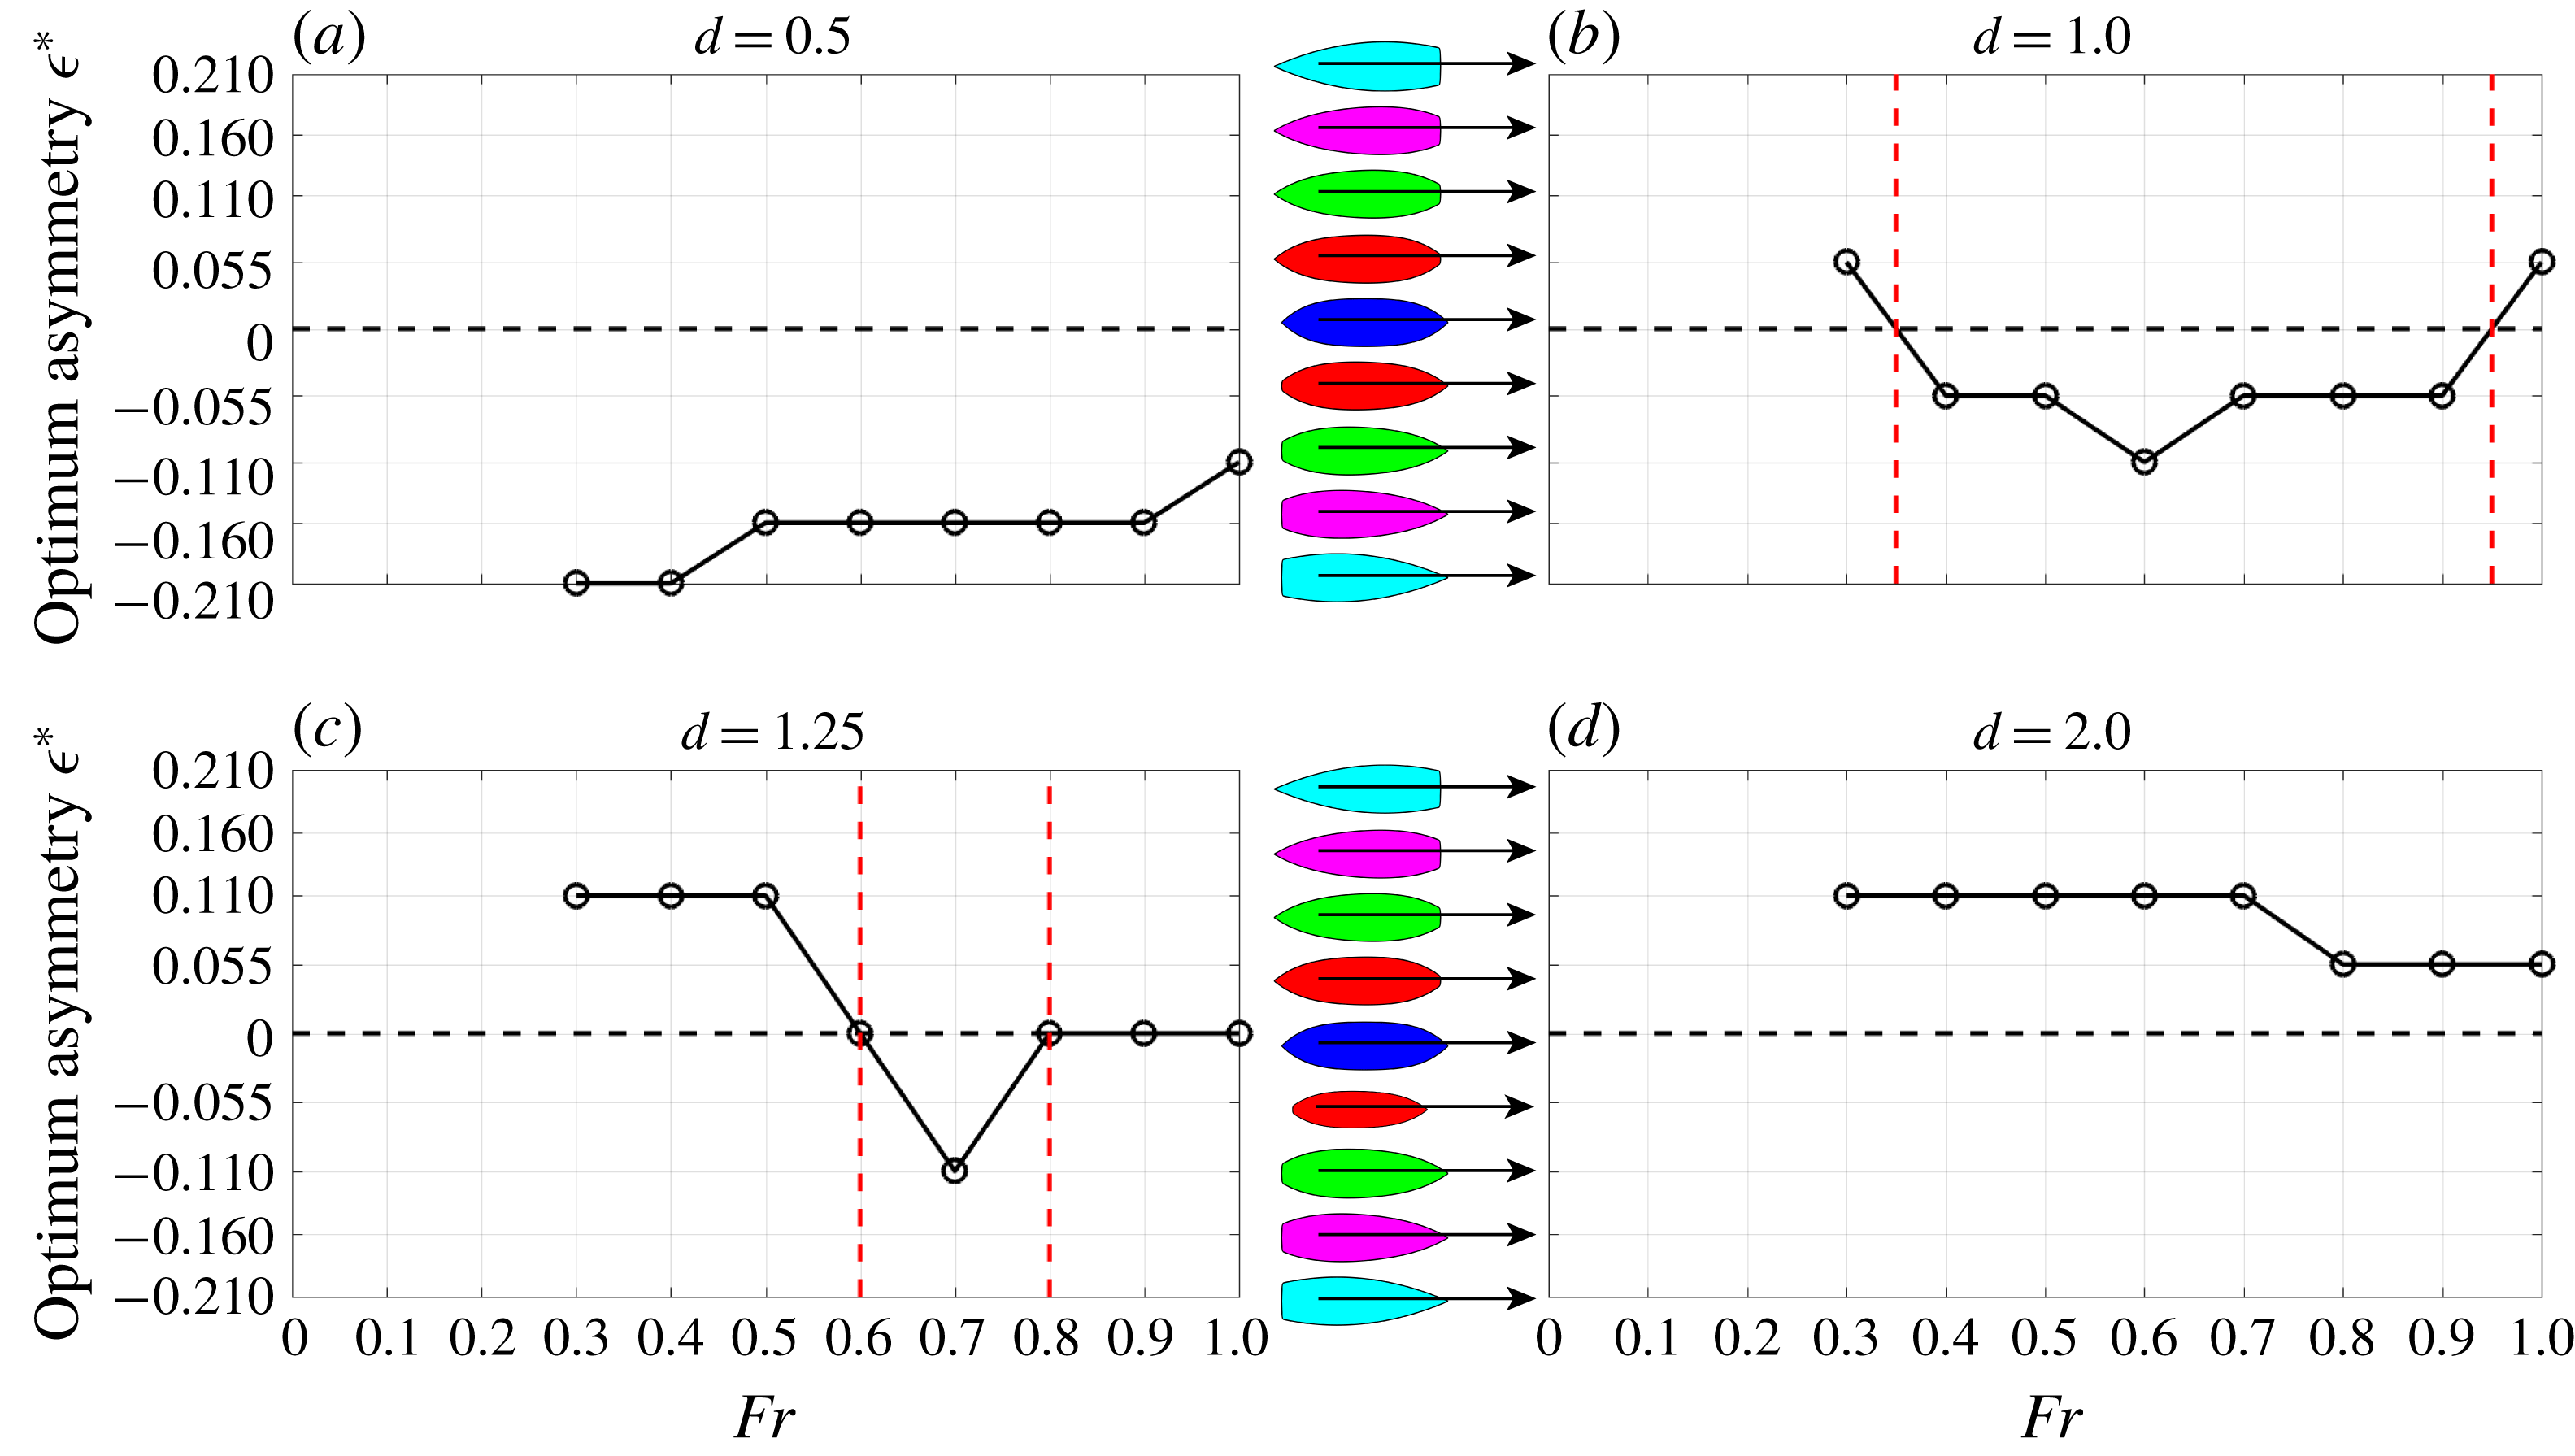
(a–d) Optimal asymmetry
 $\unicode[STIX]{x1D716}^{\ast }$
as a function of Froude number for depths
 $d=0.5,1.0,1.25,2.0$
, using experimental measurements of the bluff family of shapes. At large depths and very small or very large Froude numbers, form drag dominates over wave and skin drag, so that
 $\unicode[STIX]{x1D716}>0$
is optimal. For shallow depths and intermediate Froude numbers, wave drag dominates over form and skin drag, so that
 $\unicode[STIX]{x1D716}<0$
is optimal.

Using the above method, in figure 7 we plot the wave, skin and form drag coefficients for hull
 $5$
from the slender family with both positive and negative asymmetry for
 $Fr\in [0.1,1.0]$
and two different depths
 $d=0.5,2.0$
. When the hull moves close to the interface (
 $d=0.5$
) the wave drag coefficient is larger than the skin and form drag coefficients for Froude numbers in the approximate range
 $Fr\in [0.4,0.9]$
, for both
 $\unicode[STIX]{x1D716}>0$
and
 $\unicode[STIX]{x1D716}<0$
. For Froude numbers outside that range the wave drag coefficient decays and is comparable to the other drag components. Hence, for
 $Fr\in [0.4,0.9]$
we expect a negative
 $\unicode[STIX]{x1D716}$
to be advantageous, whereas for large or small
 $Fr$
, we expect a positive
 $\unicode[STIX]{x1D716}$
to be advantageous.
When the body moves at the larger depth
 $d=2.0$
we can see that the wave drag component is never the largest component, regardless of Froude number. For
 $\unicode[STIX]{x1D716}<0$
form and skin drag are both of the same order of magnitude, but considerably larger than wave drag. This is because, for a body with a bluff trailing edge, boundary layer separation results in significant form drag. However, for
 $\unicode[STIX]{x1D716}>0$
, since the body is more streamlined, form drag is smaller than skin drag. Hence, in this case, the form drag coefficient is smaller than the skin drag coefficient for all Froude numbers. Therefore, at large depths positive
 $\unicode[STIX]{x1D716}$
is advantageous.
The most obvious next question is the following: for a given depth and Froude number, which asymmetry is optimal? To answer this question we turn our attention to the bluff family of shapes. This family is more suitable than the slender family since there is a greater difference in drag coefficient between each hull shape within the family, giving us more granularity.
In figure 8 we plot the optimum asymmetry, which we denote
 $\unicode[STIX]{x1D716}^{\ast }$
, as a function of Froude number and depth, as measured in our experiments. Using five hull shapes from the bluff family, for each of
 $\unicode[STIX]{x1D716}>0$
and
 $\unicode[STIX]{x1D716}<0$
, there are a total of nine possible values of the asymmetry parameter in the range
 $\unicode[STIX]{x1D716}\in [-0.21,0.21]$
. We see that for
 $d=0.5$
the optimum asymmetry is negative for all Froude numbers, whereas for
 $d=2.0$
the optimum asymmetry is positive. However, for intermediate depths
 $d=1.0$
and
 $d=1.25$
, the optimum asymmetry is sometimes positive and sometimes negative, depending on the Froude number range. In the case of
 $d=1.0$
,
 $\unicode[STIX]{x1D716}<0$
is optimum for
 $Fr\in [0.35,0.95]$
, and
 $\unicode[STIX]{x1D716}>0$
is optimum for other
 $Fr$
numbers. For
 $d=1.25$
there is a similar pattern, but the range of Froude numbers is smaller
 $Fr\in [0.6,0.8]$
. These results are qualitatively consistent with those in figure 7, where
 $C_{w}$
dominates for a range of Froude numbers, but only at smaller depths (note, however, that we use a different family of shapes between figures 7 and 8).
6 Conclusions
We have addressed the effect of front–back asymmetry on wave, form and skin drag for bodies moving at or near an interface. We have proposed two sets of body shapes, parameterised by a single quantity
 $\unicode[STIX]{x1D716}$
, which measures the degree of the body asymmetry, and whose sign indicates whether the object has its pointed end at the leading or trailing edge. Using a combination of experimental, numerical and analytical approaches, we have illustrated how asymmetry can be advantageous or disadvantageous, depending on the submerged depth of the body and the Froude number. We have also proposed a simple modification of Michell’s theory which enables the prediction of asymmetry effects using the turbulent boundary layer profile. The boundary layer is symmetry breaking since, for an asymmetric body, it grows differently depending on the direction of motion.
The present work sheds insight on the form of different natural and artificial objects, such as those listed in figure 1. For example, the carp, dolphin and whale all have positive asymmetry because they spend the majority of their time deep beneath the water surface, where wave drag is less important than form drag, and hence require a streamlined shape. The same is true for the NACA airfoil, which does not interact with any interfacial waves. However, kayaks, canoes and sailing boats have negative asymmetry because they move at the interface, where wave drag dominates over form drag, and hence require a shape with a more pointed leading edge that reduces wave disturbance. Waterfowl, such as the duck, move at shallow depths and so appear to have a contradictory value of
 $\unicode[STIX]{x1D716}>0$
. However, this can be explained by the fact that ducks prefer to fly if they desire to move fast.
At much smaller scales, there are some swimming insects that have an asymmetric shape. For example, whirligig beetles, which are known for swimming rapidly in circles at the water surface, are reported to have
 $\unicode[STIX]{x1D716}$
in the range
 $[-0.097,-0.036]$
(Boucher Reference Boucher2018). Since they move at the interface, a negative value of
 $\unicode[STIX]{x1D716}$
is consistent with our findings. However, to study the motion of objects at such small scales, it would be necessary to take capillary effects into account. We leave this for future work, as well as studying the variation of the objects in the vertical dimension.
As another possible direction of future work, particle image velocimetry could be applied to experimentally measure the boundary layer thickness that we use in our modification to Michell’s theory. This would potentially enable more accurate measurement of the turbulent boundary layer thickness than the
 $k$
–
 $\unicode[STIX]{x1D714}$
SST model. As a further step, a formal shape optimisation could be performed, where instead of considering shapes that are defined by a single asymmetry parameter, we would consider all continuous smooth shapes
 $\hat{f}(\hat{x})\in C^{\infty }[-1/2,1/2]$
. The optimisation would require a model which has good capabilities in predicting each of the three drag coefficients,
 $C_{w}$
,
 $C_{f}$
and
 $C_{s}$
, especially when it comes to asymmetry effects. Here, we have presented a simple modification to Michell’s theory for the wave drag
 $C_{w}$
that captures such effects, given knowledge of the boundary layer thickness. This simple modification is computationally inexpensive, which would make it ideal for optimisation. Therefore, a reliable and computationally inexpensive model for the boundary layer (and hence
 $C_{f}$
,
 $C_{s}$
) would complement our modification, and allow for such an optimisation of the hull shape.
In addition, we note that throughout this study we have assumed that there is no influence on the wave resistance from the velocity distribution in the boundary layer and in the wake. In fact, the effect of shear stress in these regions could alter the dispersion relation of the waves, and hence the wave drag (as is shown by Benzaquen & Raphael (Reference Benzaquen and Raphael2012) in the case of vertical shear). Furthermore, our modification to Michell’s theory could be extended to include the wake region as part of the effective hull shape, as we have done here for the boundary layer.
Acknowledgements
We thank V. Zhukovskaya and B. Garitaine for their contributions to the experiments conducted in this study. We also thank R. Cuzon for useful discussions. We acknowledge the support from Ecole Polytechnique for the research programme Sciences 2024.
Appendix A. Mathematical expressions for the hull shapes
For the sake of reproducibility, in this section we give the expressions for the functions
 $\hat{f}(\hat{x})$
that we used for the slender and bluff families of shapes throughout the main text. In non-dimensional form, the slender family of shapes is given by
 $$\begin{eqnarray}\hat{f}(\hat{x})=c_{1}\log \left(\frac{1+c_{2}}{\text{e}^{c_{3}(\hat{x}-1/2)}+c_{2}\text{e}^{-c_{3}c_{4}(\hat{x}-1/2)}}\right),\end{eqnarray}$$
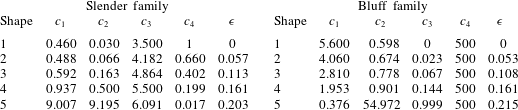
where the coefficients
 $c_{1},c_{2},c_{3},c_{4}$
, for the five different shapes are listed in table 1. The bluff family of shapes is given by
 $$\begin{eqnarray}\hat{f}(\hat{x})=c_{1}(c_{3}(1/2+\hat{x})(1-\text{e}^{-c_{4}(1/2-\hat{x})})+(1-c_{3})(1/4-\hat{x}^{2})(\hat{x}^{2}+c_{2}^{2})),\end{eqnarray}$$
and the corresponding coefficient values are listed in table 1. The coefficients are chosen so that each of the shapes
 $\hat{f}(\hat{x})$
within the family have the following properties:
 $\hat{f}(\pm 1/2)=0$
;
 $\max \{\,\hat{f}(\hat{x})\}=1/2$
, and
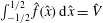 $\int _{-1/2}^{1/2}\hat{f}(\hat{x})\,\text{d}\hat{x}=\hat{V}$
, where the non-dimensional volume is
 $\hat{V}=0.31$
for the slender family and
 $\hat{V}=0.38$
for the bluff family. The corresponding values of the asymmetry parameter
 $\unicode[STIX]{x1D716}$
are also listed in table 1 for each shape.


Appendix B. Additional drag calculations
In this section we display additional drag coefficients measured either using the tow-tank experiment, or the
 $k$
–
 $\unicode[STIX]{x1D714}$
SST model, as described in the main text.
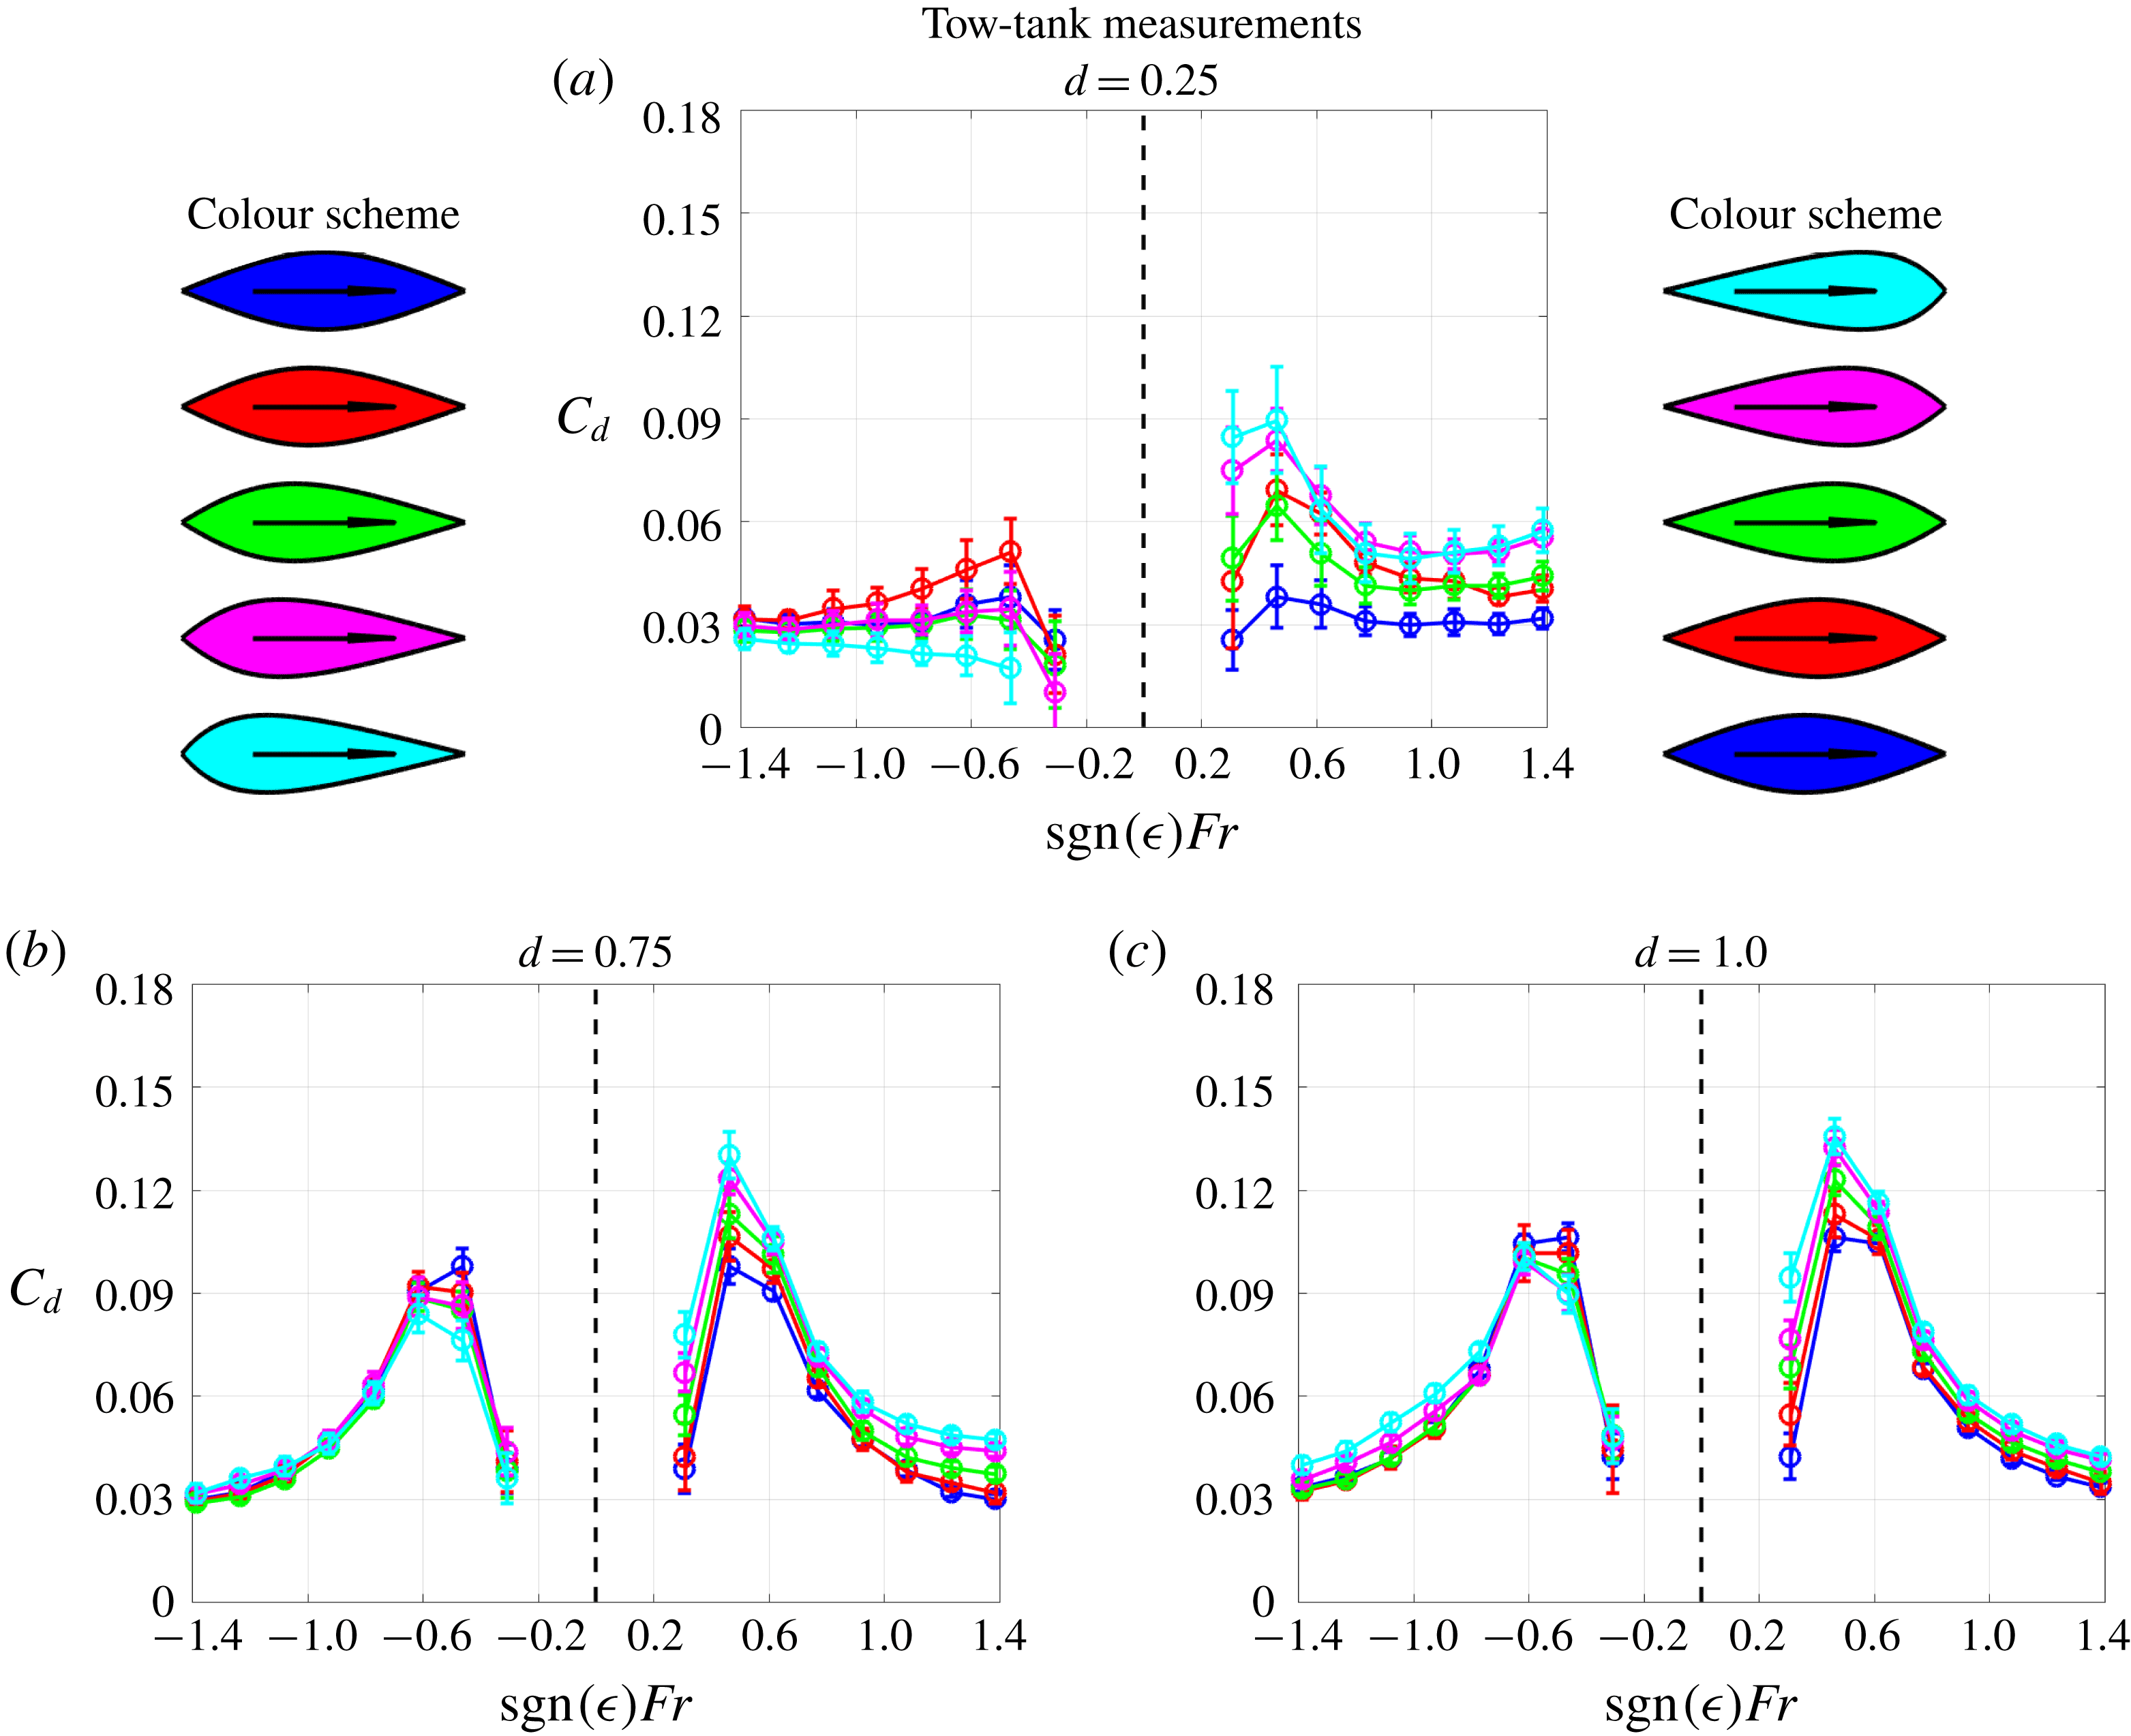
Additional tow-tank measurements of the drag coefficient
 $C_{d}$
for the slender family of shapes at various different depths.

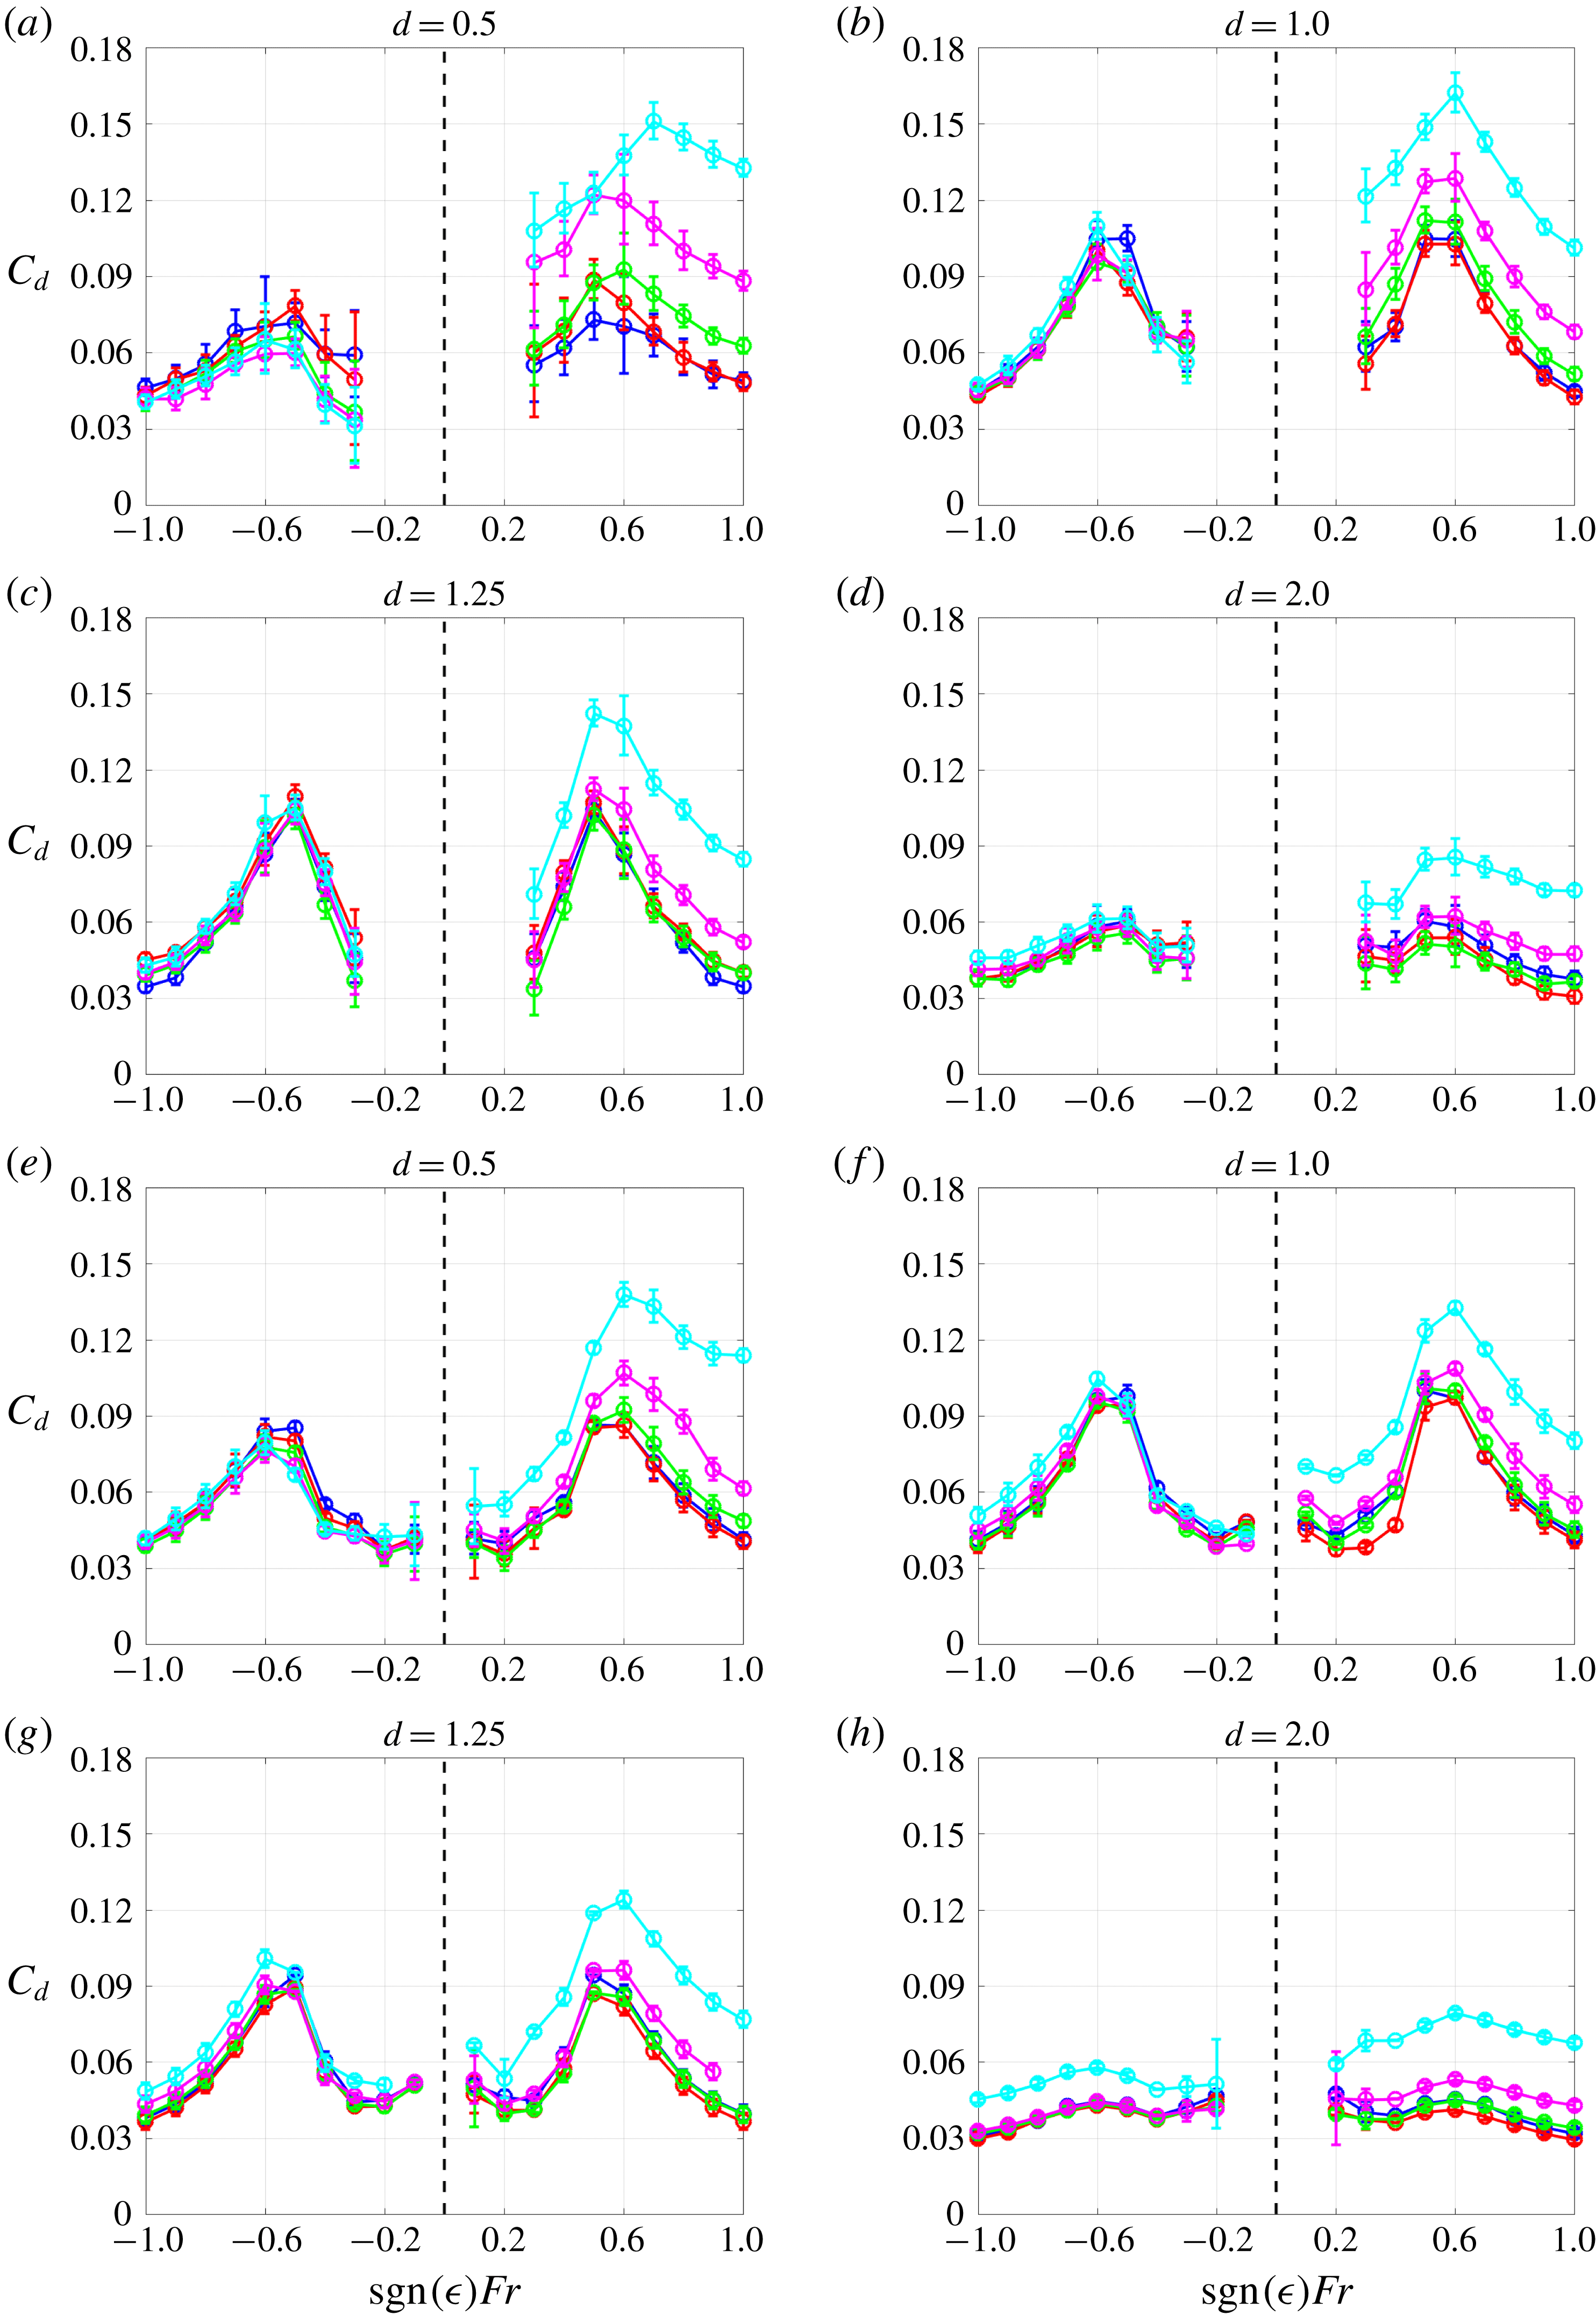
(a–d) Additional tow-tank measurements of the drag coefficient
 $C_{d}$
for the bluff family of shapes at various different depths. (e–h) Corresponding calculations of
 $C_{d}$
using the
 $k$
–
 $\unicode[STIX]{x1D714}$
SST model.

Earlier, in figure 4(a), we displayed experimental drag coefficient measurements for depth
 $d=0.5$
for the hulls from the slender family. Similarly, here in figure 9 we display measurements for depths
 $d=0.25,0.75,1.0$
and for Froude numbers in the range
 $Fr\in [-1.5,1.5]$
. In figure 10(a–d) we also display experimental measurements for the bluff family of shapes at depths
 $d=0.5,1.0,1.25,2.0$
, and for Froude numbers in the range
 $Fr\in [-1,1]$
. The corresponding
 $k$
–
 $\unicode[STIX]{x1D714}$
SST calculations of the drag coefficient for the bluff family of shapes are in figure 10(e–h).
Appendix C. Numerical fitting of the turbulent boundary layer
In this section we briefly describe the optimisation procedure followed to generate the fitted boundary layer profiles in figure 6(a), and the corresponding drag curves in (d). As explained in § 3, drag measurements have been taken, both using a tow-tank experiment, and in a wind tunnel. In this way, it is possible to isolate the measured wave drag coefficient for a given hull shape
 $\hat{f}(\hat{x})$
, at a given value of the Froude number
 $Fr$
, and the depth of motion
 $d$
. Let us denote the wave drag coefficient derived from this procedure as
 $C_{w}^{\ast }(\,\hat{f}(\hat{x}),Fr,d)$
.
Now, consider the wave drag coefficient calculated using our modification to Michell’s theory (4.7). This theoretical prediction is calculated for a given boundary layer profile
 $\hat{\unicode[STIX]{x1D6FF}}_{0.99}(\hat{x})$
and a given hull shape
 $\hat{f}(\hat{x})$
. Hence, we denote the theoretical prediction from (4.7) as
 $\tilde{C}_{w}(\hat{\unicode[STIX]{x1D6FF}}_{0.99}(\hat{x}),\hat{f}(\hat{x}),Fr,d)$
. In the following numerical fitting procedure, we seek to find the boundary layer profile
 $\hat{\unicode[STIX]{x1D6FF}}_{0.99}(\hat{x})$
that, when inserted into (4.7), gives the closest fit possible to the experimentally derived values
 $C_{w}^{\ast }(\,\hat{f}(\hat{x}),Fr,d)$
.
To perform the fit, we use a least-squares minimisation approach. We run the optimisation for each hull shape
 $\hat{f}(\hat{x})$
separately. Therefore, for each
 $\hat{f}(\hat{x})$
we set the objective function as
 $$\begin{eqnarray}J(\hat{\unicode[STIX]{x1D6FF}}_{0.99}(\hat{x})):=\mathop{\sum }_{d\in X_{d}}\mathop{\sum }_{Fr\in X_{Fr}}(\tilde{C}_{w}(\hat{\unicode[STIX]{x1D6FF}}_{0.99}(\hat{x}),\hat{f}(\hat{x}),Fr,d)-C_{w}^{\ast }(\,\hat{f}(\hat{x}),Fr,d))^{2},\end{eqnarray}$$
where
 $X_{Fr}=\{Fr_{1},Fr_{2},\ldots ,Fr_{n}\}$
and
 $X_{d}=\{d_{1},d_{2},\ldots ,d_{n}\}$
denote the set of experimental measurements.
To be physically realistic, we place some constraints on the control function
 $\hat{\unicode[STIX]{x1D6FF}}_{0.99}(\hat{x})\in C^{\infty }[-1/2,1/2]$
. Firstly, we require that the boundary layer begins growing at the leading edge of the body, such that
 $$\begin{eqnarray}\hat{\unicode[STIX]{x1D6FF}}_{0.99}(-1/2)=0.\end{eqnarray}$$
Secondly, we require a non-shrinking boundary layer, such that
 $$\begin{eqnarray}\hat{\unicode[STIX]{x1D6FF}}_{0.99}^{\prime }(\hat{x})\geqslant 0.\end{eqnarray}$$
Finally, to regularise the optimisation and ensure that the boundary layer profile remains sufficiently smooth, we add a term to the objective function (C 1) that penalises large boundary layer growth rates. Hence, we replace (C 1) with
 $$\begin{eqnarray}{\mathcal{J}}(\hat{\unicode[STIX]{x1D6FF}}_{0.99}(\hat{x})):=J(\hat{\unicode[STIX]{x1D6FF}}_{0.99}(\hat{x}))+\unicode[STIX]{x1D707}\int _{-1/2}^{1/2}\hat{\unicode[STIX]{x1D6FF}}_{0.99}^{\prime }(\hat{x})^{2}\,\text{d}\hat{x}.\end{eqnarray}$$
The penalty parameter
 $\unicode[STIX]{x1D707}$
is chosen to be sufficiently large that regularity is achieved, whilst not being too large that the solution is dramatically affected. For all of the hulls in this study, we have performed a sensitivity analysis on
 $\unicode[STIX]{x1D707}$
to confirm the stability of the fitted boundary layer profile.
To summarise, the optimisation problem consists of minimising the penalised least-squares residual (C 4), subject to the constraints (C 2) and (C 3). We solve this numerically, following the same procedure as Benham et al. (Reference Benham, Hewitt, Please and Bird2018). This involves discretising the boundary layer shape
 $\hat{\unicode[STIX]{x1D6FF}}_{0.99}(\hat{x})$
and treating each of the discretised values as a decision variable. We use the interior point method, with the IpOpt implementation (Nocedal & Wright Reference Nocedal and Wright2006; Wächter & Biegler Reference Wächter and Biegler2006). Gradients are calculated using automatic differentiation in the JuMP package (Dunning, Huchette & Lubin Reference Dunning, Huchette and Lubin2017) of the Julia programming language (Bezanson et al.
Reference Bezanson, Edelman, Karpinski and Shah2017).
The resulting fitted boundary layer profiles are plotted in figure 6(a) for each hull shape. Then, we insert the boundary layer profiles into (4.7) for Froude numbers in the range
 $Fr\in [0.3,1.0]$
and at depth
 $d=0.5$
to calculate the wave drag coefficient
 $\tilde{C}_{w}$
. These calculations are then added to the wind tunnel measurements
 $C_{f}+C_{s}$
from figure 4(b), to produce the total drag coefficient curves
 $C_{d}$
in figure 6(d).