Introduction
Tomato comprises a significant proportion of Florida agricultural production with 10,927 ha of harvested land and an economic value of approximately $336 million. Pepper production is another important industry with 4,816 ha of harvested land and the economic value of approximately $180 million (USDA–NASS 2018).
Crop termination with herbicides such as glyphosate and paraquat is an important production practice in Florida tomato and pepper fields. Crop termination at the end of the harvest helps facilitate plastic removal and kills any weeds still present. However, POST herbicides do not control weed seeds, nematodes, and soil-borne pathogens. Crop termination with metam potassium (metam-K) is an alternative option that provides broad spectrum control of soil-borne pests in addition to crop kill (Noling Reference Noling2006; Radewald et al. Reference Radewald, Ferrin and Stanghellini2004). However, crop termination with fumigants requires a plant-back interval of approximately 3 to 4 wk to allow for all gases to dissipate from the soil bed if growers plan to reuse the plastic-covered beds (Desaeger et al. Reference Desaeger, Seebold and Csinos2008). Fumigants are also more expensive than herbicides.
Purple nutsedge is one of the most troublesome weeds in strawberry fields in Florida because of its unique ability to puncture the plastic mulch and its prolific reproductive capacity. They form tubers that produce multiple shoots and additional tubers (Riemens et al. Reference Riemens, Weide and Runia2008). Dogfennel and goosegrass are important broadleaf and grassy weeds, respectively, in Florida that emerge from the planting holes and other rips and tears in the plastic and in the row middle. Dogfennel is a perennial species and the mature plant is often woody, 2 to 3 m tall and 1 to 3 cm in diameter (Stucky Reference Stucky1984). It is a common weed in strawberry field appearing at season end that interferes with crop harvest and plastic removal. Dogfennel emerges early in the season, grows tall very quickly, and its high seed production capacity makes it one of top 10 troublesome and common weeds in Florida (Macdonald et al. Reference Macdonald, Brecke and Shilling1992; Webster Reference Webster2011). Goosegrass is an annual weed that produces approximately 50,000 seed with high (>90%) viability. It grows rapidly forming dense plants that make it very difficult to remove plastic (Chauhan and Johnson Reference Chauhan and Johnson2008). It has also developed resistance to paraquat, the predominant herbicide used for crop termination (Owen and Zelaya Reference Owen and Zelaya2005).
Metam-K is commonly used for crop termination in Florida strawberry fields (Noling Reference Noling2006). It releases isothiocyanate in the soil, which has moderate fungicidal and nematicidal properties and strong herbicidal properties (Baggio et al. Reference Baggio, Chamorro, Cordova, Noling, Vallad and Peres2018; Li et al. Reference Li, Barry, Mongar and Wofford2006; Santos Reference Santos2009). Injection of metam-K through the drip irrigation system for the purpose of crop termination reduces worker exposure to pesticides and also allows flexibility in application schedule (Ajwa et al. Reference Ajwa, Trout, Mueller, Wilhelm, Nelson, Soppe and Shatley2002). However, the optimal rate needed for tomato and pepper crop termination, and the control of specific weeds, have not been accurately determined. Therefore, the objective of this study was to determine the rate of metam-K required for effective termination of growing tomato and pepper plants, purple nutsedge, dogfennel, and goosegrass when injected through drip tape.
Materials and Methods
Plastic-mulched (Virtually Impermeable Film, BlockadeTM, Berry Plastics, Evansville, IN) tomato and pepper beds located at the University of Florida–Gulf Coast Research and Education Center (GCREC), Wimauma, Florida (27.76°N, 82.23°W), were used for the field experiments. The soil type at the GCREC is a Myakka fine sand (silliceous hypothermic oxyaquic Alorthod) with a slightly acidic pH of 6.5–6.8 and low organic matter content of 0.9% to 1.2%.
Tomato Field Trial
Field experiments were conducted separately in December 2017 and 2018. Tomato planting dates were August 24, 2017, and August 15, 2018. Tomato plants, ‘HM1823’, were planted in the center of the bed with 60-cm spacing between plants in both experiments. Tomato beds were highly infested with purple nutsedge with an approximate plant density of 215 m−2.
Tomato bed dimension was 1.5 m center-to-center spacing, 0.9 m wide at the top, and 0.3 m tall. Beds were covered with 0.03-mm-thick virtually impermeable film (Blockade™) with two rows of drip tape (Chapin drip tape - BTF, Jain Irrigation Inc, Fresno, CA) placed 2.5 cm beneath the soil surface. Flow rate for the drip tape was 0.95 L min−1 per 30.5 m, with an emitter spacing of 30 cm. The plot size for the experiment was a 7.6-m-long single raised bed. The experimental design was a randomized complete block design (RCBD) where treatments were randomized within block with four replications.
Different rates of metam-K (K-PAM® HL™, potassium N-methyldithiocarbamate 54%, sg – 1.27 g cc−1 AMVAC, Newport Beach, CA) were injected through a drip tape irrigation system on December 20, 2017, and December 10, 2018. Application rates were 0, 65, 130, 195, 260, and 325 kg a.i. ha−1 (kg ha−1). Fumigant rates were mixed with 3.8 L of water, and the mixture was injected into plots for approximately 15 min with a customized manifold using carbon dioxide as a propellant. Water was run for 2 h following injection to distribute the metam-K with a total water volume of 54 m3 ha−1.
Plant injury was determined on percentage scale ranging from 0% (no damage) to 100% (complete desiccation) at 7 and 14 d after fumigation (DAF) for tomato and purple nutsedge. Purple nutsedge injury ratings were recorded in two different locations on the bed top including bed center area (17 cm toward the edge from the center on both sides) and bed edge area (18 cm area away from bed edge toward center on both sides).
Pepper Field Trial
Two separate field experiments were conducted for pepper in May 2017 and May 2018. Fields were relay cropped with pepper after strawberry, after strawberries had been terminated by hand pulling and pepper plants were grown on strawberry beds. Pepper seedlings, ‘Tormenta’, were planted in a single row along the bed center with 30 cm plant-to-plant spacing on February 12, 2017, and on February 15, 2018.
Fields were highly infested with purple nutsedge, goosegrass, and dogfennel. Purple nutsedge was distributed across the plastic mulch at a plant density of 180 m−2, whereas goosegrass and dogfennel were growing from the planting holes. Beds were 91 m long; spaced at 1.2 m center to center, 0.6 m wide at the top, and 0.3 m tall. The linear length of the plot size was a 22.8-m single raised bed. Beds were covered with 0.03-mm-thick VIF with single drip tape 2.5 cm deep at the center of the bed. The experimental design was identical to the tomato field trial.
Metam-K rates used for the experiment were 0, 46, 91, 137, and 182 kg ha−1. Fumigation occurred on May 20, 2017, and May 29, 2018. These rates were lower than the rates tested for tomato because complete crop injury was observed with most of the rates tested for the tomato trial. Data collection and metam-K injection techniques were exactly the same as those of the tomato trial but additional data on goosegrass and dogfennel were also collected.
Data were analyzed using the PROC GLIMMIX procedure in SAS version 9.2 (SAS Institute Inc., Cary, NC) to observe interaction between treatments and experimental repeats. Experimental data from the two experimental repeats were combined for the regression analysis after confirming no significant interaction effect (P > 0.05). Percentage control of each rate for each pest was regressed nonlinearly using the following exponential rise growth equation: y = a {1 − [e^(−bx)]}, with two parameters (Yu and Boyd Reference Yu and Boyd2018), where y is the response variable, a is the asymptote, b is the slope estimate, and x is fumigant (metam-K) application rate. Sigma plot version 14.0 (Systat Software Inc., San Jose, CA) was used to create the dose response curve and determine values of parameters in the equation. ER50 and ER90 values (i.e., the effective rate required to cause 50% and 90% injury ratings, respectively, were calculated with a 90% confidence interval by inserting parameter values in the equation.
Results and Discussion
Tomato Field Trial
Tomato and Purple Nutsedge Injury
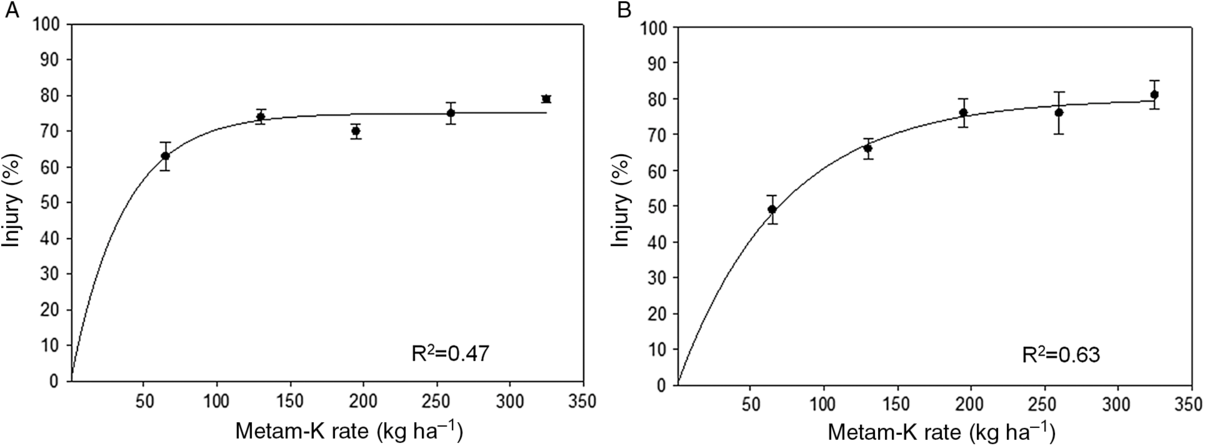
Rates tested in this experiment provided >75% tomato injury at 7 DAF with an ER50 value of 32 kg ha−1 (Table 1, Figure 1). All rates resulted in ≥90% tomato injury at 14 DAF (data not shown).
Estimates from regression analysis a for 50% (ER50) and 90% (ER90) tomato and purple nutsedge injury in tomato termination experiments.

a Data were regressed with the equation y = a {1 − [e^(−bx)]}, where y is response variable, a is the asymptote, b is the slope estimate, and x is fumigant rate.
b Data collected after 7 d of fumigation.
c Data collected after 14 d of fumigation.
d Confidence interval estimates.
e Abbreviations: LL, lower limit; UL, upper limit.
Tomato (A) and purple nutsedge in the bed center (B) injury at 7 d after drip injection of metam potassium. Data points are mean percentage injury for each treatment and error bar represents variation between replications. Regression lines are based on exponential rise growth equation model, y = a {1 − [e^(−bx)]}, where y is the response variable, a is the asymptote, b is the slope estimate, and x is fumigant (metam-K) application rate.

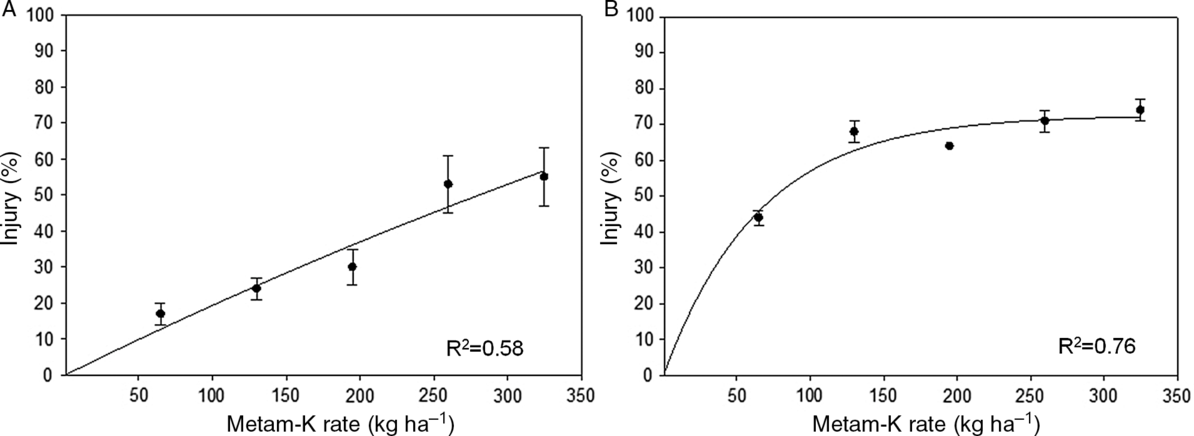
Purple nutsedge at the bed center displayed >60% injury with all rates at 7 DAF and 100% mortality except at 65 kg ha−1 with 83% injury at 14 DAF. ER50 and ER90 values for purple nutsedge injury at bed center were 55 and 251 kg ha−1, respectively, at 7 DAF (Table 1, Figure 1). Comparatively, purple nutsedge at the bed edge had less injury, ranging from 15% to 80% at 7 DAF, and 48% to 89% at 14 DAF. Values for ER50 and ER90 were 229 and 502 kg ha−1, respectively, at 7 DAF. ER90 at 14 DAF was not calculatable because 90% injury was never attained, whereas ER50 decreased to 60 kg ha−1 (Table 1, Figure 2). This can be explained by a finding reported by Candole et al. (Reference Candole, Csinos and Wang2007) who observed the highest fumigant concentration 20 cm below the centrally located drip tape emitter with the lowest concentration 30 cm away from the emitter when metam-Na was drip injected. The value of concentration × time (CT) was 0.84 μg h cm−3 after 20 d of fumigation 30 cm away from the emitter, whereas the corresponding value was 63.42 μg h cm−3 for 20 cm below the emitter when metam-Na was applied at 295 L ha−1. There was no recovery of injured purple nutsedge plant across the bed; however, new purple nutsedge shoots were observed after 14 DAF. This indicates that underground tubers of purple nutsedge require higher metam-K application rate for effective control than aboveground purple nutsedge foliage.
Purple nutsedge injury on the bed edge at 7 (A) and 14 (B) d after drip injection of metam potassium. Data points are mean percentage injury for each treatment and error bar represents variation between replications. Regression lines are based on exponential rise growth equation model, y = a {1 − [e^(−bx)]}, where y is the response variable, a is the asymptote, b is the slope estimate, and x is fumigant (metam-K) application rate.

Our results suggest that metam-K rates far below the maximum label rate (65 kg ha−1 for 90% kill) are needed for tomato termination. The lower rate would significantly reduce production costs for growers. For example, application of metam-K at the label rate of 195 kg ha−1 costs $929 ha−1, but the rate needed for tomato crop termination is significantly lower at $310 ha−1.This cost is still higher than crop-burn herbicides such as glyphosate, which can cost as low as $16 ha−1 (Boyd et al. Reference Boyd, Vallad, Wu, Noling and Guan2017). Growers can utilize herbicides for crop terminations if there are not issues associated with soil-borne pest and pathogens. However, use of metam-K rate as a crop termination tool can also provide control for troublesome pests such as charcoal rot (Macrophomina phaseolina) and root knot nematode (Meloidogyne incognita), especially when a second planting is planned for the same bed (Chamorro et al. Reference Chamorro, Seijo, Noling, Santos and Peres2016; Desaeger et al. Reference Desaeger, Dickson and Locascio2017). A higher metam-K rate (>325 kg ha−1 90% kill) would be required if adequate control of purple nutsedge is desired on the entire soil bed.
Pepper Field Trial
Pepper and Purple Nutsedge Injury
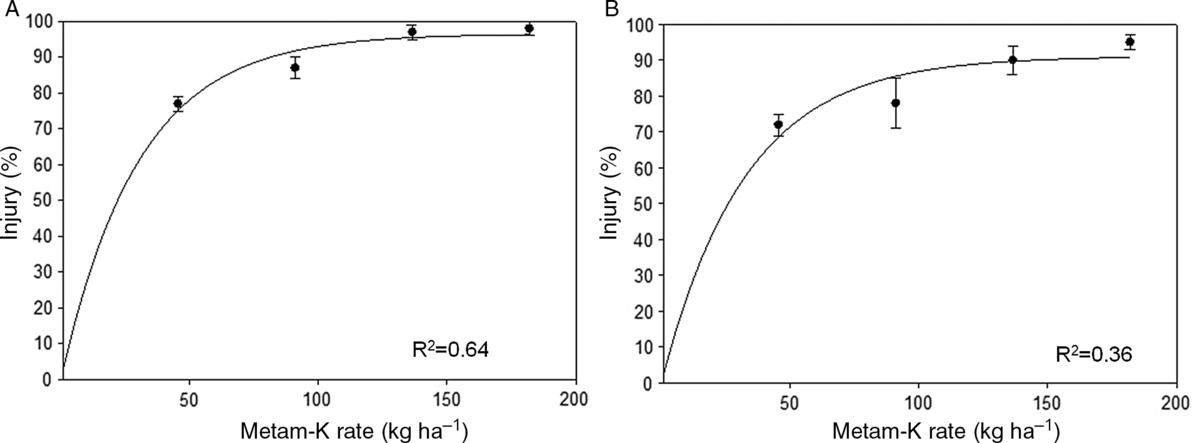
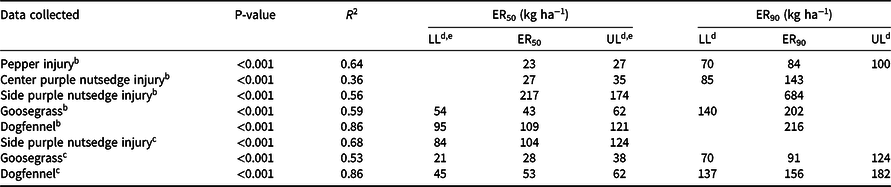
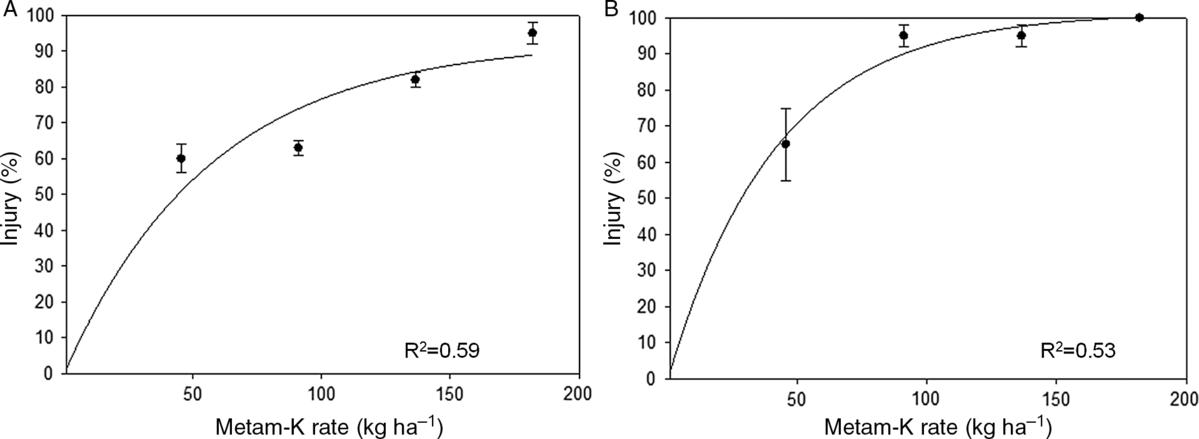
Rates tested in this experiment provided >75% pepper injury at 7 DAF (Figure 3), whereas all rates resulted in >97% crop injury except the lowest rate of 46 kg ha−1, which caused 88% pepper injury at 14 DAF (data not shown). ER50 and ER90 values for pepper injury were 23 and 83 kg ha−1, respectively, at 7 DAF (Table 2). The effectiveness of metam-K against tomato and pepper plants was comparatively similar even though the experiements were conducted separately and the number of drip tapes per bed and crop canopy size was different.
Pepper (A) and purple nutsedge in the bed center (B) injury at 7 d after drip injection of metam potassium. Data points are mean percentage injury for each treatment and error bar represents variation between replications. Regression lines are based on exponential rise growth equation model, y = a {1 − [e^(−bx)]}, where y is the response variable, a is the asymptote, b is the slope estimate, and x is fumigant (metam-K) application rate.

Estimates from regression analysis a for 50% (ER50) and 90% (ER90) the injury of pepper, purple nutsedge, goosegrass, and dogfennel in pepper termination experiments.

a Data were regressed with the equation y = a {1 − [e^(−bx)]}, where y is response variable, a is the asymptote, b is the slope estimate, and x is fumigant rate.
b Data collected after 7 d of fumigation.
c Data collected after 14 d of fumigation.
d Confidence interval estimates.
e Abbreviations: LL, lower limit; UL, upper limit.
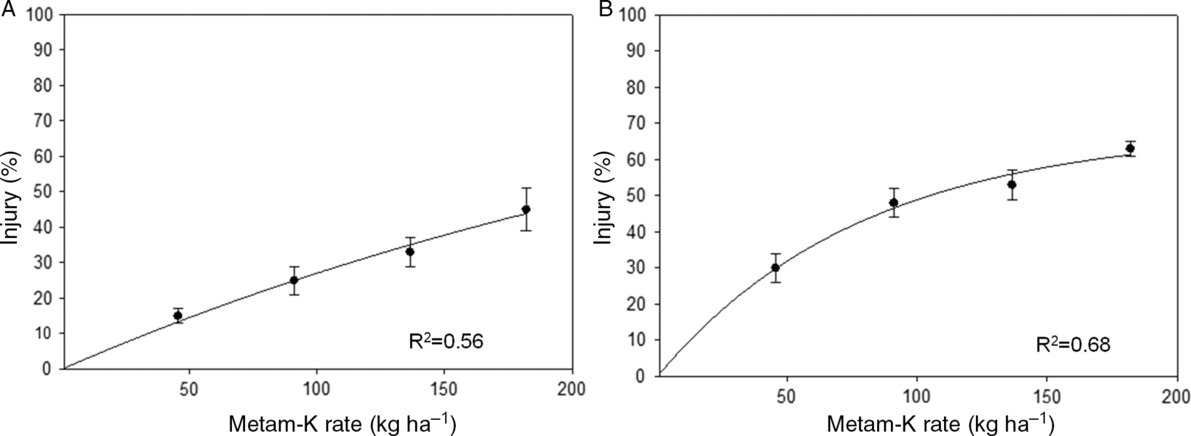
Purple nutsedge injury at the bed center ranged from 60% to 95% with the increase in rates from 46 to 182 kg ha−1 of metam-K at 7 DAF (Figure 3); however, injury was >85% for all rates after 14 DAF (data not shown). ER50 and ER90 values for purple nutsedge at the bed center were 27 and 143 kg ha−1, respectively, at 7 DAF (Table 2). In comparison, purple nutsedge emerging on the bed edge was poorly controlled by metam-K and damage ranged from 15% to 45% control at 7 DAF, and 30% to 63% control at 14 DAF (Figure 4). The ER50 value at the bed edge was 217 kg ha−1 and the ER90 value was 684 kg ha−1 at 7 DAF; at 14 DAF, the ER50 value was 104 kg ha−1 (Table 2). ER90 was not calculatable because it did not reach 90% control with any of the application rates. ER values for bed-edge control of purple nutsedge in pepper fields were higher than those in the tomato trial. This could have resulted from extensive foliage and root system of purple nutsedge occurring over 6 to 8 mo and use of single drip tape per bed.
Purple nutsedge injury on the bed edge at 7 (A) and 14 (B) d after drip injection of metam potassium. Data points are mean percentage injury for each treatment and error bar represents variation between replications. Regression lines are based on exponential rise growth equation model, y = a {1 − [e^(−bx)]}, where y is the response variable, a is the asymptote, b is the slope estimate, and x is fumigant (metam-K) application rate.

Goosegrass and Dogfennel Injury
Goosegrass injury ranged from 60% to 95% at 7 DAF, when the ER50 value was 44 kg ha−1 and the ER90 value was 202 kg ha−1 at 7 DAF. Injury ranged from 43% to 94% at 14 DAF with an ER50 value of 28 kg ha−1 and an ER90 value of 91 kg ha−1 at 14 DAF (Table 2, Figure 5). Application rates needed to terminate goosegrass that emerged in the planting holes were higher than those needed to terminate purple nutsedge and pepper plants at bed center but they were comparable to that needed to terminate purple nutsedge at the bed edge. This could be because of vigorous and tall vegetative growth (up to 90 cm) by goosegrass that occurred over the 6- to 8-mo time period of double cropping (Yu et al. Reference Yu, Boyd and Guan2018) and reduced the movement of metam-K from centrally located drip tape toward the planting hole area.
Goosegrass injury at 7 (A) and 14 (B) d after drip injection of metam potassium. Data points are mean percentage injury for each treatment and error bar represents variation between replications. Regression lines are based on exponential rise growth equation model, y = a {1 − [e^(−bx)]}, where y is the response variable, a is the asymptote, b is the slope estimate, and x is fumigant (metam-K) application rate.

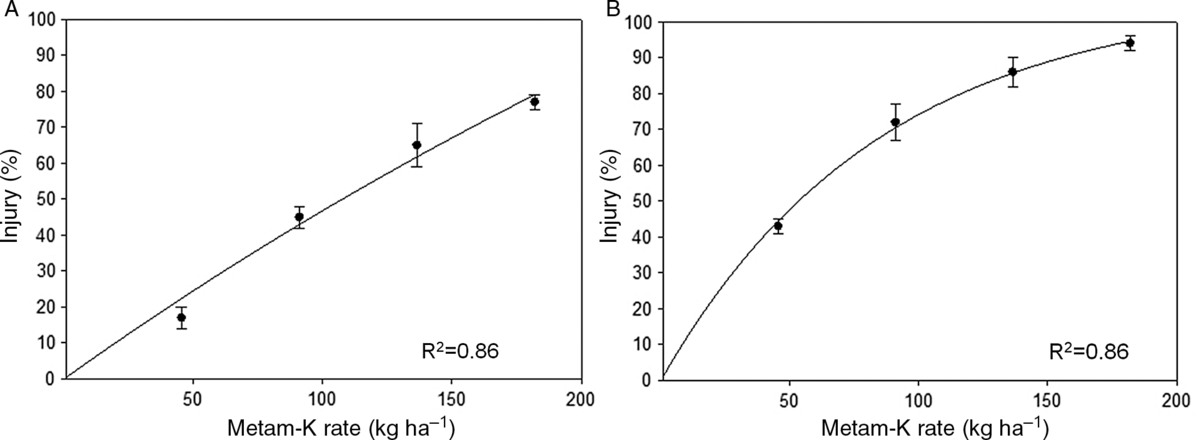
Dogfennel was not adequately controlled, and injury ranged from 17% to 77% with an ER50 value of 109 kg ha−1 and an ER90 value of 216 kg ha−1 at 7 DAF. The range of injury increased to 43% to 94% at 14 DAF, when ER50 was 54 kg ha−1 and ER90 was 156 kg ha−1 (Table 2, Figure 6). These high ER values might have resulted from the woody nature and tall growth habit of dogfennel that occurs in Florida in early summer. Sellers et al. (Reference Sellers, Ferrell, MacDonald and Kline2009) observed inconsistent control of dogfennel with herbicides especially when it is tall (>36 cm) by May or June than in early growth stages in Florida.
Dogfennel injury at 7 (A) and 14 (B) d after drip injection of metam potassium. Data points are mean percentage injury for each treatment and error bar represents variation between replications. Regression lines are based on exponential rise growth equation model, y = a {1 − [e^(−bx)]}, where y is the response variable, a is the asymptote, b is the slope estimate, and x is fumigant (metam-K) application rate.

Overall, our results contradict the general belief that metam-K cannot move across the entire soil bed. Previous research established that even at extremely high-water volumes metam-K is not carried to the edge of the bed due to the sandy nature of the soils in Florida (Noling Reference Noling2014). However, this does not take into account the movement of the fumigant once it enters the gaseous phase. We conclude that metam-K movement increases at higher application rates, and that even weeds located at the bed edge can be controlled at high rates. Higher metam-K rates also result in quicker crop termination and weed control compared with lower rates. It seems that a lower rate of metam-K (~100 kg ha−1) is adequate to kill pepper, tomato, goosegrass, and purple nutsedge located at the center of bed near drip tape. A higher rate (~200 kg ha−1) is required to control dogfennel that has matured over a period of double cropping as well as purple nutsedge that has grown at the bedside. Poor termination of purple nutsedge at the bed edge occurs because of the limited ability of metam-K to move in soil due to its low vapor pressure. Additionally, a high application rate results in a higher concentration of metam-K in a given water volume (Candole et al. Reference Candole, Csinos and Wang2007), which appears to result in better movement of the fumigant from the point of injection followed by increased distribution in the gaseous phase.
Acknowledgments
This research was funded by AMVAC Chemical and Strawberry Grower Association. We thank Michael Sweat for technical assistance. No conflicts of interest have been declared.