


1. Introduction
The study of the relationship between language and space is one of the core interests in sociolinguistic research. Some researchers in this field have focused not on production-based regional language variation but, rather, have adopted a perception-oriented approach. Using this approach, they have targeted the perceptions that nonspecialists (the “folk”) have toward linguistic variation and its spatial distribution in their own language variety (e.g., Preston, Reference Preston1989, Reference Preston1993, Reference Preston and Schneider1996). This approach to perceived linguistic variation is called perceptual dialectology; it helps in identifying the extent to which and places at which dialect areas are mapped in speakers’ minds, which linguistic variants are socially salient to the speakers, and what social meanings and sociocultural associations speakers attach to those variants. All of these aspects of perceptual information can serve as a helpful corollary to the description and analysis of the actual linguistic patterns in a variety (Evans, Reference Evans2013).
Compared with previous studies of English and other Western languages, the field of Arabic sociolinguistics is lagging behind in some respects (Horesh & Cotter, Reference Horesh and Cotter2016), including in the area of perceptual dialectology. As a language that has a diverse and complex set of dialects (Haeri, Reference Haeri2000), Arabic presents an ideal opportunity to explore regional language variation from a perceptual point of view. This is more evident in a country like Saudi Arabia, which can be considered the cradle of old Arabic dialects; it has an abundance of linguistic variation, on many levels, which has not been studied so far. The present study therefore attempts to investigate nonlinguists’ perceptions about linguistic variation among speakers of Qassimi Arabic (hereafter QA), examining not only their mental maps of variation but also the labels they attach to distinguish different varieties of QA and their social evaluations of those dialects.
2. Perceptual dialectology
As a subfield of sociolinguistics (Preston, Reference Preston1989), perceptual dialectology (henceforth PD) explores the language attitudes and social ideologies that nonlinguists hold about linguistic variation and its spatial distribution in a country or a particular geographic region. PD provides a set of methods and techniques for eliciting respondents’ mental maps, as well as the social meanings of regional linguistic variation (Preston, Reference Preston1986, Reference Preston1989). Such methods, including the use of hand-drawn maps (known as a “draw-a-map” task, cf. Preston, Reference Preston1989), are developed to collect respondents’ understandings of where people speak similarly and/or differently. Added to this, these methods investigate the sociocultural associations that respondents may have about language varieties spoken in certain areas and their speakers. As Evans (Reference Evans2011) points out, “This type of exploration of perceptions and beliefs via language reveals underlying theories of language held by the speakers and provides a window to the cultural beliefs of the respondents” (Reference Evans2011: 384). PD research therefore can be an initial crucial step in the description and analysis of the actual patterns of linguistic variation in a certain dialect area.
Interest in PD is not a recent development; it dates back to at least the 19th century “but was extensively developed in the mid-20th century, particularly in the Netherlands and Japan” (Preston, Reference Preston, Boberg, Nerbonne and Watt2017:177). As of the late 20th century, after Preston’s work on varieties of English in the United States (e.g., Preston, Reference Preston1989, Reference Preston1993, Reference Preston and Schneider1996, Reference Preston1999), a substantial body of research using the PD approach has been conducted to examine perceptions of regional English dialects in the United States and the United Kingdom (US e.g., Benson, Reference Benson2003; Bucholtz et al., Reference Bucholtz, Bermudez, Fung, Edwards and Vargas2007, Reference Bucholtz, Bermudez, Fung, Vargas and Edwards2008; Cukor-Avila et al., Reference Cukor-Avila, Jeon, Rector, Tiwari and Shelton2012; Evans, Reference Evans2011, Reference Evans2013; Hartley, Reference Hartley and Preston1999; UK e.g., Inoue, Reference Inoue1996; Montgomery, Reference Montgomery2007). Similar studies have been conducted for many other languages in the world, such as the languages of Japan, France, South Korea, China, and Turkey (e.g., Demirci & Kleiner, Reference Demirci and Kleiner1998; Jeon, Reference Jeon2013; Kuiper, Reference Kuiper2005; Long, Reference Long and Preston1999; Yan, Reference Yan2015). Findings of this line of previous PD research have revealed that respondents are generally aware of sociolinguistic patterns, especially in their own speech. In some cases, respondents recognized linguistic differences in a way that was similar to the way linguists had recognized them (Evans, Reference Evans2011; Hachimi, Reference Hachimi2015); they sometimes identified linguistic features that had been unnoticed by researchers and that warrant further examination (Evans, Reference Evans2011). Moreover, respondents had the perceptual ability to not only identify and recognize linguistic differences but also had skills in “detecting subtle differences in specific linguistic markers of variety” (Preston, Reference Preston, Boberg, Nerbonne and Watt2017: 200).
Recent PD studies have adopted mapping software using Geographic Information Systems (GIS) to digitally analyze large numbers of hand-drawn maps (e.g., Cramer, Reference Cramer2010; Cukor-Avila et al., Reference Cukor-Avila, Jeon, Rector, Tiwari and Shelton2012; Evans, Reference Evans2011, Reference Evans2013; Jeon, Reference Jeon2013; Montgomery, Reference Montgomery2007; Montgomery & Stoeckle, Reference Montgomery and Stoeckle2013). The main advantage of using such programs is their capability for aggregating all the respondents’ maps and combining them into one map. Such an analysis reveals patterns that would be difficult to note using traditional techniques, such as a visual examination of data. In addition, as described by Evans (Reference Evans2013:271), the digital analysis of maps via GIS software provides a variety of maps that have been derived from qualitative and quantitative aspects of the data; this means that both objective and common patterns of perceptions and attitudes can be seen.
2.1 Perceptual dialectology in Arabic
Compared with other languages, few studies have been done of attitudes toward language among Arabic-speaking peoples and/or that have incorporated PD approaches (see Albirini, Reference Albirini2016; Walters, Reference Walters, Versteegh, Eid, Elgibali, Woidich and Zaborski2006). The few studies of Arabic dialects that have been done mostly employed short surveys of attitudes toward language (e.g., Alahmadi, Reference Alahmadi2016 on Urban Meccan Hijazi Arabic; El-Dash & Tucker, Reference El-Dash and Tucker1975 on Egyptian Arabic; Hachimi, Reference Hachimi2012, Reference Hachimi2013 on Moroccan Arabic; Murad, Reference Murad2007 on Iraqi Arabic; Spolsky et al., Reference Spolsky, Tushyeh, Amara and de Bot1998 on Palestinian Arabic). Some other studies examined linguistic hierarchies of regional vernacular varieties among Arabic speakers (e.g., Hachimi, Reference Hachimi2015 on Maghreb and Mashreq Arabic varieties; Herbolich, Reference Herbolich1979 on Cairene Egyptian speakers; Ibrahim, Reference Ibrahim2000 on Egyptians and Moroccans).
To my knowledge, only three previous research studies actually employed PD approaches. The first and most related study within the context of Saudi Arabic dialects is Alrumaih (Reference Alrumaih2002). Using the draw-a-map task, Alrumaih examined the attitudes and perceptions of 60 speakers of Najdi Arabic, a variety of Arabic spoken in central Saudi Arabia, toward other varieties of Arabic in the same country. He also investigated speakers’ perceptions of other varieties in terms of “correctness,” “pleasantness,” and “degree of difference” using questionnaires and interviews. The results indicated that Najdi speakers had some linguistic insecurity about their own dialect compared with Classical Arabic and Modern Standard Arabic (MSA), particularly in terms of correctness. At the same time, Najdi speakers showed a higher level of linguistic security about their own dialect compared with other regional dialects in Saudi Arabia.
Theodoropoulou & Tyler (Reference Theodoropoulou and Tyler2014) conducted a similar PD project, but with a wider scope to examine the folk perceptions about dialectical variation within the Arab world among female undergraduate students at Qatar. Results demonstrated that participants grouped Arab dialect into five categories: the Maghreb, Egypt and Sudan, the Levant, the Gulf, and Somalia. Drawing on Goffman’s notion of principal as distinct from animator and author, the participants’ labels of dialect boundaries were analyzed revealing three types of principals: macro, meso, and micro. Although the study presented interesting results, it was limited to younger female respondents.
In Morocco, Hachimi (Reference Hachimi2015) conducted a PD study to try to understand the linguistic landscape in the Arab world. She examined not only the ways in which Moroccan Arabic speakers mentally map the linguistic boundaries of different Arabic dialects, but also the ideologized labels they employ for the various Arabic dialects they distinguish, their attitudes toward these dialects, and the hierarchies they create for these dialects. Her findings demonstrated that respondents provided similar regional boundaries for the five Arabic dialect areas defined by linguists. Analysis of the results revealed seven major ideological categories: “pan-Arab intelligibility,” “closeness to SA (Standard Arabic),” “aesthetic pleasantness,” “status,” “social attractiveness,” “morality,” and “gender appropriateness.”
3. Background
3.2 Qassimi Arabic linguistic situation
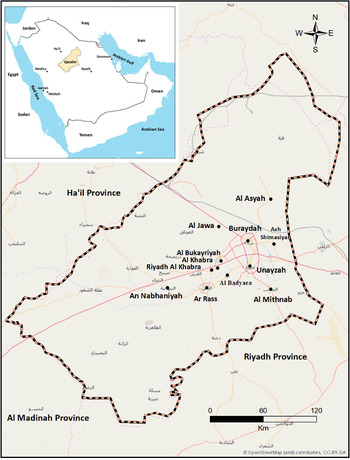
As stated earlier, QA is a variety of Najdi Arabic spoken in the Qassim province (hereafter Qassim) in central Saudi Arabia (see Map 1).Footnote 1 It is mainly spoken by the sedentary population (known locally as the ħa ari) (Ingham, Reference Ingham1994); speakers of the tribal dialects in Qassim, including the
 arb, Mu
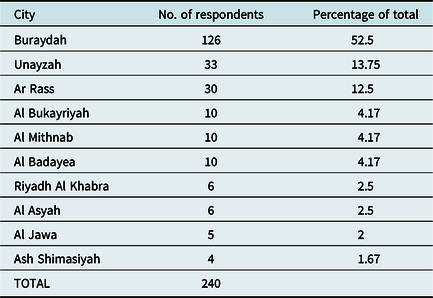
 air, Rashidi, ‘Utaiba, and ‘Anizah tribes, as well as other smaller tribes, mostly maintained their own dialects even after settlement in sedentary dwellings (Al-Jumaah, Reference Al Jumaah2017; Al-Ubudi, Reference Al-Ubudi1979).Footnote 2 There is no specific statistical information about the numbers of sedentary people in Qassim or the total numbers of speakers of QA and the tribal dialects. It can be estimated, however, that the total number of QA speakers is 500,000 to 600,000, based on the 2010 Saudi census (Central Department of Statistics and Information, 2010).Footnote 3 More than half the population of Qassim lives in Buraydah, the administrative capital; Unayzah, the oldest city, has the next largest population (see Table 1 for the percentage of the population living in each city compared with the total population of Qassim).
The location of Qassim in Saudi Arabia is seen in the upper left corner. A map of the Qassim province showing its main cities is seen in the center.

Distribution of Respondents by City (N=240)

Settlements in Qassim are very old; they date back to pre-Islamic ages in some places, such as Ar Rass and Al Asyah (see Al-Ubudi, Reference Al-Ubudi1979, for a detailed account of Qassim’s history and geography). These places were abandoned at a later time for unknown reasons. During early Islamic times, Qassim was inhabited by nomadic Old Arabic tribes, including the Tamīm,  ay’, Asad, and ‘Abs tribes (Al-Ubudi, Reference Al-Ubudi1979). There is a dearth of information about the history of central Arabia in the centuries that followed, including issues related to settlement and the linguistic, social, and cultural aspects of life (Al-Suwaida, Reference Al-Suwaida2011). This is particularly true for the period from the 8th century, when the spread of Islam occurred, to the 18th century, when the first Saudi State was established (Al-Salman, Reference Al-Salman1998:51).Footnote 4 The first urban settlement of people in modern history in Qassim took place in Unayzah in 1232 (Al-Salman, Reference Al-Salman1998:51). Buraydah and Ar Rass were established later, in the 16th century (Al-Ubudi, Reference Al-Ubudi1979). Today, Buraydah is the largest and most prominent city followed by Unayzah and Ar Rass, respectively.
Knowledge about the linguistic history of QA and the way in which the language evolved is extremely vague. For example, we know little about how a mixture of linguistic features was derived from various tribal Old Arabic dialects (mostly the ay’ dialect, as well as the Tamīm, Bakr ibn Wā’il, and Qays dialects) or how other features were derived from some old Yemini tribal dialects (Al-Jumaah, Reference Al-Jumaah2013, Reference Al-Jumaah2016a, Reference Al-Jumaah2016b, Reference Al Jumaah2017). From its present-day features, we can infer that it was probably a koine that resulted from contact between speakers of different dialects, particularly the dialects of ay’ and Tam m, plus some other Najdi dialects, during the early settlement of Qassim in the 13th to 17th centuries. It is noteworthy to point out that the modern Arabic dialects spoken today by certain tribes, such as the arb, Muair, Rashidi, ‘Utaiba, and ‘Anizah tribes, have not directly influenced QA, because the speakers of these dialects settled in Qassim in the early 20th century, after QA had evolved into its current form. As we will see in our research findings, QA respondents label speakers of these tribal dialects as Bedouin, and the respondents are aware of the ways in which these dialects differ from QA.
Al-Ubudi (Reference Al-Ubudi1979) asserted that the dialect boundaries of QA are in urban centers and small villages inhabited by sedentary people. Al-Jumaah (Reference Al Jumaah2017:43) was more specific and identified four major cities, Buraydah, Unayzah, Ar Rass, and Al Bukayriyah, as well as smaller towns and villages inhabited mainly by sedentary people, including Al Badayea, Al Khabra, Riyadh Al Khabra, Ash Shimasiyah, and Al Mithnab. He excluded Al Jawa and its smaller towns in the northeast region of Qassim,Footnote 4 as well as Al Asyah in the north,Footnote 5 on the basis that the speech in these regions exhibited linguistic features not heard in areas where QA is spoken. Both Al-Ubudi (Reference Al-Ubudi1979) and Al-Jumaah (Reference Al-Jumaah2013, Reference Al Jumaah2017) stressed that QA forms a dialectical unit with very slight differences among its speakers and that the differences are almost unnoticed by nonspecialists. Our findings will show, however, that these claims are not accurate, because many respondents were able to identify precise linguistic variation in QA.
To my knowledge, the first published description of QA was briefly presented by Al-Ubudi (Reference Al-Ubudi1979) in his renowned geographical directory of the Qassim province. He proposed three linguistic features of QA as the most distinctive and salient ones: (1) the deletion of /a/ in the singular object feminine suffix -ha, (2) the backing of the third-person masculine object/possessive pronoun -ah to become /uh/, and (3) the deletion of /-i/ in the first object pronoun -ni. All of these features of QA are shared by the Ha’il dialect in the north, because they have been preserved from the dialect of the ancient Arab tribe ay’. There are other features of the Ha’il dialect that are not employed in QA, however. We will see in our findings that respondents were aware of the differences between these varieties of Najdi Arabic, no matter how subtle they were, though many people in Najd and elsewhere find it sometimes difficult to differentiate between QA and the Ha’il dialect.
In 2015, Al-Aruk published her dissertation about QA and its relation to Classical Arabic fu
 a. As has been done in traditional Arabic dialectology studies, Al-Aruk presented a detailed descriptive account of QA, focusing on its phonological, morphological, and lexical features, and she compared them with the same features found in Classical Arabic. Al-Aruk also attempted to identify the linguistic variation across dialect areas in Qassim, particularly the phonological features, by presenting them in comparison tables and maps. The methodology that Al-Aruk adopted to calculate the frequency of such features in the tables and maps was not presented, however.Footnote 6 The data used in her study were based on speakers who were 65 to 90 years old; this yielded some features that are rarely used by current speakers of QA or are not used at all. For example, some phonological and lexical features that she identified in the speech of the Ar Rass area were not found in the present study, such as the deletion of the last sound in words ending in /j/, as in [dijaj] ‘chicken’, and the overuse of borrowed lexical items from Turkish by older respondents. Some of the results from Al-Aruk’s study are compared with the findings of our study in the results section, later.
The present study attempts to fill in the gap in the literature with regard to PD research on Saudi dialects in general and QA in particular. We will do this by presenting the first in-depth exploration of the language perceptions and ideologies of QA speakers, focusing on the varying geographical places and social groups of Qassim. This study will attempt to answer the following research questions:
1. Do speakers of QA perceive linguistic differences as it is spoken across Qassim?
2. If they perceive differences, with what labels and features do they associate them?
4. Method
4.1 The map survey instrument
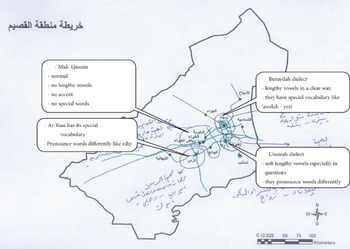
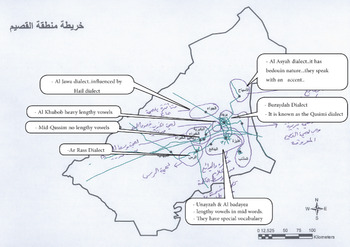
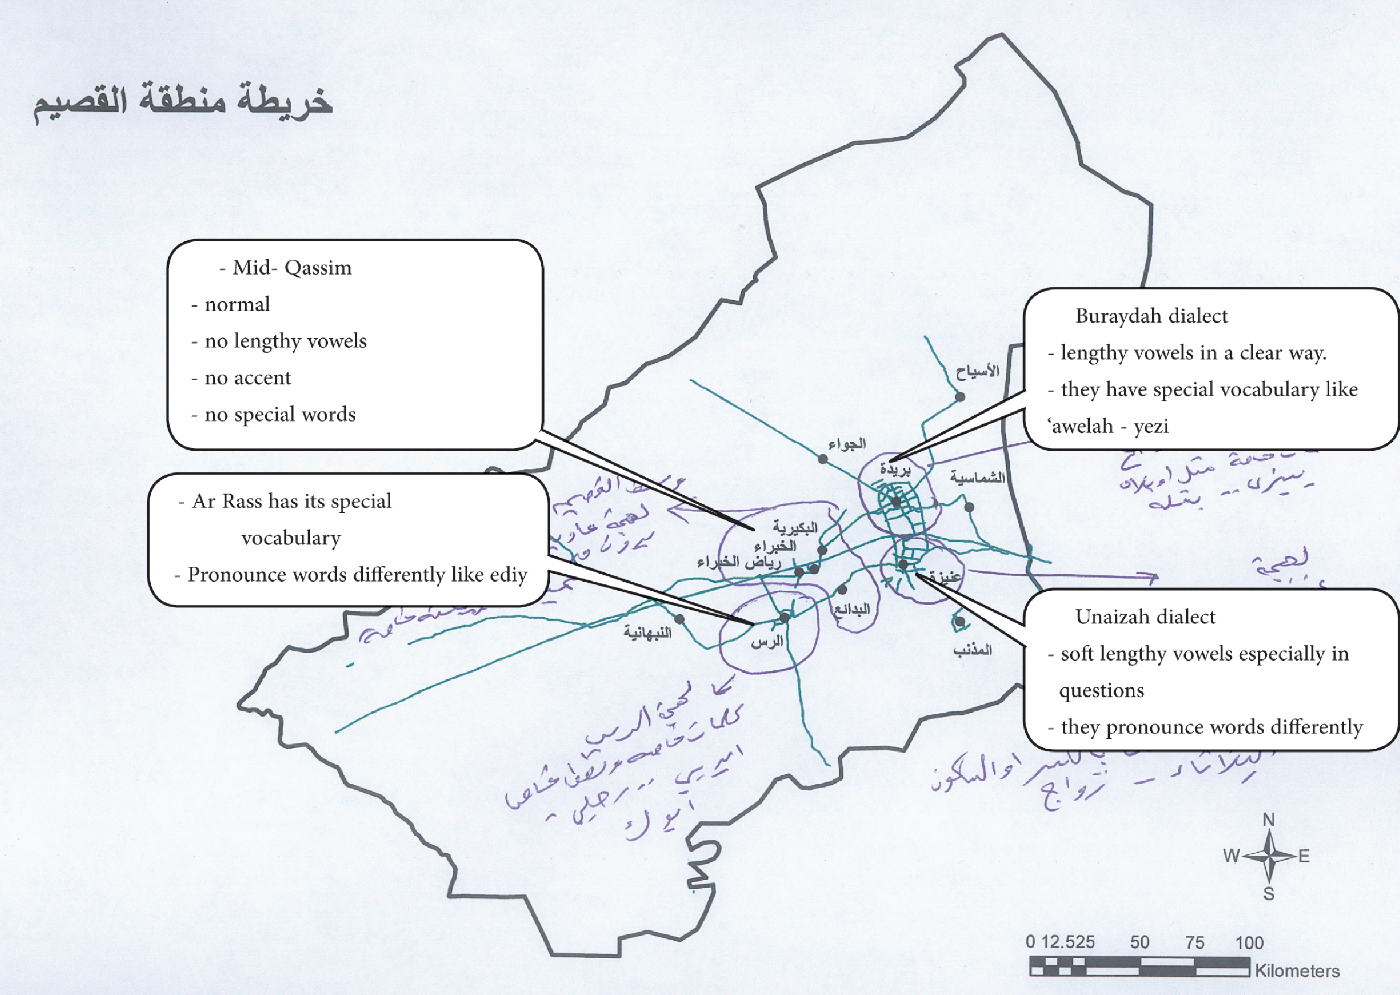
Drawing on the pioneering methods established by Preston (Reference Preston1989, Reference Preston1999) and Preston and Howe (Reference Preston, Howe, Denning, Inkelas, McNair-Knox and Rickford1987), a draw-a-map survey was implemented in this study. Respondents were given a minimally detailed map of Qassim showing its regional borders, major cities, and highways (see the Appendix). The reason for using such a minimally detailed map was to avoid any influences that additional geographical components might have on respondents’ perceptions of dialect boundaries (Cukor-Avila et al., Reference Cukor-Avila, Jeon, Rector, Tiwari and Shelton2012; Jeon, Reference Jeon2013). Respondents were instructed to draw a line around each area in which they thought people were speaking QA in a different way. Afterward, they were asked to write down more information about these areas, including adding labels or noting dialect features stereotypically associated with speakers from these places, such as a word, phrase, or special pronunciation, and to give examples of them. Demographic information regarding the respondent’s age, sex, place of birth, and place of residence in Qassim was also collected. All instructions and map information in the surveys were in Arabic to make the collection of data easier, because the majority of respondents did not speak English. All fieldwork surveys of male respondents were collected by the researcher, and all fieldwork surveys of female respondents were collected by female fieldworker assistants. Maps 2 and 3 show some of the varied responses that were collected.
Example of a map drawn by hand by a 35-year-old female from Al Badayea.
4.2 Data collection
The main selection criterion for respondents in this study was that they were all speakers of QA. They also had to be born and raised in Qassim. They were approached randomly from a population of various ages and regional backgrounds based on the 2010 National Census of Qassim. Regional categories were given priority over social ones (i.e., age and sex), in order to capture as much spatial representation of regional linguistic variation as possible (Evans, Reference Evans2011). As such, the number of respondents sampled from each region was a reflection of that region’s total population relative to all of Qassim.
Example of a map drawn by hand by a 60-year-old male from Buraydah.
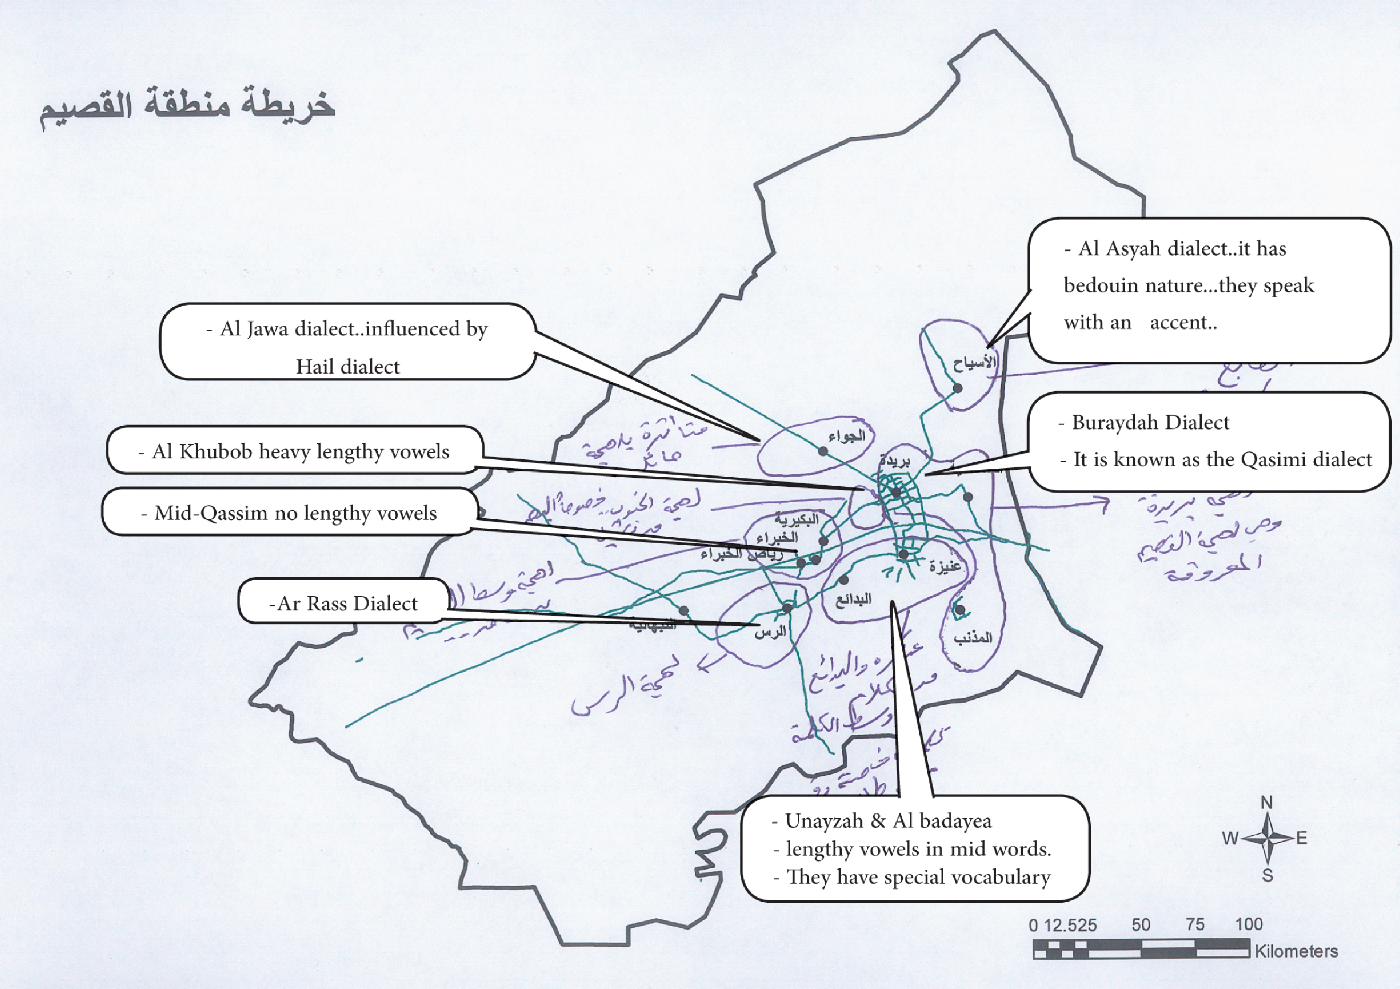
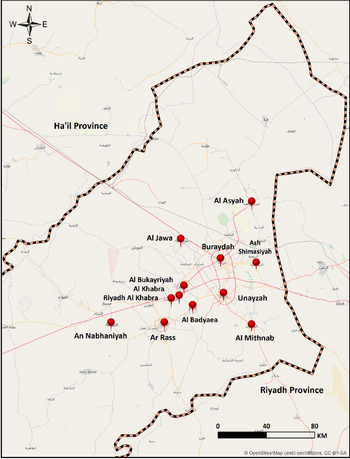
Surveys were collected at 11 sites in Qassim (see Map 4); they included the main cities of Buraydah, Unayzah, and Ar Rass, as well as other smaller towns, such as Al Bukayriyah, Al Mithnab, Al Khabra, Riyadh Al Khabra, Al Badayea, Uyun Al Jawa, Ash Shimasiyah, and Al Asyah. Table 1 illustrates the distribution of respondents at each collection site. All these sites were locally known as areas where QA is the predominant language spoken (Al-Jumaah, Reference Al Jumaah2017:43; Al-Ubudi, Reference Al-Ubudi1979:86). Respondents were also limited to the sedentary population (locally known as the ħaari) because QA is primarily used by them (Al-Ubudi, Reference Al-Ubudi1979). These selection criteria were chosen to eliminate any impact on the study’s results by other speakers’ backgrounds, particularly speakers of tribal dialects of Arabic, such as the arb, Muair, ‘Utaiba, Shammari,Footnote 7 and Rashidi tribes.
Sites of data collection in Qassim.

The majority of the map surveys were collected at university campuses in Qassim, especially those of younger respondents. Other sites included cafes, homes, offices, and restaurants. A total of 289 map surveys were collected; only 240 were included in the analysis, however; 49 were discarded for lack of demographic information or map details. Of the included 240 respondents, all were between the ages of 13 and 86 years, 121 (50.5%) were males, and 119 (49.5%) were females.
4.3 Data analysis
4.3.1 GIS analysis
We followed the data analysis procedures outlined in Evans (Reference Evans2011, Reference Evans2013) by incorporating the GIS software ArcGIS 10.5.1 in analyzing and comparing the data that emerged from respondents’ hand-drawn maps. GIS is valuable in a PD study because it is capable of quantitatively aggregating and querying the geographical data identified in the respondents’ maps, as well as the qualitative labels and demographic information associated with each perceived dialect area. The first step was to digitize the hand-drawn maps to make them readable and ready for analysis by the ArcGIS. Each map was scanned and then georeferenced by linking several “control points” on the scanned maps with a defined geographical coordinate system of Qassim. Next, each perceived dialect area drawn on each respondent’s map was “traced” as a “polygon feature” in the GIS software. At the same time, the demographic information and the qualitative comments provided by each respondent were added to each polygon as attributes. Once all polygons had been digitized with their attributes in the ArcGIS, composite heat maps were created, showing the frequency of overlapping polygons as a percentage. These composite maps included the most salient perceived dialect areas, as well as the most frequent qualitative comments given by all of the respondents.
4.3.2. Content analysis
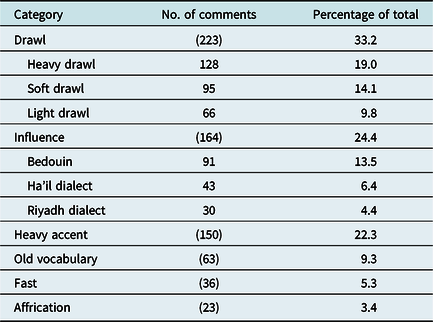
A content analysis was conducted of the metalinguistic statements of all of the respondents, including labels, comments, and examples for perceived dialect areas identified on the maps. Our study draws on the keywords technique (Evans, Reference Evans2011; Garrett et al., Reference Garrett, Williams and Evans2005), in which all labels are compiled and then examined to find the most frequent ones. Some labels were long and detailed and therefore had to be shortened by using a representative word or phrase. Labels about variation in lexical items or about cultural stereotypes associated with some cities in Qassim were not included in the analysis. Next, labels with similar words and phrases were grouped together to reveal any emerging themes or consistent patterns. For example, the labels lengthened vowels and slow were combined to form one category label called drawl. This category label was the most frequent one used (found in 223 of 671 responses, or 33.2%); it contained many different labels associated with lengthened speech and therefore had to be examined further and divided into related groups of labels. Three subcategories emerged out of this process: heavy drawl, soft drawl, and light drawl. The content analysis resulted in six categories; Table 2 presents the six largest of the categories identified by all respondents based on their order of frequency. The remaining labels were not included in the present study, either because they were associated with different lexical items, or because the data in them were too few and could not be combined with other categories. The second most frequent category label was influence, and it had three subcategories: Bedouin, Ha’il dialect, and Riyadh dialect. The third most frequent category label was heavy accent. The fourth most frequent category label was related to overuse of old vocabulary. The fifth most frequent category label was fast. The last most frequent category label was affrication. It refers to the phonological process where the velar stops /k/ and /g/ are realized as two dental affricated variants [ ] and [
 ], respectively (Al-Rojaie, Reference Al-Rojaie2013).
The Six Perceptual Category Labels Identified Most Frequently by All Respondents (N=671)

5. Results
5.1 Overall perceived dialect areas
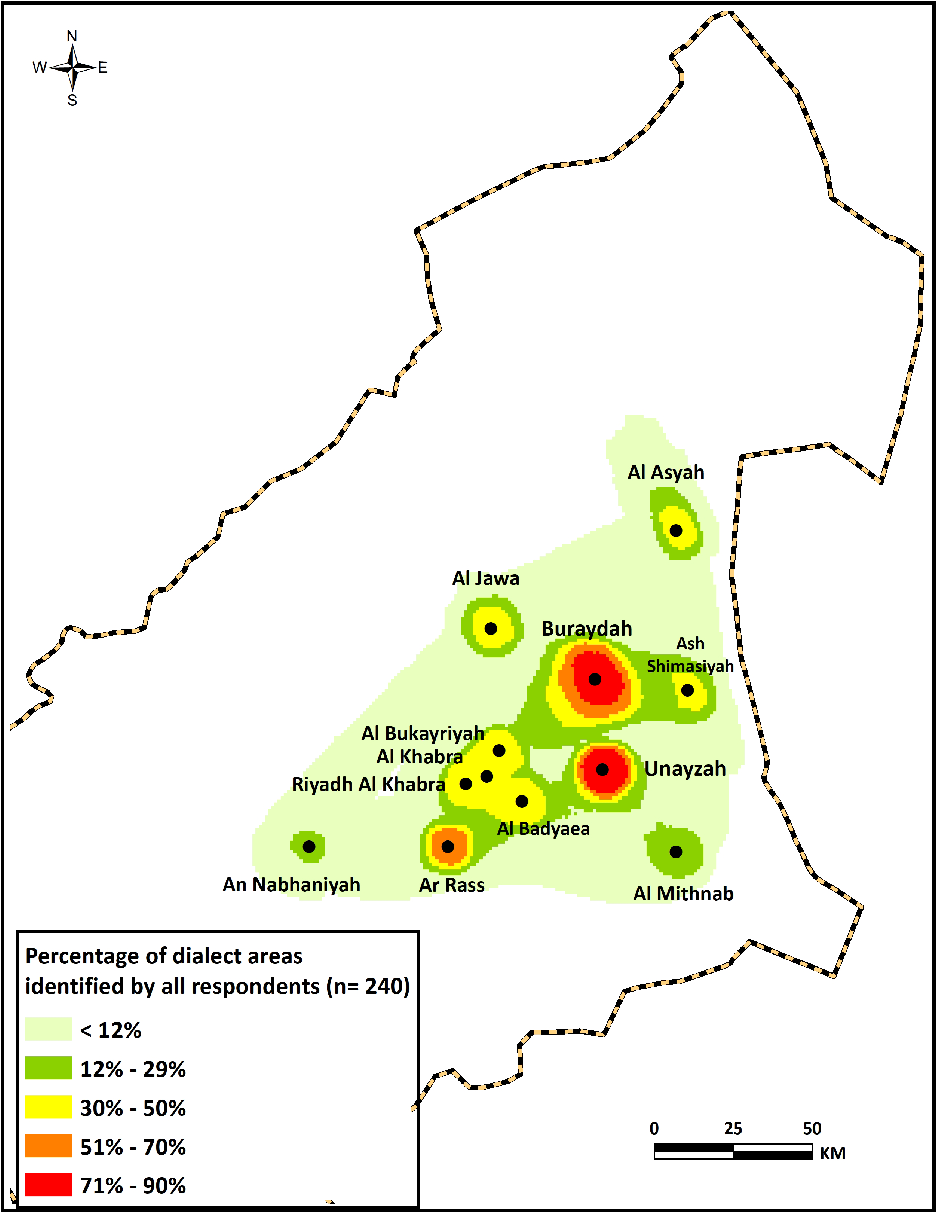
Map 5 displays a composite map of the perceived dialect areas marked on all 240 hand-drawn maps. It shows an overall picture of the respondents’ perceptions of the placement and extent of dialect areas. It also indicates the level of agreement among respondents on the saliency of dialect areas by combining overlapping areas and displaying percentages of agreement levels. Dialect areas marked with the darkest color had the highest level of agreement among respondents, whereas areas marked with the lightest color had the lowest level of agreement. Dialect areas in Buraydah and Unayzah, for example, are the darkest ones on the map, representing agreement among 90% of respondents.
Composite map of the salient dialect areas that were most frequently identified by all respondents. The darkest color indicates the highest overlap, and the lightest color indicates the least overlap.

As shown in Map 5, 10 dialect areas have been identified with different frequencies. The most salient dialect areas were marked in the dialect areas of Unayzah and Buraydah, followed by Ar Rass with an agreement level of 70% of respondents. The next most salient area included four cities near each other in the middle of Qassim, namely, Al Bukayriyah, Al Khabra, Riyadh Al Khabra, and Al Badayea in an agreement level of 50% of respondents. This grouping will be called henceforth the Mid-Qassim dialect area. In a similar manner and level of agreement, two dialect areas in the northern part of Qassim have been identified in Al Jawa and Al Asyah, and a dialect area in the eastern part of Qassim, Ash Shimasiyah, has also been identified. A dialect area not clearly shown on the map was identified on the western side of Buraydah; it is known locally as Al Khuboob.Footnote 8 The least frequently identified dialect areas were located in Al Mithnab, south of Qassim, and An Nabhaniyah, at the western end of the Qassimi dialect areas in an agreement level of 29% of respondents.
Overall, the boundaries of identified QA dialect areas are consistent with those outlined by Al-Ubudi (Reference Al-Ubudi1979) and Al-Jumaah (Reference Al Jumaah2017) in urban centers and small villages inhabited mostly by sedentary people. There was no single attempt by any respondent to identify such areas beyond these particular ones. Such results indicate that QA has remained limited to sedentary people living in these areas and that the dialect apparently has not spread out to the new settlements for Bedouin populations throughout Qassim established during the extensive urbanization process of the past few decades. The results also show, however, that half of the respondents agreed that the perceptual boundaries of QA included Al Jawa and Al Asyah in north and northeast Qassim, a finding that contradicts their exclusion by Al-Ubudi and Al-Jumaah, as stated above. This can be explained by the fact that the traditional dialectologists emphasized certain unique linguistic features that are not commonly heard in QA, whereas the respondents did not place the same emphasis on such features; rather, they highlighted shared linguistic features as well as other mutual variables among people from these areas, such as being sedentary and geographically located within Qassim.
As in studies by Evans (Reference Evans2013) and Jeon (Reference Jeon2013), dialect areas associated with urban centers were found to be the most salient. This pattern can be explained based on geographical, social, and historical factors associated with these dialect areas. It may not be surprising that Buraydah is one of these areas, considering the fact that it is Qassim’s regional capital and also its largest and most populous city. It is also located right in the heart of Qassim and many people visit it daily from neighboring cities, so there is more contact with and higher recognition rates of its residents’ dialect. Besides, the Buraydah dialect represents the typical Qassimi dialect for many QA speakers, because it apparently preserves the most salient linguistic features stereotypically associated with QA (as shown in the results later). It is also easily recognized by many people from outside of Qassim, as reported by many of the personal contacts from neighboring regions. Unayzah and Ar Rass are the second largest cities in Qassim, after Buraydah, and are older than many other cities in the region. This has perhaps helped their residents to develop their own special way of speaking, or at least to maintain certain linguistic features that are used exclusively by them.
Up to now, many sedentary families from these perceived dialect areas have lived in them for centuries and continue to do so. It is possible; therefore, that the distinctiveness of these perceived dialect areas has to do with the notion of social networks (Milroy & Milroy, Reference Milroy and Milroy1985, Reference Milroy and Milroy1992). The residents of these urban centers have apparently established, over the years, speech communities with dense social networks and strong local ties, leading to norm enforcement and permitting only slow changes. This is apparent in Al Jawa and Al Asyah; each area has developed and maintained its own special local variety that is different from the dialects in neighboring urban centers despite each area’s relative proximity to them. Within these areas, people formed close networks with strong group relationships through marriages, workplace, and daily encounters. Most people there worked for decades in farming-focused communities that often included entire families. It is therefore not surprising to find that the social network of a person in these communities is limited to shared friends, relatives, and workmates. Such network ties have probably shaped the distinctive local vernaculars of these areas and formed resistance against change from neighboring local dialects.
The saliency of the Mid-Qassim dialect is a valuable example of how historical, geographical, and social factors apparently have contributed together to making the dialect unique within Qassim. Unlike other dialect areas, this area is the only one that includes four urban centers. Historically, Al Bukayriyah and Al Khabra were both established in the 18th century by people migrating from different places in Qassim (Al-Miguishi, Reference Al-Miguishi1988:19; Al-Nifisah, Reference Al-Nifisah2006:46). Later, people of Al Khabra established Riyadh Al Khabra to serve as a farming region, and it later became an independent city (Al-Aruk, Reference Al-Aruk2015). Over the years, people from these three cities have established strong social ties with each other because of their close proximity. In addition, many families had members living in more than one city, and sometimes in all three cities. Like Riyadh Al Khabra, Al Badayea was originally established as a farming region (by people from the other three cities) in the 19th century (Al-Ubaid, Reference Al-Ubaid1988:27), and it later became an independent city.
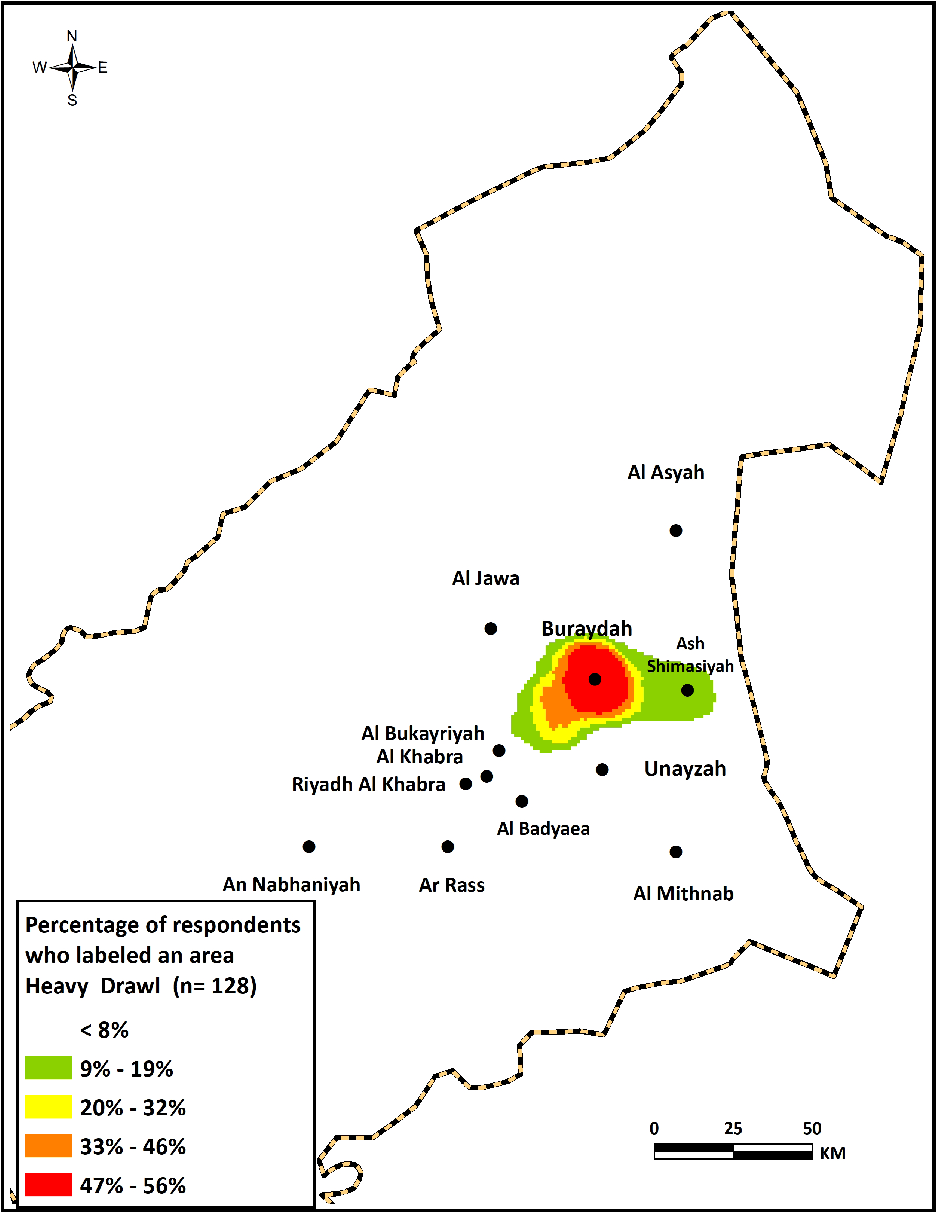
Composite map of areas labeled as having a heavy drawl.

Although urban centers were the most frequently identified dialect areas, some areas outside of city limits were also outlined by perceptual boundaries. Some respondents, for instance, thought that the Buraydah dialect stretched to cover the region up to Ash Shimasiyah to the east and Al Bukayriyah to the west. Other respondents, particularly from Unayzah, drew the boundaries of Unayzah to include some neighboring cities, such as Al Mithnab in the south and/or Al Badayea to the west. Interestingly, respondents from these smaller towns often did not agree with respondents from neighboring larger cities that they speak similar dialects. Rather, they usually believed that they had their own dialects. This pattern of perceptions can be attributed to their constructed social identities, as well as less frequent exposure to and contact with speakers from other dialects, compared with respondents from larger cities.
In my meetings with respondents during the data collection phase, I noted that most exhibited a sense of affiliation with and pride in their hometowns. They also frequently attempted to highlight the unique features that made them different from other towns, including historical, social, and linguistic characteristics. In Ash Shimasiyah and Al Asyah, for example, some respondents mocked certain linguistic features that are widespread in the speech of the Buraydah dialect and asserted that such features are stigmatized in their own dialect. Similar statements were made by some respondents from Al Mithnab and Al Badayea when they were describing the dialects of Unayzah and Ar Rass, respectively. Such findings suggest that the role of identity is apparently significant in shaping and guiding respondents’ perceptions about the dialect areas in which QA is spoken and the linguistic landscape in Qassim in general. Further examination of such observations is needed to explore the possible linguistic outcomes of respondents’ constructed identities not only on their perceptions of dialect areas but also on their patterns of linguistic variation and change, especially patterns related to the geographic diffusion of linguistic features from larger cities to smaller towns, and vice versa.
5.2 Drawl
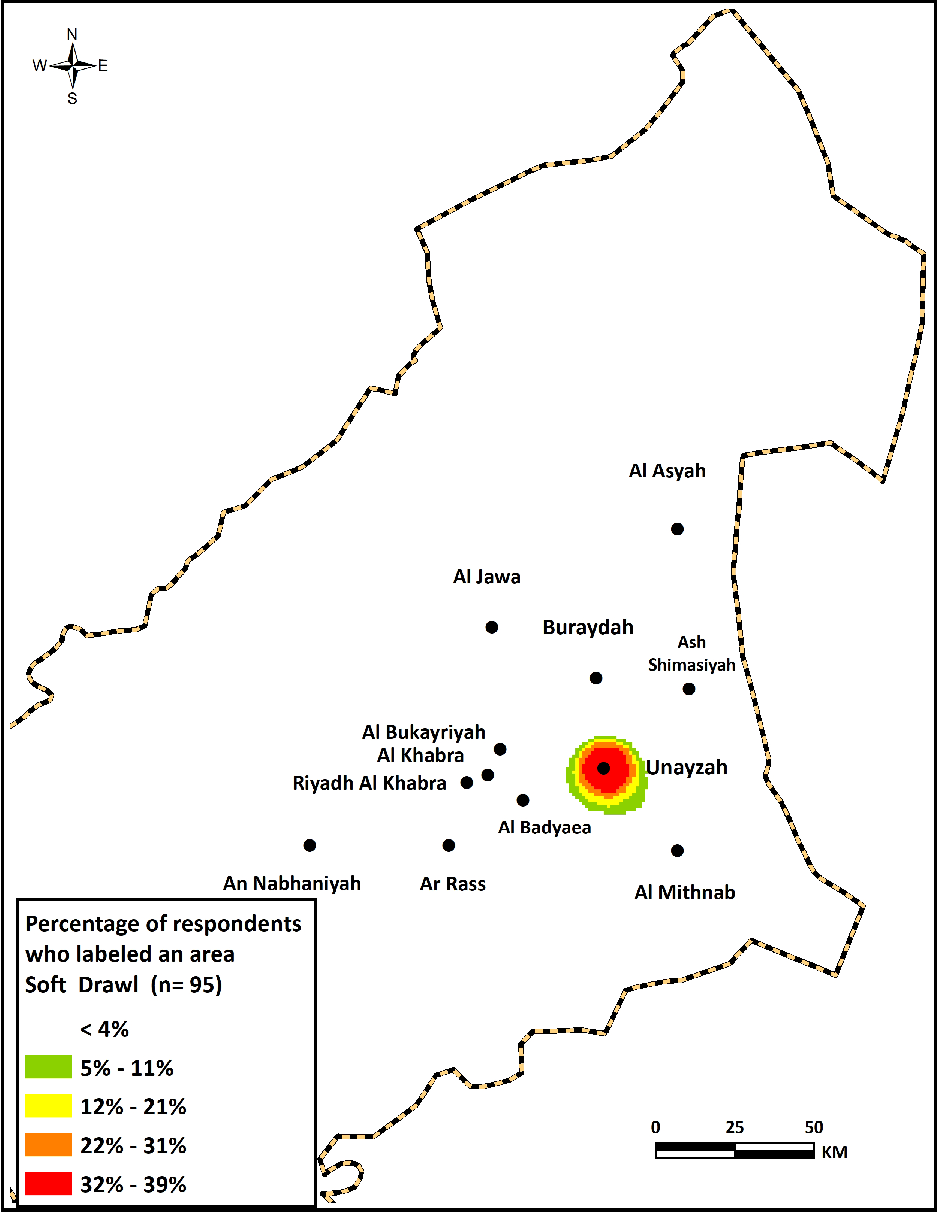
As stated earlier, drawl was the category of perceptual labels most frequently identified by all respondents (n=223). Over one third of respondents indicated this category label as a key element in distinguishing dialect areas in QA. Drawl refers in the present context to the frequent lengthening of certain vowels in a slow way of speaking. It is similar to the general meaning of the southern drawl heard in Southern American English (Cukor-Avila et al., Reference Cukor-Avila, Jeon, Rector, Tiwari and Shelton2012; Feagin, Reference Feagin, Nunnally, Brackner, Kimzey and Boykin2008). Respondents used various keywords and phrases in Arabic to describe speech that has this feature, including mad ‘extension’, mamoo ‘lengthened’, and taweel ‘prolongation’. Some colloquial labels were also used, such as magha ‘extension’, saab ‘drawn out’, and other similar terms. Analysis of the comments suggests that the category can be divided into three types based on respondents’ descriptions: (1) heavy drawl, (2) soft drawl, and (3) light drawl. In the following section, each type will be discussed in detail and a composite map will be provided that shows the respondents’ perceptions of where this feature is used.
5.2.1 Heavy drawl
Of the types of drawl analyzed in our data, heavy drawl was the most frequently identified (n=128). Respondents used certain keywords as adjectives to describe the intensity of drawl, such as thaqeel ‘heavy’, jidin ‘very’, katheer ‘many’, and ghali ‘thick’.
Composite map of dialect areas labeled as having a soft drawl.

As illustrated in Map 6, heavy drawl is most commonly associated with the Buraydah dialect area, or regional capital zone. It was also frequently identified in the Al Khuboob area. Further analysis of the labels in terms of the respondents’ origin revealed that the Buraydah dialect was identified by respondents from all of the cities, including those nearby, such as Ash Shimasiyah and Al Jawa. Al Khuboob was usually marked by respondents from Buraydah. These results suggest that heavy drawl served as a strong linguistic signal to identify dialect variation in QA. For instance, one respondent from Ar Rass commented that “If I hear people with a heavy drawl, I can almost guarantee that they are from Buraydah.”
Interestingly, some respondents from Buraydah believed that heavy drawl was not typical in their speech. One respondent, for instance, commented that “Not all people in Buraydah drawl heavily.” He also claimed that “Heavy drawl was borrowed from [the] Al Khuboob region, especially from [the] Al Busar area and its surrounding villages.”9 Another respondent asserted that the frequent users of heavy drawl from Buraydah are “either originally from Al Khuboob or have strong contact with [persons from that area].” These comments suggest that respondents are aware of the internal variation in their dialects. Most respondents from other places in Qassim associated heavy drawl with the speech of Buraydah in particular, because they were apparently either unaware of the local divisions within Buraydah or had not been in frequent contact with speakers from the Al Khuboob area.
Heavy drawl was overwhelmingly perceived as a negative feature that stigmatized the speaker. Many respondents, including those from cities near Buraydah such as Ash Shimasiyah and Al Asyah, tried to disassociate themselves from it. For many respondents, heavy drawl was generally viewed as a stereotypical and widely salient marker of QA by non-Qassimi people. One respondent, for instance, stated that “Buraydah dialect with its heavy drawl is the widely known and traditional representation of the Qassimi dialect outside of Qassim.”
5.2.2 Soft drawl
Soft drawl is the second most frequently identified type of drawl (n=95). Map 7 demonstrates that Unayzah and its immediate surroundings are most often associated with soft drawl. Various keywords and phrases were used by respondents to describe this feature, including mad na’m ‘soft extension’, tamee fih shwi no’mah ‘lengthening with a bit of softness’, and kasra na’mah ‘soft extended vowel’. Some respondents linked this feature directly with Unayzah as the tamee Unayzah ‘Unayzah drawl’. In order to precisely describe it, other respondents attempted to show its difference from the heavy drawl used by the people of Buraydah. For instance, one respondent commented that “People of Unayzah have prolonged speech; it is different from that heavy drawl used in Buraydah. It is a bit softer, in the middle of words.” Some other respondents identified the frequent function for which it is widely used; one respondent provided this description: “Unayzah people prolonged their speech softly, especially in questions.”
These examples suggest clearly that the soft drawl is extremely salient and almost exclusively associated with the Unayzah dialect area. Some respondents noted where the sound is often used in a word and for which function. This indicates the high level of saliency that this feature has in the respondents’ perceptions. These comments also suggest that the soft drawl perhaps emerged and evolved in Unayzah at a certain time in the past but did not become diffused outside of the city. Some respondents reported to me that they noticed the soft drawl in the speech of people originally from Unayzah who currently are living in other cities in Saudi Arabia.
Generally speaking, respondents have conflicting evaluations of this feature. Some view it positively as a sign of politeness and urbanized speech, whereas others perceive it negatively based on the notion that it sounds feminine, especially when used by men.
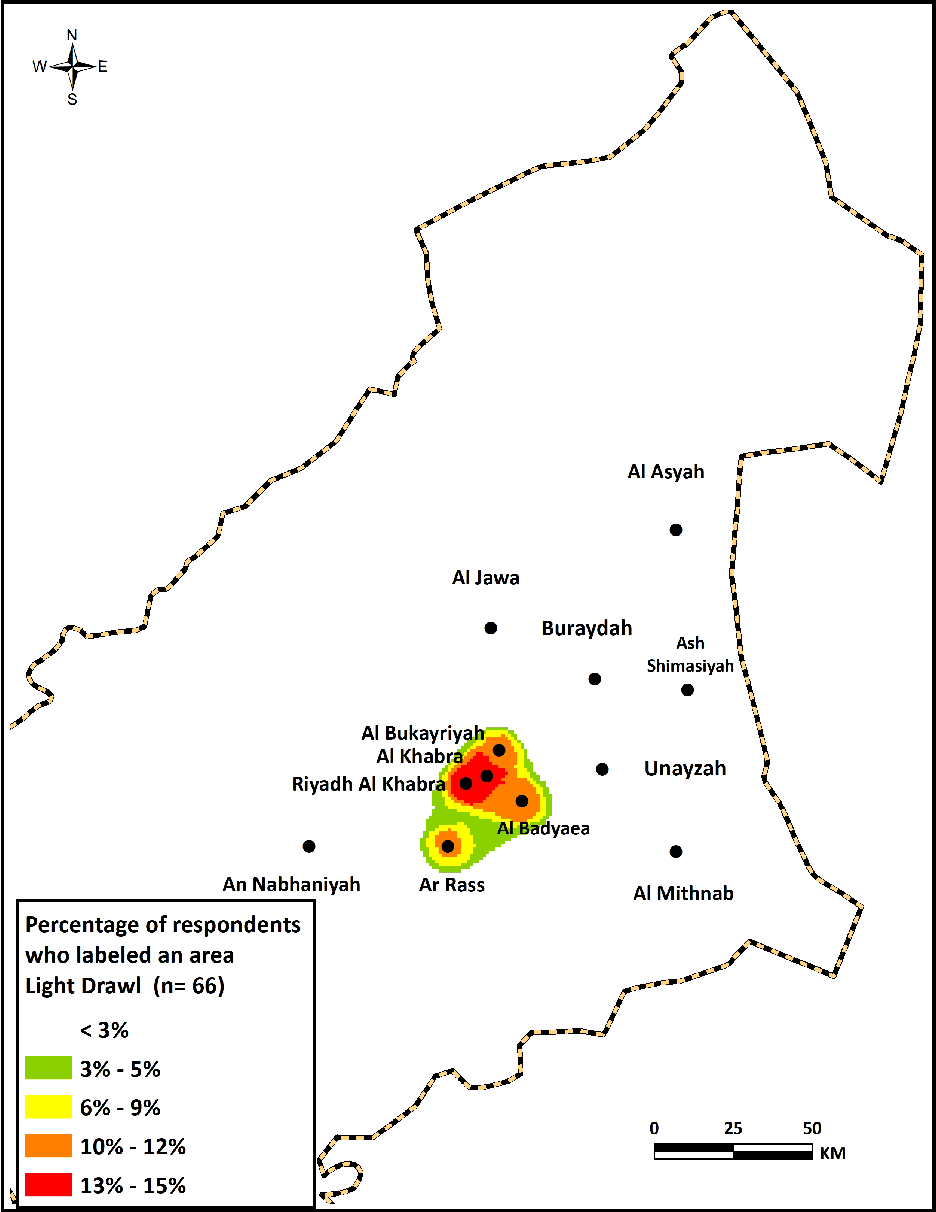
5.2.3 Light drawl
Light drawl is the last type of label in the drawl category (n=66). The frequent keywords and phrases used to label this feature include tamee khafif ‘light drawl’, mad ‘adi ‘normal’, mad madood ‘limited drawl’, and balkad tasma’ mad ‘barely hear a drawl’. Some other respondents used the phrase white accent to denote accent free. Just like their descriptions of soft drawl, some respondents attempted to compare how the feature is employed in different cities. For example, a respondent commented about the accent in the Mid-Qassim dialect by saying that “People here almost don’t drawl, not like the heavy drawl in Buraydah or the soft one in Unayzah.”
As displayed in Map 8, places in Mid-Qassim, including the cities of Al Bukayriyah, Al Khabra, Riyadh Al Khabra, and Al Badayea, as well as Ar Rass, were most frequently identified as having a light drawl or almost no drawl. This perception sounds surprising considering the widespread view inside and outside of Qassim that the drawl is frequently heard in QA. It may be attributed to the historical, geographical, and social factors that, in combination, contributed to forming a relatively homogeneous local variety of QA characterized by its light accent, which is different from the stereotypical variety used in the two biggest cities in Qassim, Buraydah and Unayzah.
Composite map of the dialect areas labeled as having a light drawl.

5.3 Heavy accent
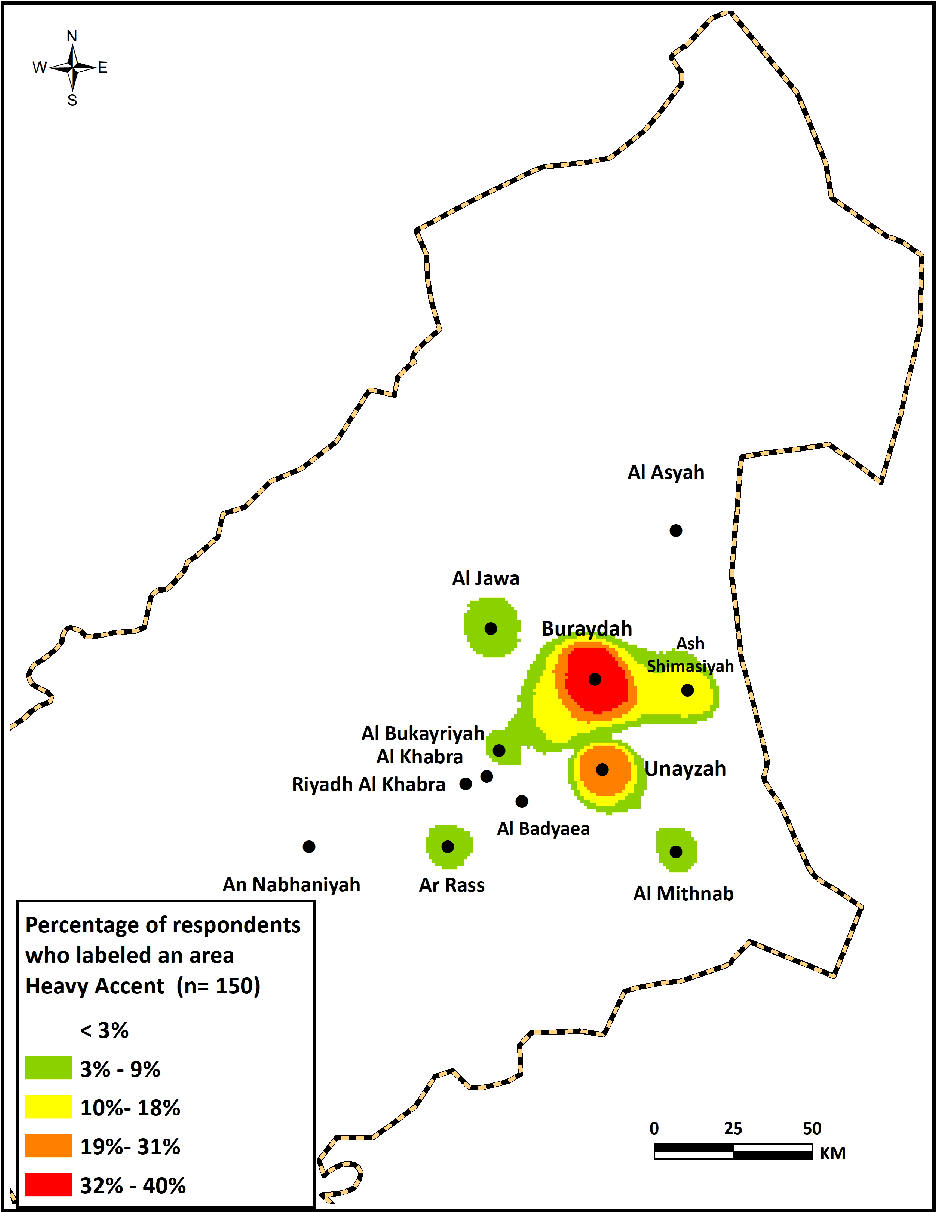
Heavy accent was the most frequently identified single label used by respondents (n=150), constituting 62.5% of all labels. This indicates clearly that the heavy accent is a recurrent feature, often present in the minds of respondents when describing the linguistic behavior of speakers. Examples of the keywords and phrases employed to describe this feature included heavy, rough, thick, and strong. In some cases, respondents used two labels together to describe similar features, such as heavy drawl and heavy accent. One respondent from Ar Rass stated about the Buraydah dialect area, “It’s so heavy that you can’t understand it sometimes, its drawl and heavy pronunciation.” A young woman from Buraydah commented about the dialect of her city by saying, “It is stigmatized and embarrassing to me … everything is heavy in this dialect … its heavy drawl … and heavy pronunciation … they always back vowels uh as in his (-uh) ….” Another respondent from Unayzah was specific in his description: “QA is generally a heavy-accented variety, but its heaviest in Buraydah because of the higher frequency of backing vowels …” These examples clearly suggest that heavy accent was salient to respondents and was commonly associated with frequent backing of the vowel in the third-person masculine object and possessive pronoun as /-uh/.
As illustrated in Map 9, the areas most frequently labeled with heavy accent are in Buraydah and Al Khuboob, followed by areas in Unayzah and Ash Shimasiyah. These findings, together with those related to heavy drawl, point to the observation that the Buraydah dialect area represents the heavy version of QA and is negatively viewed by many respondents.
Composite map of dialect areas labeled as having a heavy accent.

5.4 Old vocabulary
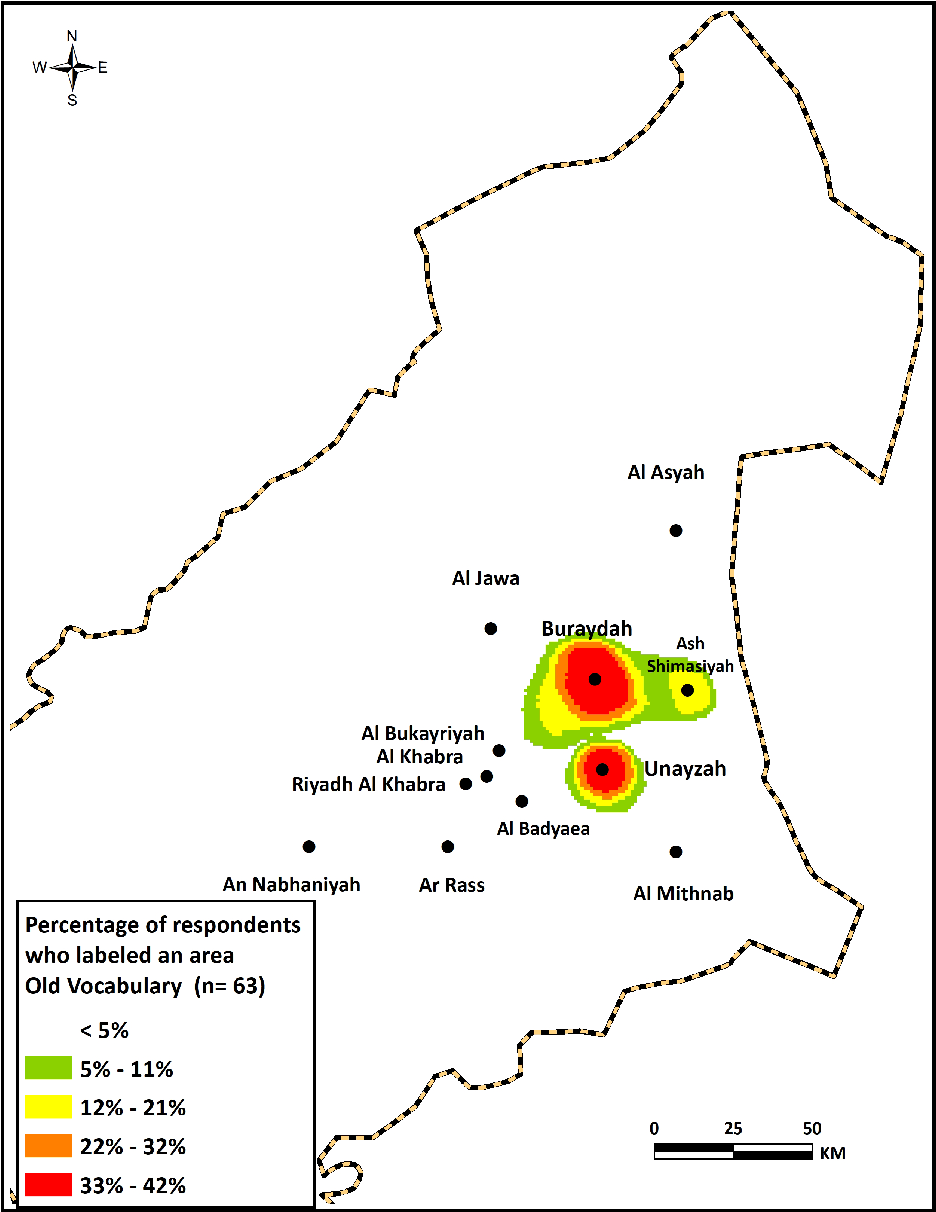
The category of old vocabulary was identified by labels that characterized certain lexical items, phrases, and expressions associated with an old-fashioned, traditional style of QA identified in some dialect areas (n=63). Examples of keywords and phrases used to label this category include old-fashioned, traditional, old-vernacular, not modern, dated, and old-people words. A female respondent from Buraydah commented about the dialect of her hometown by saying, “Some people here dig for old words to use them.”
As shown in Map 10, speakers in the dialect areas of Buraydah and Unayzah, followed by Ash Shimasiyah and Al Khuboob, were the ones most frequently identified as using an old vocabulary. These areas are in the heart of the region where QA is perceived to be spoken, in the largest and most historic cities (Buraydah and Unayzah). Therefore, the likely reason for these perceptions is related to the historical evolution of QA in certain areas, in which many lexical words were used, created, or borrowed; these words were not transferred to other smaller urban centers, however.
Composite map of dialect areas labeled as having an old vocabulary.

Other possible factors may be related to the people’s interests. One respondent, for example, pointed to the relationship between maintaining cultural traditions and preserving an old-style vocabulary. He commented that “The people in Unayzah like things related to old traditions and heritage, so no wonder they like using old words.”
5.5 Influence
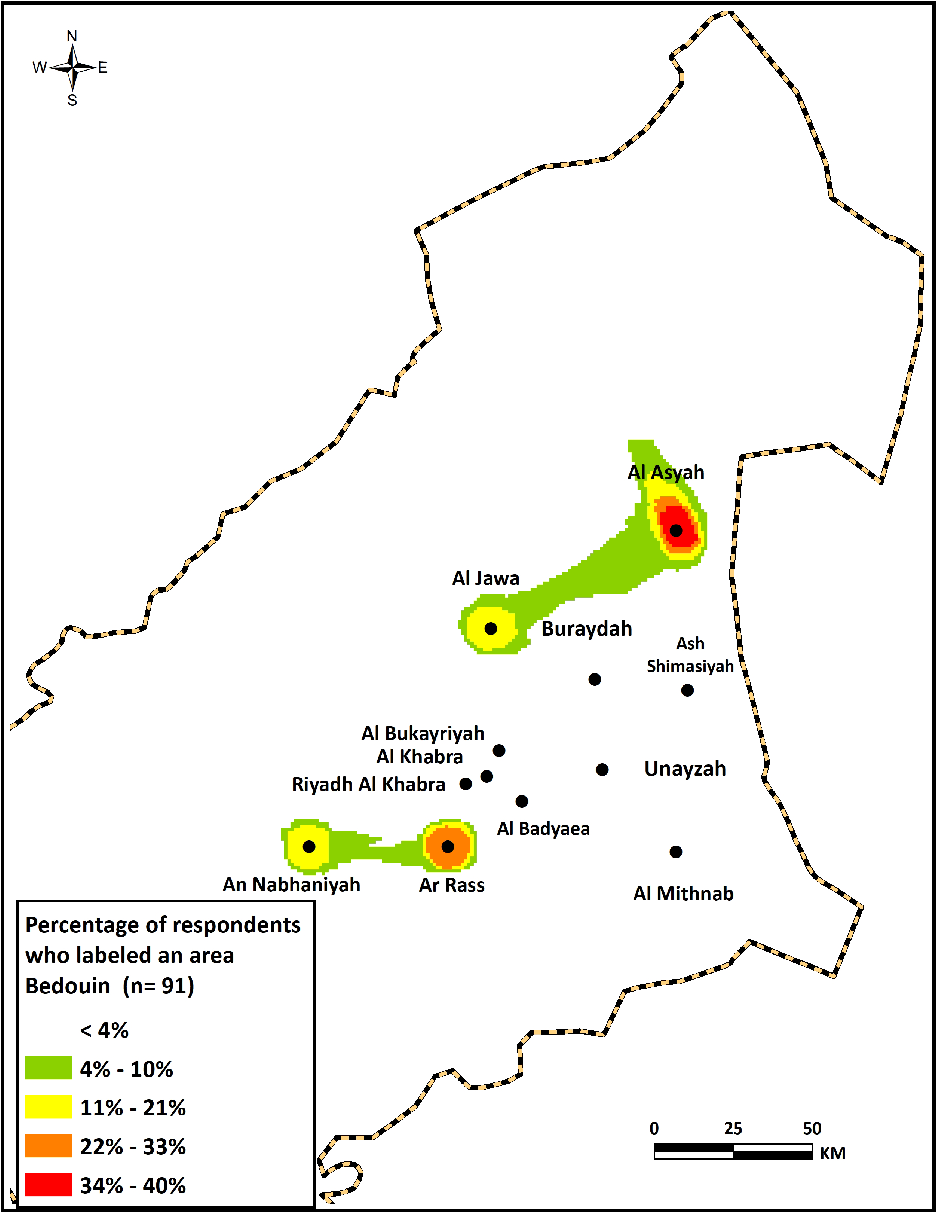
The category of influence concerned the influence of certain regional dialects on local QA dialects. The influenced dialect areas lie on the perceived dialect boundaries of QA, as shown in Map 5. The influence of these dialects is more salient for certain phonetic and lexical features. The largest influence identified by respondents was Bedouin dialects, followed by the Ha’il dialect and then the Riyadh dialect. This pattern of perceptions is consistent with some in previous studies (e.g., Cramer, Reference Cramer2010; Llamas, Reference Llamas2007), in which speakers residing on dialect and regional borders exhibited varying degrees of regional identity, as displayed by variable linguistic behaviors.
5.5.1 Bedouin influence
Of the labels indicating an influence on QA dialect areas, Bedouin influence was the most frequently identified by the respondents (n=91). Keywords used to label this type of influence were influenced by Bedouin dialect, has a Bedouin style, hear lots of Bedouin vocabulary there, feel a Bedouin accent, and speak like Bedouins. These perceptions are often stated in reference to phonetic and lexical variants stereotypically linked to Bedouin dialects, such as the use of the multifunctional word abk or of the third-person singular masculine /-ah/ or /-ih/ instead of /-u/. These perceptions are often attached to a stigmatization of these features, reflecting the sociocultural evaluations that the sedentary population usually has toward Bedouins as being inferior and less civilized.
As shown in Map 11, the most frequently identified dialect area was Al Asyah, followed by Ar Rass, and then Al Jawa and An Nabhaniyah. All of these places were marked on the perceived dialect boundaries of QA, as described in Map 5. These perceptions add support to what Al-Ubudi (Reference Al-Ubudi1979:86) and Al-Jumaah (Reference Al Jumaah2017:43) noted about the dialects spoken in Al Asyah and Al Jawa as having distinct linguistic features not commonly used in QA. Generally, these perceptions may be attributed to the settlement patterns, social structure, and level of contact within the communities of these dialect areas.
Composite map of dialect areas labeled as having Bedouin influence.

Before examining the current results related to a perception of Bedouin usage, it would be prudent to briefly shed light on the current meanings associated with the Bedouin label as it is used in contemporary Qassimi communities, to better understand the basis for and construction of these perceptions. The term Bedouin is defined in the Oxford English Dictionary as “a nomadic Arab of the desert” (OED, 2018). This definition must be revised, however. Because of the huge socioeconomic changes that Saudi Arabia has undergone in the past decades, particularly rapid urbanization and settlement of Bedouin peoples under government programs, most Bedouin people currently live in sedentary dwellings in all regions of Saudi Arabia. Therefore, the term Bedouin today does not only “describe a way of life of nomadic community” (Shmueli & Khamaisi, Reference Shmueli and Khamaisi2015:6); rather, its meaning has been extended to describe someone of Bedouin descent (i.e., a person who has settled recently in a sedentary dwelling) or someone who is culturally affiliated with and connected with the Bedouin tribal traditions and culture, including its dialect.
In Al Asyah, for example, people who first settled there in the early 18th century were mainly from the ‘Utaiba tribe, migrating from Az Zulfi, a town to the southeast of Buraydah (Al-Fuhaid, Reference Al-Fuhaid2009; Al-Ubudi, Reference Al-Ubudi1979). Despite the fact that these people have become sedentary over the years, people often assume that they have maintained certain linguistic features, particularly phonetic ones, from their original dialect. Added to this, many people from other tribes, including the arb, ‘Anizah, and Muair tribes, migrated later to settle in Al Asyah (Al-Fuhaid, Reference Al-Fuhaid2009). The effect of tribal dialects, as well as the distance of Al Asyah from other cities in Qassim, may have contributed to causing the Al Asyah people to preserve certain linguistic features associated with Bedouin tribal dialects.
As speakers of a sedentary dialect, many people in Qassim consider the use of linguistic features associated with tribal dialects and cultures as Bedouin, regardless of the actual name of the tribe using them. This notion explains why certain places have been marked as having Bedouin influence, such as Al Jawa and An Nabhaniyah. Some respondents, for instance, labeled the Al Jawa area as having Bedouin influence based on the general impression that its speakers have features similar to those associated with the tribal dialect of Shammar. Other respondents were more specific in their description by linking it to the Ha’il dialect; this is an accurate label not exclusively limited to tribal speakers.
Ar Rass presents an interesting situation owing to its mixed and changing social structure. Historically, Ar Rass has been considered a sedentary town in which many independent, extended families have lived for centuries. During this time, they have constructed a form of local social identity, as well as their own local culture. In past decades, the settlement of Bedouins has influenced the area’s social structure. Many Bedouins from different tribes, particularly the arb and Rashid tribes, left their traditional nomadic lifestyle to settle in Ar Rass. The Bedouin settlement in Ar Rass has taken place as part of the government program for settling and resettling Bedouin tribes across Saudi Arabia; it started in the early 20th century (Al-Mubarak, Reference Al-Mubarak1999). Some of the Bedouins had settled in smaller villages (called locally hijar) for some time before resettling in Ar Rass. Some respondents informed me that almost half the population of Ar Rass today is not descended from its original families; rather, it is mainly Bedouin settlers. It is not surprising, therefore, that the current speech patterns of Ar Rass residents have been influenced by frequent interactions with and contacts with newly settled Bedouins. Interestingly, most Bedouin labels describing the speech of Ar Rass residents were assigned by respondents from other cities, especially neighboring ones. All of the respondents from Ar Rass insisted that they have not assimilated any Bedouin linguistic features; rather, they asserted that they are the ones who have influenced the speech of Bedouin settlers.
5.5.2 Ha’il dialect
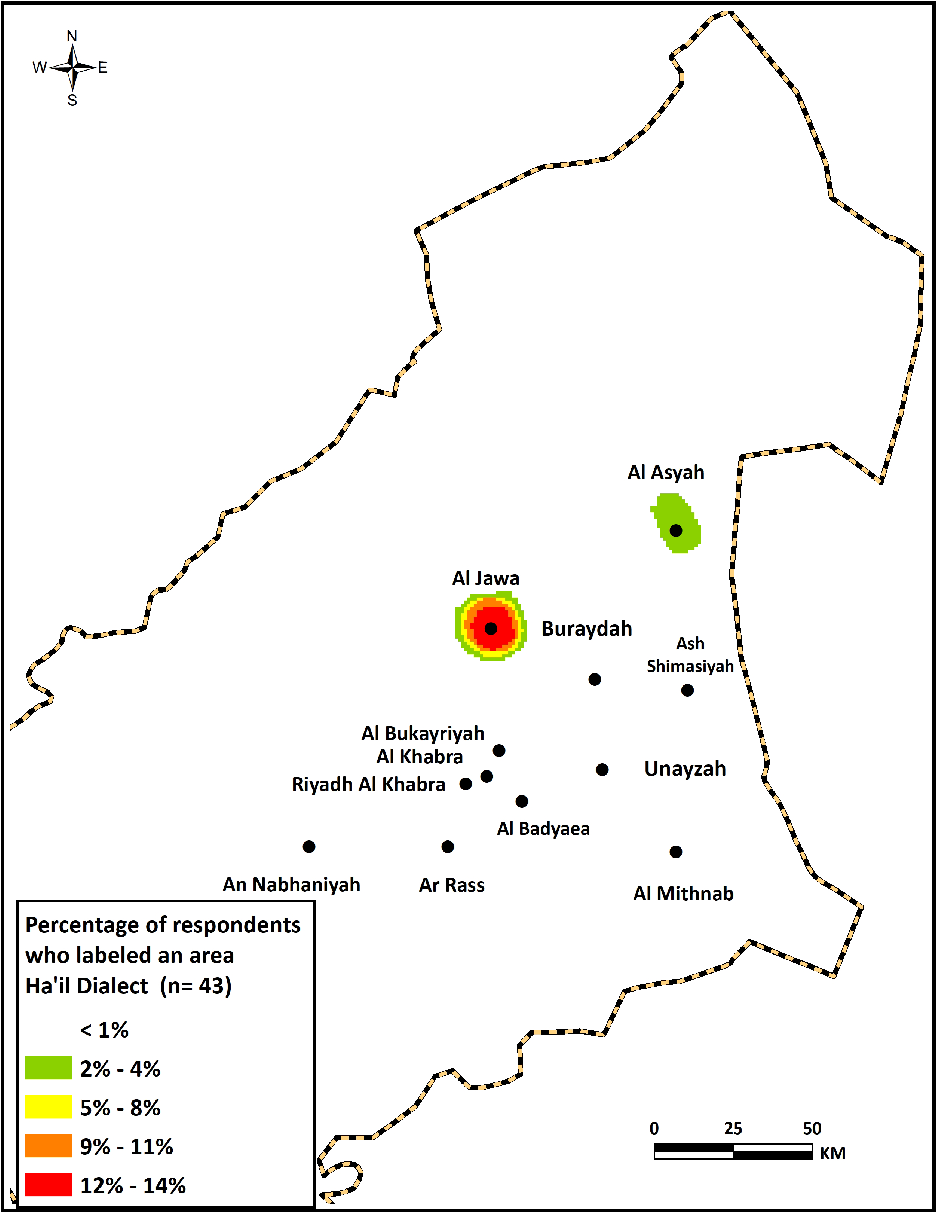
Some respondents identified certain dialect areas as being influenced by the Ha’il dialect (n=43). Different keywords were used as labels, including influenced by Ha’il dialect, got Ha’il accent, a bit different, sound more like Ha’il people, and influenced by the North dialects, particularly Ha’il. Some respondents gave accurate descriptions of the linguistic features they perceived as being influenced by the Ha’il dialect. One respondent, for instance, noted about the Al Jawa dialect that “They add /y/ sound to the preposition min, and often pronounce words with fatha /a/ sound, as in shlunkam (how are you?).”
Map 12 shows that Al Jawa is clearly the most frequently identified area of Ha’il influence, followed by Al Asyah. Most of the respondents’ comments were linked to differences in pronunciation and the use of peculiar lexical items that are not typically used in QA. These labels seem logical given the geographical location of the two areas; they were the areas nearest to the Ha’il province and, therefore, the perceived borders of QA speech, in the north; one can understand how speakers might have been influenced by northern dialects.
In Al Jawa, the influence by the Ha’il dialect is so salient that some researchers have classified Al Jawa as not being part of the region where QA is spoken. Al Jumaah (Reference Al Jumaah2017:43-44), for example, excluded Al Jawa from the QA dialect area on the basis that its speakers exhibit certain linguistic features not commonly heard in other cities and villages in Qassim. The similarities between the Al Jawa and Ha’il dialects remain limited, however; speech in Al Jawa has many features in common with QA, including the most prominent features of QA (Al-Ubudi, Reference Al-Ubudi1979). Besides, the current residents of Al Jawa did not migrate in the past from the Ha’il province, nor are they tribally affiliated with the Shammar tribe, the prominent tribe in the Ha’il province with which the Ha’il dialect is commonly associated. The respondents’ perceptions apparently were affected by two factors: the geographical location of Al Jawa between Qassim and Ha’il; and the fact that Al Jawa is known for its small homogeneous society with tightly knit personal ties and loyalties (Al-Ubudi, Reference Al-Ubudi1979:1783), which have contributed to the retention of peculiar linguistic forms.
Composite map of dialect areas labeled as being influenced by the Ha’il dialect.

5.5.3 Riyadh dialect
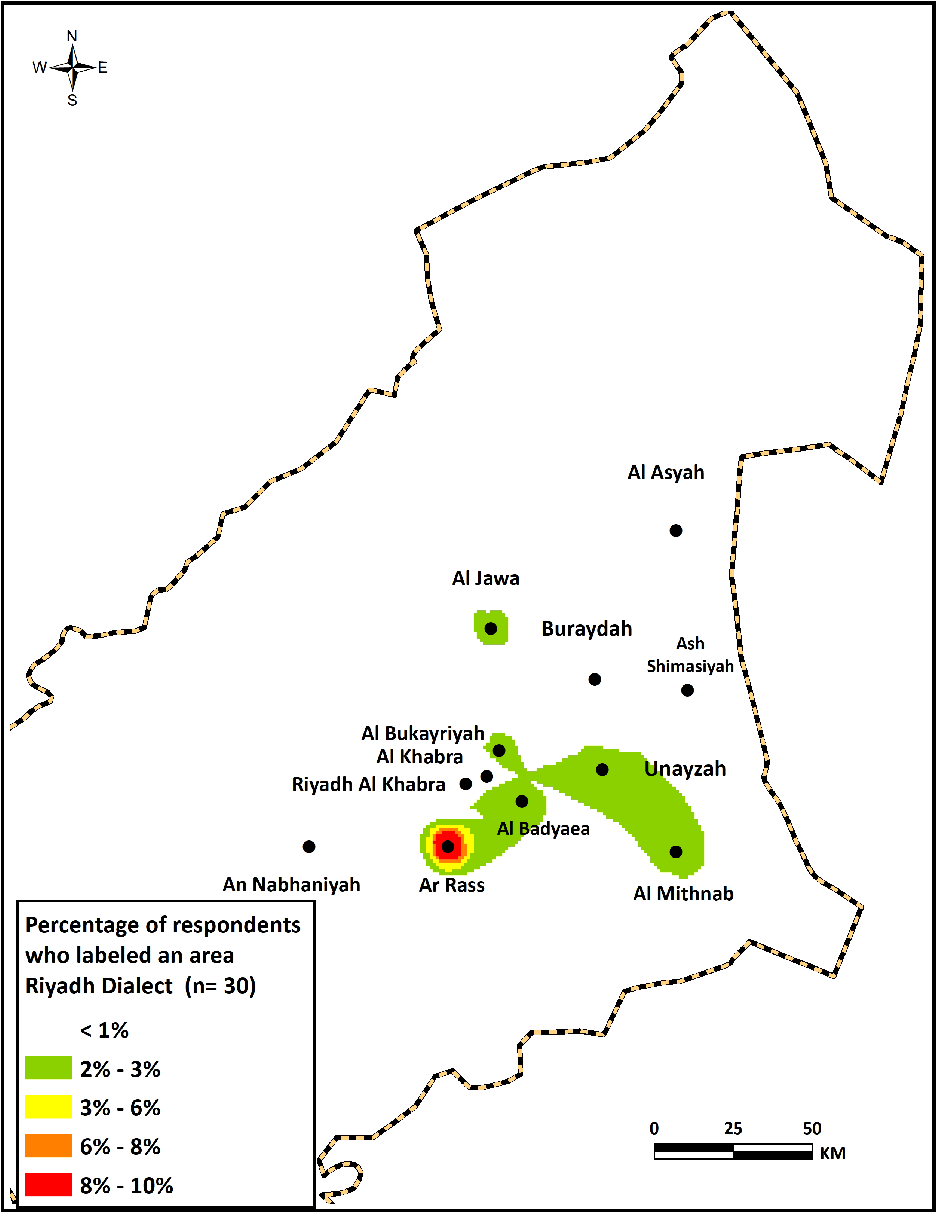
The third and least frequently identified type of influence was the Riyadh dialect (n=30). Examples of the respondents’ labels include influenced by Riyadh dialect, they don’t change the pronunciation of k and g, just like Riyadh people, and they use words similar to what Riyadh people use. As shown in Map 13, the area most frequently perceived as being influenced by the Riyadh dialect is Ar Rass. This perception may be surprising, considering how far Ar Rass is from Riyadh (over 450 km), as well as considering the finding that there is no such similar influence on other dialect areas in Qassim. I asked some respondents from Ar Rass about this recurrent perception, and they admitted that some people may have it, but they attributed it to two factors. First, there are many families from Ar Rass who migrated to live and work in Riyadh in past years, and some have returned to their hometown after retirement. The dialect of these retirees, as well as their family members, apparently has been influenced by the Riyadh dialect; this is especially true of some salient features, such as not affricating /k/ and /g/, using the preposition /fi/ instead /bi/, and using some lexical items commonly used in the Riyadh dialect. Second, there are certain families that have strong ties with families from Riyadh through marriages and frequent social contacts, and, consequently, their dialects have been influenced by the Riyadh dialect. According to one respondent, “Many people from other cities in Qassim assume an influence of Riyadh dialect on the speech of people from Ar Rass after their contact with members from these families.” He added that “The number of these influenced speakers remains limited, and they do not represent the majority of people in Ar Rass.”
It is noteworthy to point out that the respondents’ identification of an influence of the Riyadh dialect suggests that they have detected subtle differences in various linguistic features in the Ar Rass dialect. These influenced features cannot just be linked to the processes of regional dialect leveling, as reported in previous studies. Al Rojaie (Reference Al-Rojaie2013), for example, reported a shift toward the use of the supralocal [k] variant associated with the Riyadh dialect, particularly in the speech of younger and middle-aged female speakers from Buraydah.
Composite map of dialect areas labeled as being influenced by the Riyadh dialect.

5.6 Fast
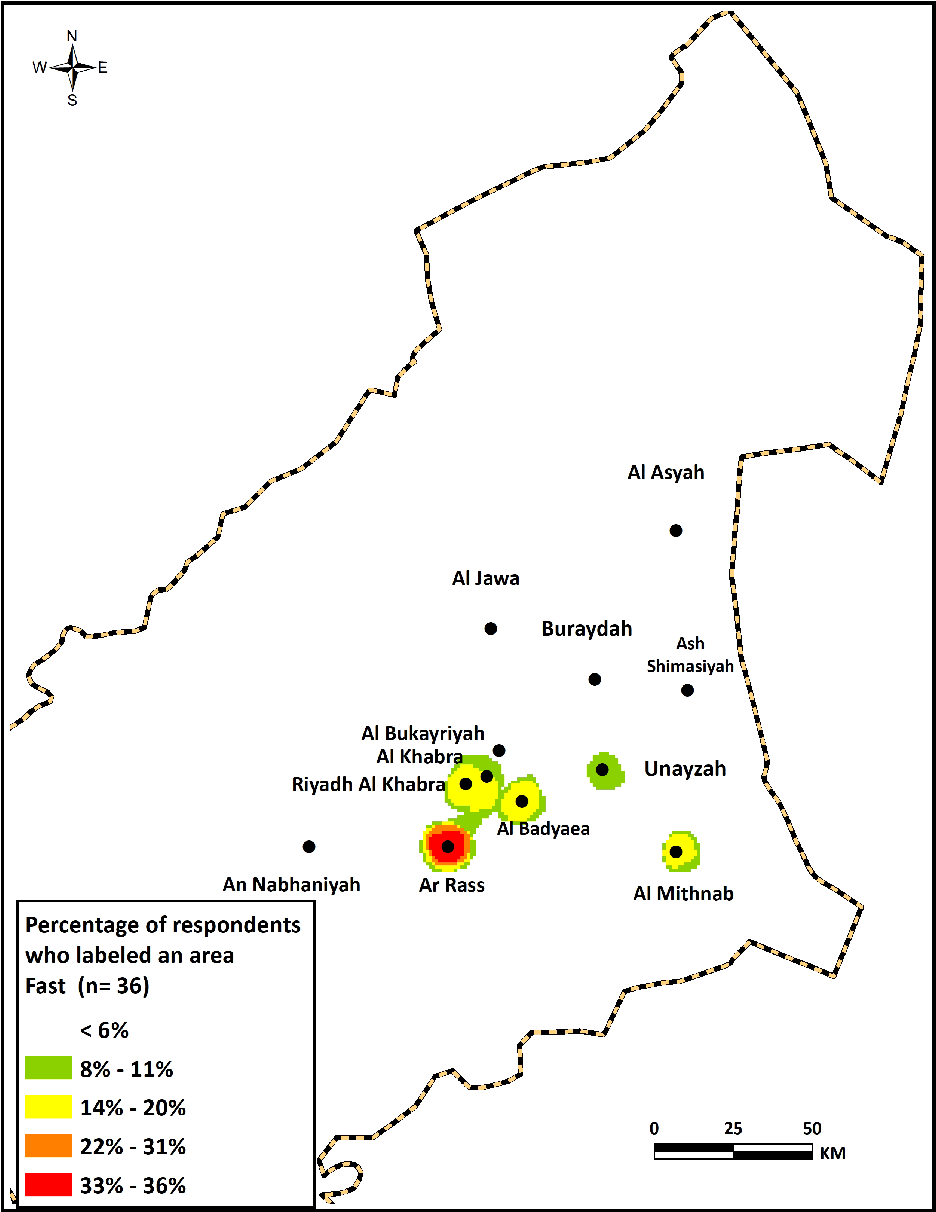
The category label, fast, was applied in a relatively low number of comments (n=36). It describes how fast some persons speak in certain dialect areas. It was an unexpected finding, given the salient perceptions of drawl and slow speech frequently identified in some dialect areas. These perceptions were limited to some different dialect areas in Qassim.
Frequent words and phrases used to describe this feature were fast, always at high speed, they speak extremely fast, swift, and the fastest in Qassim. One respondent described the speech of Ar Rass as that in which “some people speak very fast, to the extent that you don’t understand sometimes all what they say.” Similar words and phrases were used for the dialect areas of Al Mithnab and Mid-Qassim, particularly Al Badayea, although they were used less often.
Analysis of the maps, as displayed in Map 14, indicates clearly that the majority of respondents associated fast speech with the Ar Rass area. This finding, together with earlier results for slow speech, suggests a pattern in which fast speech is frequently perceived in the dialect areas of Ar Rass, Mid-Qassim, and Al Mithnab, respectively, whereas slow speech is more often linked to the dialect areas of Buraydah and Al Khuboob.
Composite map of dialect areas having been labeled as fast.

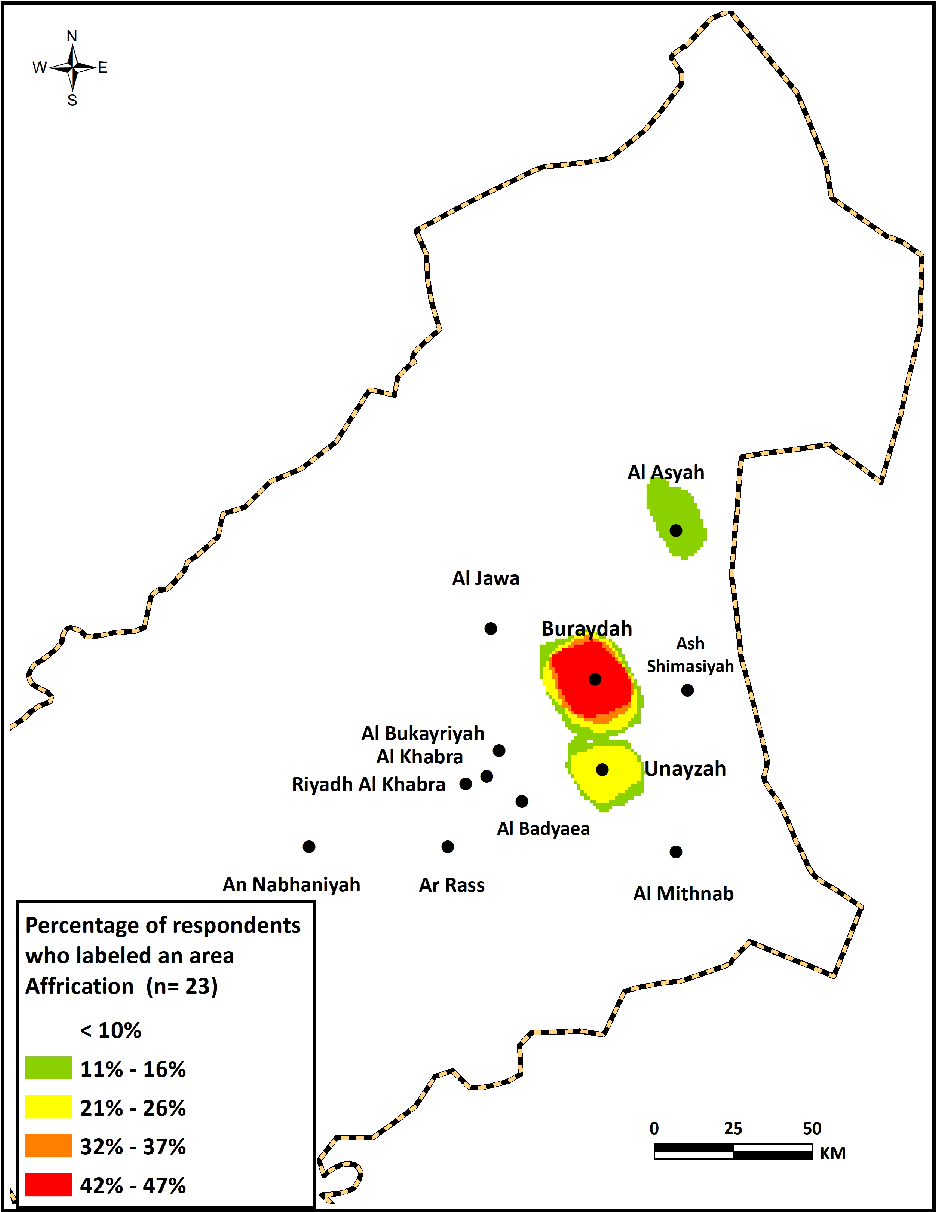
5.7 Affrication
The last category label, affrication, was the feature least often identified by all of the respondents (n=23). As stated above, it refers to the phonological process of replacing the sounds /k/ and /g/ with the affricated variants [] and [], respectively. It is a common feature of Najdi Arabic and of QA in particular. Frequent words and phrases used to describe this feature include ts sout “[ts] sound” and galb k li ts “replacing [k] with [ts].” Some respondents also used kaskasa, which is the linguistic term used by medieval Arabic grammarians to describe this feature.
Although affrication is a feature that is salient and widely used by most QA speakers, some respondents apparently associated it with certain dialect areas of QA more than other areas. As illustrated in Map 15, affrication was most frequently identified with the areas in Buraydah, followed by the areas in Unayzah. Further examination of the results indicates that 12 out of 23 labels (or 52% of all labels) were used by respondents from Buraydah in describing their own dialect. This may reflect the importance of this feature for Buraydah respondents in characterizing their own speech, and it can be linked with their negative evaluations of it as a marker of provinciality and old-fashioned speech, as indicated by Al-Rojaie (Reference Al-Rojaie2013). This explanation, together with the finding that relatively few labels were assigned for it, may lead us to suggest that the perceived identification of affrication as being associated with the speech of the Buraydah and Unayzah areas does not reflect actual differences among QA speakers in using this feature. Rather, it is the result of differences in the respondents’ evaluations of their own speech and the social meaning connected with it. Further examination is needed to determine whether there are variations in the use of affrication among QA speakers at both the production and perceptual levels.
Composite map of dialect areas having been labeled as Affrication.

6. Conclusion
This study has provided a detailed account of perceptual dialectology in Qassim. It has documented the language attitudes and ideologies that QA speakers hold about linguistic differences in their own dialects. The methods of perceptual dialectology used in this work have provided extensive, valuable insights about QA. For instance, this study has mapped the ideologically constructed spatial boundaries of linguistic differences that respondents perceive in QA, a dialect widely thought by people living outside of Qassim as being one entity with almost no variation.
The adoption of GIS in analyzing the current PD data has been effective for better visualization and analysis of the results. It has enabled the researcher to aggregate the data and perform statistical analyses on the same map. Such analyses would not be possible if traditional methods were employed.
There are still avenues for further investigation about perceptions of linguistic variation in QA, however. It would be fruitful, for example, to see whether residents of Qassim who do not speak QA, particularly tribal dialect speakers, have the same or different perceptions of and saliency ratings for dialect areas compared with the speakers surveyed for our present study. Another avenue that merits further investigation concerns the effect of some social factors, such as age, gender, and social mobility, on the respondents’ perceptions. The investigation of such factors is needed, given the rapid urbanization and drastic social changes that Saudi Arabia has undergone in recent decades, and which together may have an effect in this particular context.
It would be valuable in future studies to narrow the focus on spatial features by examining the perceptual dialectology in smaller areas, such as urban centers, villages, or even neighborhoods. Some respondents informed me that there are two local varieties spoken in Buraydah, the regional capital: one in the northern neighborhoods and the other in the southern neighborhoods, and that each of these local varieties is labeled by certain social values and spoken by different social groups. Such comments certainly deserve further examination. One final future avenue is to examine certain perceptual labels identified in our study, such as heavy drawl and soft drawl, within their perceived urban centers (i.e., Buraydah and Unayzah), in order to better understand language variation in perceiving such labels and how they are related to local ideologies.
Appendix A
Map survey instrument