The European sovereign debt crisis continues to hold Europe and the world captive. Scholars and practitioners commonly call for a reform of the rules for fiscal governance in the eurozone. The current framework is defined by the Stability and Growth Pact (SGP) that applies to all European Union (EU) member states, which limits government debt to 60 percent of a country’s gross domestic product (GDP) and prohibits a country from running deficits larger than 3 percent of its GDP. Although the SGP formally establishes two criteria for ensuring fiscal discipline, decisions on euro membership and noncompliance followed only the pact’s deficit criterion.Footnote 1 However, ever since Germany’s Chancellor Gerhard Schröder and France’s President Jacques Chirac successfully watered down compliance with the deficit criterion in the beginning of the 2000s, skepticism about the effectiveness of fiscal governance for euro members is growing. From late 2009, fears about the sustainability of government debt exacerbated the European sovereign debt crisis, in which Greece required assistance from third parties to service its debt.
As the euro is a ‘currency without a state,’ the European sovereign debt crisis differs from the situation in other currency areas, in which the financial markets continue to have confidence in fiscal governance (EIU 2011, 4). Initially, the euro countries were ‘sharing’ credibility when they introduced the euro in 1999, with the effect that some former high-inflation countries experienced significantly lower interest rates, which eased governmental spending constraints. This promoted government debt making without reforming the underlying structural conditions, which culminated in the 2007 economic crisis. This crisis revealed the euro’s moral hazard problem that, according to De Grauwe (Reference De Grauwe2008, 7), “will exist as long as the nation-states maintain their sovereignty over spending and taxation, and as long as those who decide about spending are made accountable before a national electorate.” Today the euro countries experience an increasing variation in government debt, with speculations about a break-up of the euro. This further promotes skepticism about the eurozone’s fiscal governance, with the result of higher interest rates for euro countries than non-euro counties with comparable debt levels like Japan, the United States and the United Kingdom (EIU 2011).
The political consequences of the European sovereign debt crisis are particularly severe for the euro countries Greece, Portugal and Ireland, which came under control of the Troika.Footnote 2 While these countries need to make enormous efforts to reform their structural conditions under the Troika’s supervision, the more recent development in the larger euro countries Italy and Spain is increasing the worries about the future of the euro. One reason is that a further increase in interest rates of Italy and Spain threatens their ability to service their debt from banks and borrowers, and their impact on the currency is much larger. A second reason is that the European Central Bank (ECB) started to intervene by buying governmental bonds when these countries ran into trouble—an activity that may aggravate the moral hazard problem in the eurozone and raise further skepticism about its fiscal governance. To systematically assess the effectiveness of fiscal governance in the euro countries, we need to ask whether the current situation would have been different if they had kept their national currencies.
Our study of the relationship between the introduction of the euro and the working of the SGP examines the effectiveness of fiscal governance in the euro countries. Compared to the general focus on the SGP’s deficit criterion, we investigate this effectiveness in the context of government debt, which did not play a major role until the emergence of the European sovereign debt crisis in 2009. Because the debt criterion was important for decisions on neither euro membership nor noncompliance with the SGP, we believe that debt is a more reliable indicator than deficit for estimating the effects of fiscal governance. To assess to what degree the SGP affected government debt in the euro countries, we propose a quasi-experimental approach that considers the introduction of the euro as a policy experiment. We exploit this to empirically examine the effectiveness of the SGP for the development of government debt before and after the introduction of the euro in 1999.
Key is the estimation of the counterfactual development of government debt for the euro members in a scenario without the introduction of the euro, which we derive from the development of other corresponding Organisation for Economic Co-operation and Development (OECD) countries. In a first step, we need to statistically evaluate the factors for government debt. In the second step, we construct the counterfactual development by the corresponding group of non-euro countries to evaluate the effectiveness of fiscal governance by comparing these estimates to the observed debt data of the euro countries. We will thereby rely on the synthetic control approach developed by Abadie, Diamond and Hainmueller (Reference Abadie, Diamond and Hainmueller2010).Footnote 3 We discuss how this approach can improve our understanding of fiscal governance in the euro countries and help us identify how to reform the mechanism to cope with future challenges in fiscal governance.
Even though the SGP was violated several times, we argue that it may sound ‘institutional alarms’ (Chaudoin 2013) on governmental fiscal performance, which are likely to constrain government debt making in those countries in which audience costs for noncompliance are high. This mechanism may overcome a moral hazard problem and explain why political leaders in Germany and France were so eager to prevent the opening of a deficit procedure against them. While all EU countries are formally bound by the SGP, only those that have introduced the euro are exposed to the moral hazard problem and are potentially affected by these alarms. We thus expect that noncompliance costs affect fiscal governance only in euro countries, but differently, which we operationalize by distinguishing donor from recipient euro countries.
Our analysis reveals that, in contrast to conventional wisdom, the overall effect for the euro countries (including Greece) is negative. In other words, the aggregate level of government debt in the euro countries today would be higher without the introduction of the euro. Overall, fiscal governance seems to work better with the euro than is commonly perceived. On closer inspection, however, we find that this effect is driven by lower debt levels in the richer donor countries from middle and Northern Europe, while the evidence on the poorer recipient Southern European countries is mixed. In most of these countries, the level of government debt would indeed be lower without the euro, while Ireland and Spain reveal a more promising development.
The results suggest that reform is needed to cope with the country-specific effects of fiscal governance. In our view, it is necessary to introduce a more sophisticated mechanism that specifically targets the incentives of large euro members with high government debt to comply. In some of these countries, sounding an institutional alarm is insufficient to prevent a government from ignoring its (high) level of debt. Our findings recommend a more nuanced interpretation of fiscal governance in the eurozone by studying the mechanism’s effectiveness for donor and recipient countries in more detail.
The remainder of the article is structured as follows. We first discuss the general framework of the SGP and the development of debt and deficits in the eurozone. Secondly, we justify our choice of government debt and the measures used for assessing fiscal governance before we show how we can exploit the quasi-experimental structure to estimate the effect of introducing the euro on debt levels in the eurozone. Finally, we use several aggregates and individual cases to qualify our findings and to test their robustness.
The Euro as a Policy Shock for Fiscal Governance—Ex Ante and Ex Post Development
On 1 January 1999, the euro was introduced as the common currency of 11 countries.Footnote 4 From this day onward, the stock of government debt of these countries was converted to euros and new debt was exclusively issued in the common currency. Politically most important, the euro countries lost authority over their monetary policy by transferring this authority to the ECB (Hallerberg Reference Hallerberg2002). The introduction of the euro can thus be seen as a policy experiment that altered the conditions for the euro countries, both in terms of monetary and fiscal policy.
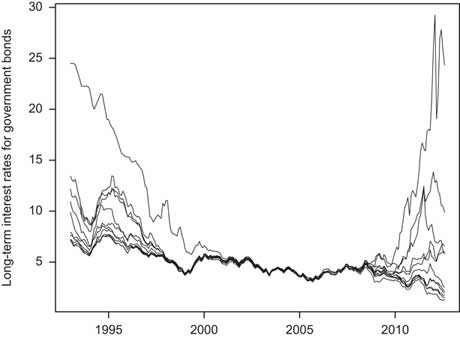
The introduction of the common currency, in combination with the ECB’s restrictive monetary policy, increased the lending credibility of many euro countries early on. The SGP also signaled the commitment to pursuing sound fiscal policies in those countries. In return, many euro countries experienced historically low interest rates for government bonds. Former high-inflation (mainly Southern European) countries quickly converged to interest rate levels that only low-inflation countries like Germany had previously enjoyed. Countries like Greece, Portugal and Spain thus benefited from the promise to follow the “German price stability-primacy” by the (initial) trust of financial markets of euro countries’ fiscal governance. This development is visible from the time-series plot of the long-term interest rates for government bonds in the Euro11 countries provided in Figure 1.
Time series plot of the long-term interest rates for government bonds in the euro 11 Note: monthly data. Source: ECB
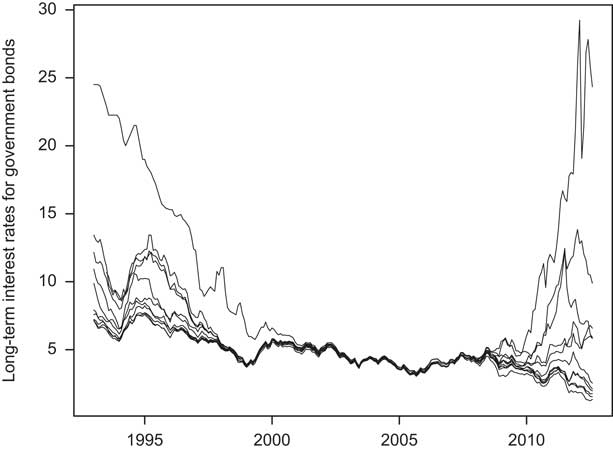
The convergence in interest rates, which is evident from the end of the 1990s and the sharp divergence from 2007 onward, corresponds to the introduction of the euro. Today, the level of interest rates for Greece, Italy and Portugal are close to pre-euro levels, which threatens their ability to refinance debt. In response, the EU adopted the European Financial Stability Facility and the European Stability Mechanism—developments that are raising serious concerns in countries like Germany, which is financing the largest part of this system.
Because the initial interest rates on government bonds did not account for the difference in the country-specific structural conditions and risks, De Grauwe (Reference De Grauwe2012) argues that this contributed to the European sovereign debt crisis. For Baumgarten and Klodt (Reference Baumgarten and Klodt2010), the low interest rates promoted higher governmental expenditure and, in cases of stagnating growth due to the underlying structural conditions, higher levels of debt in the following years. This view is supported by other variables, which were similarly affected by the introduction of the euro. For example, Bernoth, von Hagen and Schuknecht (Reference Bernoth, von Hagen and Schuknecht2012) show that euro countries paid lower default risk premia. Hallerberg and Wolff (Reference Hallerberg and Wolff2008) replicate this analysis and find that this is only true if institutions are neglected. Since fiscal governance does not yet coordinate fiscal and macroeconomic policies in the euro countries, their divergence increased. This suggests that the euro countries will be unable to overcome the European sovereign debt crisis without political union. The moral hazard problem, created by externalities following the adoption of the euro, continues to dominate the responses to the crisis. However, as risk premia are found to respond positively to increases in government debt within the euro countries (Schuknecht, von Hagen and Wolswijk Reference Schuknecht, von Hagen and Wolswijk2009), a more solid empirical investigation is warranted.
It is widely believed that the excessive government debt in the euro countries has been created by the introduction of a monetary union without a fiscal union. With respect to the debt development of euro members, it is also claimed that this system of fiscal governance promotes incentives for prodigal countries to excessively increase their debt at the expense of more frugal countries. Since the euro countries kept their promise to run neither a deficit close to balance or in surplus, nor to bring debt levels below the threshold of 60 percent of GDP, the conclusion is that the SGP cannot effectively constrain government debt making (for example, Hallett and Hougaard Jensen Reference Hallett and Hougaard Jensen2012). This prompts the question of whether fiscal governance generally failed, or whether only some euro countries took advantage of their early credibility gains without reforming the structural conditions for their debt, which finally led to a similar divergence in interest rates and fiscal policy-making interests as before the introduction of the euro. Empirically, almost all countries—whether they introduced the euro or not—excessively increased their debt in the vein of the 2007 economic crisis.
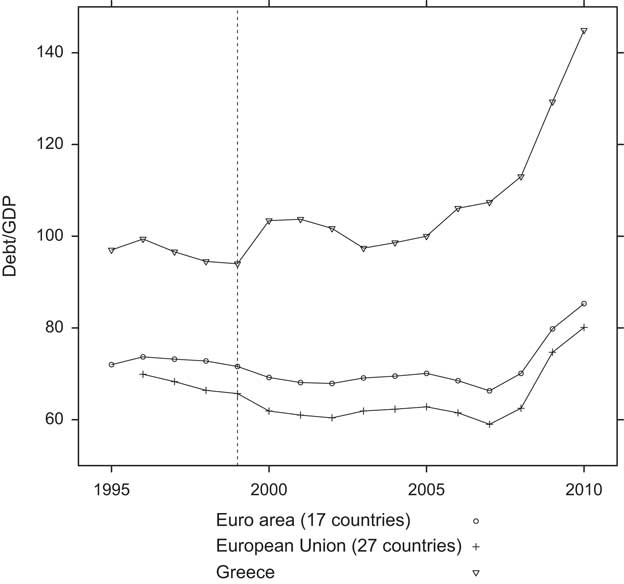
On closer inspection of the empirical foundation, the current discussion on fiscal governance in the euro countries is dominated by either case-by-case evidence about particular violations of the deficit criterion or a quick inspection of the current level of debt in the euro countries. For example, it is argued that euro countries accumulated more debt. However, a simple comparison of debt levels is insufficient to justify this conclusion. For example, Figure 2 shows the time series of the debt/GDP ratio for the 27 EU member states, the current 17 euro countries, as well as Greece since 1995.
Time series plot of the debt/GDP ratio for selected aggregates
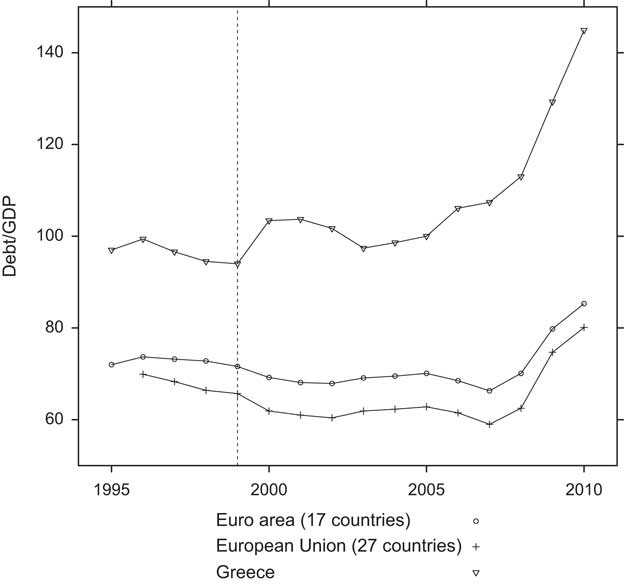
Compared to the EU as a whole, the 17 euro countries indeed show a higher average debt-to-GDP ratio. However, the levels of government debt in the euro countries were higher throughout the whole period, including before the euro was introduced in 1999. Since the development of the averages is rather parallel, it might be misleading to attribute the current level of government debt in the euro countries to the introduction of the euro with its fiscal governance by the SGP. In order to assess causality, we need to ask whether the level of debt of the euro countries would have been different if they had kept their national currencies.
Fiscal Governance with a Common Currency: the Stability and Growth Pact
The introduction of a common currency in 11 countries was a politically and historically important event in 1999, which fundamentally changed the conditions for these euro countries and their relationship with non-euro EU members. Today, 17 countries use the euro as their common currency, and the outsiders remain co-decision makers about (any reform of) the system. The Delors report (Delors Reference Delors1989) defined the blueprint for this institutional setup, which was to a large degree inspired by the theory of optimum currency areas to tackle the problems arising from a monetary union without a fiscal union (Mundell Reference Mundell1961; McKinnon Reference McKinnon1963; Kenen Reference Kenen1969; De Grauwe Reference De Grauwe1999; Silva and Tenreyro Reference Silva and Tenreyro2010). Based on the Delors report, the treaty on the functioning of the EU introduced the so-called convergence criteria for fiscal governance. The countries are required to run a deficit of less than 3 percent of GDP over the medium term. They also committed to bring their debt-to-GDP ratios below 60 percent (Amtenbrink and De Haan Reference Amtenbrink and De Haan2003).
Mainly due to Germany’s insistence, the SGP became an agreement to maintain the stability of the euro and to limit moral hazard problems (Stone Reference Stone2011). It was outlined by two council regulations in July 1997. The first regulation (No. 1466/97) “on the strengthening of the surveillance of budgetary positions and the surveillance and coordination of economic policies,” known as the “preventive arm,” entered into force on 1 July 1998. It strengthened the monitoring of member states’ budget deficits by requiring eurozone members to have medium-term budget positions of close-to-balance or in surplus. This strengthens the 3 percent deficit criterion of the Maastricht Treaty, while allowing for short-run violations caused by asymmetric shocks (Artis and Buti Reference Artis and Buti2000). This close-to-balance or in-surplus provision can be interpreted as aiming at a 0 percent debt-to-GDP ratio in the long run (De Grauwe Reference De Grauwe2012, ch. 10).
The second regulation (No. 1467/97) “on speeding up and clarifying the implementation of the Excessive Deficit Procedure”, known as the “dissuasive arm,” entered into force on 1 January 1999. Based on articles 121 and 126 of the Treaty on the Functioning of the EU, it implements the EDP. These two regulations implement distinct forms of fiscal policy coordination: the former introduces an open method of fiscal coordination, while the latter is an example of a closed method of coordination (Amtenbrink and De Haan Reference Amtenbrink and De Haan2003). Compared to deficit, the debt ratio did not play an important role when 8 of the 11 euro countries effectively failed to comply with this criterion when they introduced the euro (among those Greece, Italy, Malta and Spain but also Austria, Belgium, Germany and the Netherlands). As their debt levels were considered to be declining at a reasonable pace, it was decided that they formally met the Maastricht criteria.
Under the multilateral surveillance procedure, eurozone members are required to regularly submit ‘stability programmes’ to the European Commission, while non-eurozone members issue ‘convergence programmes.’ Since the reform of the SGP in 2005, these programs also include the medium-term budgetary objectives of each member state and the measures required to attain these objectives. They are submitted to the council and the European Commission with an outline for four years, which is updated annually. The council may either endorse the program or ask for adjustments (Eijffinger and de Haan Reference Eijffinger and de Haan2000). If the report indicates a failure to run a deficit within the limits of the SGP, the council may issue an early warning sidelined by policy recommendations for the respective member state to the council.
The council may, but is not forced to, take additional measures under the EDP.Footnote 5 In the early 2000s this mechanism came under fire when the political leaders of Germany and France pressured the European Commission and the other members not to pursue their deficits, which is seen as the ‘original sin’ for the credibility of fiscal governance in the euro countries (Heipertz and Verdun Reference Heipertz and Verdun2010). From a legal point of view, the SGP’s surveillance mechanism is considered soft rather than hard lawFootnote 6 (Amtenbrink and De Haan Reference Amtenbrink and De Haan2003) and is seen to be too weak to enforce compliance (de Haan, Berger and Jensen Reference de Haan, Berger and Jensen2004). Others criticize the arbitrary (for example, Issing Reference Issing2008, 197f) or too strict (Buiter et al. Reference Buiter, Corsetti, Roubini, Repullo and Frankel1993) nature of the pact. Buti and van den Noord (Reference Buti and van den Noord2004) argue that a major problem is the asymmetry of rules that restrict pro-cyclical fiscal behavior in economic downswings but not upswings, which opens the door for electorally motivated fiscal policies. A final issue is the use of creative accounting to produce low ‘Maastricht deficits,’ thereby circumventing the working of the SGP framework (Buti, Nougeira Martins and Turrini Reference Buti, Nougeira Martins and Turrini2007). Buti, Nougeira Martins and Turrini suggest that a stronger focus on debt levels would help reduce deficits.
The economic crisis of 2007 put the system under even more strain. Developments in Greece, Portugal and Ireland undermined the trust of the financial markets in the sustainability of both debt in euro countries and the euro as a currency. The SGP’s inability to prevent government debt making during this crisis was seen as further proof of the ineffectiveness of fiscal governance in the euro countries. For example, Hallett and Hougaard Jensen (Reference Hallett and Hougaard Jensen2012, 646) claim that the SGP failed because it was widely ignored by the euro members. Schuknecht et al. (Reference Schuknecht, Moutot, Rother and Stark2011, 5) also concluded that “[t]he sovereign debt crisis in the euro area is a symptom of policy failures and deficiencies in-among other things-fiscal policy coordination.”
This view is supported by more recent empirical studies. Using a difference-in-differences approach to model the primary balanceFootnote 7 of countries, Ioannou and Stracca (Reference Ioannou and Stracca2011) do not find that the SGP had a significant effect. De Grauwe (Reference De Grauwe2008, 7) claims that “it can be concluded that the SGP is a fragile institutional construction that is unlikely to lead to its objective.” He attributes this effect to the accountability problem inherent in the setup of the SGP. Hallerberg, Strauch and von Hagen (Reference Hallerberg, Strauch and von Hagen2009, 178) summarize that “the data suggest that the process for fiscal consolidation that started with the Maastricht Treaty was rather unsuccessful.” Heipertz and Verdun (Reference Heipertz and Verdun2010, 113) critically stress that the proof of the pudding was in the eating. Like most scholars, they equate the effective working of the SGP with countries strictly obeying the rules.
However, a violation of the rules by some countries does not necessarily imply that the SGP does not effectively constrain fiscal policies in the eurozone. As Issing (Reference Issing2008) argued, the benefit of the 3 percent criterion for the deficit may not lie in its sound economic underpinning, but rather in providing a reference value. Although the SGP has been violated several times, it may sound an institutional alarm about governmental fiscal performance that triggers noncompliance costs (Chaudoin 2013). This signal about governmental performance may have different implications when the noncompliance costs differ by country. Although Portugal, France and Germany violated the SGP in the beginning of the 2000s, the German government in particular feared noncompliance costs and made enormous efforts to prevent the European Commission and other members from initiating a deficit procedure. The result may be a greater effort to comply with the fiscal rules in order to avoid such institutional alarms in the future.
These alarms may not only be triggered by violations of the deficit criterion but also by increasing debt levels. Compared to debt, violations of the deficit (and its development) suffer from the fact that medium-term requirements make individual violations hardly interpretable. In contrast to deficit, the alarms on debt are less noisy because debt is less easily manipulated by accounting tricks and reduces the endogeneity risk in the analysis of deficits, which have been the central criterion in the evaluation of fiscal governance since the introduction of the euro. Governments have used creative accounting to keep deficits in line with the SGP (von Hagen and Wolff Reference von Hagen and Wolff2006). These accounting tricks do not usually affect the debt level but reduce the deficit (Milesi-Ferretti Reference Milesi-Ferretti2003). To the extent that creative accounting is used, we should therefore see quite good compliance with the deficit criterion. At the same time, holding all variables constant, creative accounting should make it more likely that the debt level is increasing. The latter is therefore a strong indicator of actual fiscal behavior, and should be taken more seriously (Buti, Nougeira Martins and Turrini Reference Buti, Nougeira Martins and Turrini2007).
Since the debt level is an accumulation of deficits, there is a close connection between deficit and debt. This follows directly from the government’s budget constraint.Footnote 8 Whenever the nominal interest rate exceeds the nominal growth rate, the primary balance needs to be in surplus to guarantee the sustainability of debt (De Grauwe Reference De Grauwe2012, 213). A persistent deficit should ceteris paribus increase the level of debt, which is one of the rationales for restraining deficits in the eurozone.
Theoretically, the impact of introducing a common currency on debt is unclear. Some authors argue that a common currency increases the likelihood of higher debt, while others claim that it provide incentives to reduce debt.Footnote 9 This ambiguity in the alleged effect of a common currency on the debt level rests on the interest rate nexus. Lower interest rates should enable countries to reduce their debt level and mitigate the negative effects of a primary deficit. At the same time, lower interest rates imply cheap lending, which potentially leads to greater incentives to increase debt (Eijffinger and de Haan Reference Eijffinger and de Haan2000). One important aspect of a high debt level is the negative externalities that unsustainable debt imposes on the other euro members (De Grauwe Reference De Grauwe2012). It is therefore important to identify the effects of a common currency on the debt-to-GDP ratio if we want to assess the effectiveness of fiscal governance.
Measuring the Effects of Euro Membership
Fiscal governance in a monetary union is effective when member governments internalize the effects of their debt on the common inflation rate. The governments of the euro countries should thus prefer compliance with the SGP, as this enables them to collect the long-term benefits of a monetary union (Beetsma and Uhlig Reference Beetsma and Uhlig1999). While the SGP is also binding for the non-euro countries in the EU, the other countries do not share a common inflation rate and may therefore have different incentives for complying with the SGP. In particular, the noncompliance of outsiders may follow other—potentially opposing—demands; that is, a British government must hardly fear audience costs of noncompliance with the SGP. The expected effect of the SGP is thus conditional on adopting the euro.
We exploit this fact to estimate the impact of the SGP on the debt/GDP ratio of the euro countries—a criterion of fiscal governance that bears low endogeneity risk because it has been largely disregarded since the introduction of the euro in 1999. The standard framework for assessing such effects is the NeymanFootnote 10 framework (Imbens and Wooldridge Reference Imbens and Wooldridge2009), which conventionally distinguishes two research designs for empirical evaluations; it combines a case study (qualitative) design that applies counterfactual reasoning on an individual case with a regression-based design using other cases to identify the counterfactual in a quantitative manner (Fearon Reference Fearon1991).
For quantitative research, the difference-in-differences approach has become the standard method for assessing such effects in observational data. The major challenge for this approach is to identify an adequate control unit (Angrist and Pischke Reference Angrist and Pischke2009). In the following, we apply the synthetic control approach developed by Abadie, Diamond and Hainmueller (Reference Abadie, Diamond and Hainmueller2010) based on work by Abadie and Gardeazabal (Reference Abadie and Gardeazabal2003), which generalizes the difference-in-differences approach by offering a combination of the case study and regression designs to conduct quantitative case studies (Abadie, Diamond and Hainmueller Reference Abadie, Diamond and Hainmueller2010).
The synthetic control approach has been developed to evaluate policy effects in observational data from a comparative perspective. Abadie, Diamond and Hainmueller, for example, measure the effect of California’s tobacco control program on cigarette consumption (2010) and analyze the effect of German reunification on West Germany’s GDP (2012). Although the approach is rooted in the ideas of the Neyman framework of causality, a crucial notion is that a causal effect is the difference between (1) the outcome we observe after a treatment by a policy shock or intervention and (2) the outcome we would have observed without the treatment (counterfactual). The effect is then simply the difference between the counterfactual and the observed values (Shadish, Cook and Campbell Reference Shadish, Cook and Campbell2002, 5). Formally we can write this as:
 $$\alpha _{i} =Y_{i}^{I} \,{-}\,Y_{i}^{N} ,$$
where Y denotes the outcome and i indexes the unit. We indicate that a unit has received the treatment with a superscript I (or superscript N for non-treatment). Note that it is logically impossible to observe both states at the same time. This provides the hardest challenge for estimating causal effects.
The key to estimating a causal effect is thus to construct a counterfactual outcome as a benchmark in our quasi-experimental setting.Footnote 11 Accordingly, we conceive the introduction of the euro as a treatment, albeit one that countries select themselves into. We identify the policy shock as the start of the third stage of the monetary union on 1 January 1999, when the exchange rates between the euro members were fixed once and for all, and the interest rates that countries had to pay for government bonds were no longer determined individually. All electronic financial transactions were carried out in euros from 1999 onward, and countries had to comply with the Maastricht convergence criteria and the SGP.
Although we chose 1999 to signify the treatment period in our study (rather than 2002, when euro paper money was introduced), the approach allows us to check the robustness of this decision by estimating the performance of alternative years. The general idea of the synthetic control approach is simple; our description of the intuition and the method closely follows Abadie, Diamond and Hainmueller (Reference Abadie, Diamond and Hainmueller2010, 494f.).
First, a time series of the dependent variable of interest is given for a unit we may call 1. This unit could be a region, a country or an aggregate such as a group of countries. In our case, the debt/GDP ratio is the variable of interest. A requirement is that the time series comprises both some pre-treatment periods (indicated as periods 1 to T 0) and some post-treatment periods T 0+1 to T, where 1<T 0<T. T 0 is the period in which the policy shock or intervention (the treatment) takes place.
Second, we have to choose a convex combination of J untreated units (that is, countries that did not introduce the euro) indexed from 2,…, J+1, which minimizes the difference between the actual time series and the convex combination for the pre-treatment period. This is called the synthetic control group.
Third, under the assumption that the treatment does not affect the outcome prior to the intervention or any of the other units, the difference between the actual outcome and the extrapolation of the time series for the synthetic control group approximates the causal effect of the policy intervention on the dependent variable.
More formally, we denote the effect of the intervention for unit i at time t∈{1,…,T} as:
 $$\alpha _{{it}} =Y_{{it}}^{I} \,{-}\,Y_{{it}}^{N} ,$$
where the superscripts denote treatment (I) and no treatment (N). The ultimate goal is to estimate the causal effect a it . Note that the effect we are interested in also has a temporal dimension. Let D it be an indicator variable that denotes the treatment status of unit i in period t∈{1,…,T}. By definition, it must be true that:
 $$Y_{{it}} =Y_{{it}}^{N} \,{+}\,\alpha _{{it}} D_{{it}} .$$
The values for
 $$Y_{{it}}^{I} $$
are given. Thus in order to estimate a
it
, we need to estimate the counterfactual
 $$Y_{{it}}^{N} $$
. We model
 $$Y_{{it}}^{N} $$
using a factor model:
 $$Y_{{it}}^{N} =\delta _{t} \,{+}\,\theta _{t} Z_{i} \,{+}\,\it λ_{t} \mu _{i} \,{+}\,{\varepsilon}_{{it}} ,$$
where δ t is a time-dependent common factor with constant factor loadings across units, Z i is a (r×1) vector of observed covariates that are not affected by the intervention, θ t is a (1×r) vector of unknown parameters, λ t denotes a (1×F) vector of unobserved common factors and μ i denotes an (F×1) vector of unknown factor loadings. The ε it are transitory shocks (with zero mean) at the unit level. They are unobserved.
The goal is to estimate a (J×1) vector of weights W=(w 2,…,w J+1) according to:
 $$\mathop{\sum}\limits_{j\,=\,2}^{J\,{+}\,1} w_{j} Y_{{jt}} =\delta _{t} \,{+}\,\theta _{t} \mathop{\sum}\limits_{j\,=\,2}^{J\,{+}\,1} w_{j} Z_{j} \,{+}\,\mathop{\sum}\limits_{j\,=\,2}^{J\,{+}\,1} w_{j} \mu _{j} \mathop{\sum}\limits_{j\,=\,2}^{J\,{+}\,1} w_{j} {\varepsilon}_{{jt}} ,$$
such that the difference between the actual and synthetic outcomes is minimized for the pre-treatment periods. Abadie, Diamond and Hainmueller (Reference Abadie, Diamond and Hainmueller2010) show that the resulting
 $$\hat{\alpha }_{{1t}} =Y_{{1t}} \,{-}\,\mathop{\sum}\limits_{j\,=\,2}^J w_{j}^{{\ast}} Y_{{jt}} $$
is a consistent estimator of the causal effect a it for the periods t∈{T 0+1,…,T}.
Our dependent variable is the population-weighted average of the debt/GDP ratio for 11 of the 12 original euro countriesFootnote 12 (euro 11) for 1980–2010. The data availability for this time series has two implications for our study.
First, due to problems with data availability, we had to drop Luxembourg.Footnote 13 As the population weight of Luxembourg during the period of interest lies between of 0.0013 and 0.0016 this does not distort the calculations too much, despite the relatively low values of Luxembourg’s debt/GDP ratio. In fact, the potential bias would rather increase the effect we find. Thus using the euro 11 aggregation of the debt/GDP data would slightly underestimate the actual effect, making it a conservative estimation approach. Furthermore, Greece technically introduced the euro only in 2001. However, since it was preparing to introduce the euro, its exchange rate was tied to the euro from 1999–2001, which constitutes effectively the same treatment that the other members received. Because the consequences for the actions of the Greek government were similar to the ones the other members faced, we add Greece to assess the overall effects from 1999 onward.
Second, we use the data of Reinhart and Rogoff (Reference Reinhart and Rogoff2010), which offer the most comprehensive time series of central government debt data for the period of interest (1980–2010). The data were also used by Reinhart and Rogoff (Reference Reinhart and Rogoff2009) to analyze major financial crises from 1800 onward.Footnote 14 Reinhart and Rogoff have collected data on total gross central government debt from various sources, including the OECD, the World Bank’s Global Development Finance database, the UN Statistical Yearbook and national sources.
Although the rules of the SGP define government debt as general government debt, we use the Reinhart and Rogoff (2010) data. Data in accordance with the Maastricht definition are only available from 1995 onward.Footnote 15 The number of years available for calibrating the pre-treatment fit would be too short to yield reliable results. The correlation between central and general government debt in the period 1995–2010 for the euro 12 countries is 0.96.Footnote 16
We also decided to use the Reinhart and Rogoff (2010) data because data on general government debt are only available for EU member states. This would too severely reduce the set of countries available for modeling the synthetic control. We therefore use central government debt instead of general government debt.Footnote 17 We use a population-weighted average to calculate the aggregated debt/GDP ratio for the euro 11 countries. The population data are taken from the World Bank database. The procedure of aggregating the treated units is in line with the suggestions of Abadie, Diamond and Hainmueller (Reference Abadie, Diamond and Hainmueller2010, 494; Reference Abadie, Diamond and Hainmueller2012). We analyze an average treatment effect,Footnote 18 not an individual treatment effect, where:
 $$ATE=E[\alpha _{{it}} ]$$
is the expectation of the effect across units and time periods.
In a second step, we will distinguish two euro country groups of interest, donor and recipient countries, before we assess Greece as an individual unit. This distinction follows the idea that the evaluation of governmental performance and noncompliance costs is structurally different in poor and rich countries. One explanation is that it is of little surprise when a government fails to comply with fiscal rules in a poor country, while noncompliance costs might be substantial in rich countries. The recipient countries are those countries within the euro 11 that benefit the most from the structural funds: Greece, Portugal, Italy, Ireland and Spain. The rest constitute the donor countries: Germany, the Netherlands, Belgium, Finland, France and Austria. This is an important distinction, because the discussion about fiscal governance also centers on expanding this fiscal mechanism to cope with the problems at stake. We take a closer look at recipient countries and Greece to inspect variation in this group.
Although governments have to decide about the level of debt, these choices are largely conditional on economic developments. We thus use political and economic variables to model the synthetic euro 11, donor and recipient countries, as well as Greece. In contrast to a regression analysis, the variables used to estimate the counterfactual are not of direct interest with the synthetic control approach. All that matters is that they help model the pre-treatment outcome as accurately as possible. Although we choose most of the variables based on considerations in the literature, there are a few variables that we use only because they considerably improve the pre-treatment fit of our outcome variable. This also means that we do not make any claims about individual effects or causality for any of the variables we include in our estimation.
Political variables are widely used for the theoretical and empirical explanation of government debt (see, for example, Hallerberg, Strauch and von Hagen Reference Hallerberg, Strauch and von Hagen2009). For this purpose, we rely on data from the 2012 update of the World Bank database of political institutions (DPI),Footnote 19 which provides a comprehensive collection of variables that are important in this literature. The ideological position of the government potentially matters, as preferences regarding spending and taxation may influence the budgetary position. We use the measure by Potrafke (Reference Potrafke2009), who transforms data from the Comparative Manifestos Project to classify governments’ ideological positions.Footnote 20
Electoral competition should matter due to political business cycles. Governments are expected to spend more before an election in order to improve their re-election chances (Persson and Tabellini Reference Persson and Tabellini2000; Battaglini Reference Battaglini2011). Because there is empirical evidence for this phenomenon in the eurozone (Buti and van den Noord Reference Buti and van den Noord2004), we include two variables to capture this effect. First, we use a dummy variable that is coded 1 if it is an election year. Second, we take into account how many years are left in the current term. The number of veto players is another important political variable for more spending, as more veto players make it harder to change the structure of the budget or the trajectory of government debt (Tsebelis and Chang Reference Tsebelis and Chang2004; Bräuninger Reference Bräuninger2005). We use the POLCONIII variable from Henisz (Reference Henisz2002) to get a reliable measure.Footnote 21 We also use a dummy variable indicating unified government to investigate whether more homogeneous governments are less restricted in spending. Furthermore, Persson and Tabellini (Reference Persson and Tabellini2003) have shown that presidential regimes have smaller governments. This mechanism is mediated by the electoral system, so we include variables for proportional representation and plurality rules, which code the different types of systems. Finally, political fragmentation is also found to affect the budget position of governments (Roubini and Sachs Reference Roubini and Sachs1989; Volkerink and De Haan Reference Volkerink and De Haan2001; Perotti and Kontopoulos Reference Perotti and Kontopoulos2002; Elgie and McMenamin Reference Elgie and McMenamin2008). We use the Rae index of fractionalization which Elgie and McMenamin (Reference Elgie and McMenamin2008) use to analyze the effects of fractionalization in OECD and non-OECD countries. The index is constructed as 1−H g where H g is the Herfindahl index of government composition, which is taken from the DPI dataset. We also include the number of government seats as a fraction of total seats in parliament to measure the majority margin. This measure is also taken from the DPI dataset.
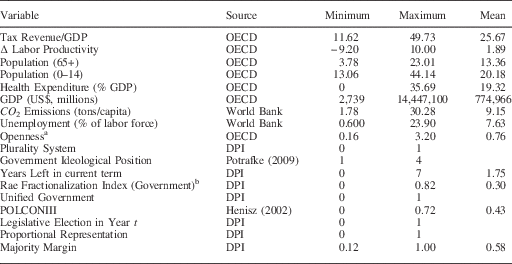
The economic variables are taken from the OECD and the World Bank databases. Table 1 gives an overview of the variables we use and their sources. Our economic variables comprise the percentage of children and retired people as a proxy for spending demands. GDP measures economic power, because stronger countries might have higher chances of acquiring debt. More open countries potentially face stronger asymmetric shocks, which might increase the need for fiscal measures to stabilize the country. Tax revenue is the complement of government debt in the sense that all governmental expenditure has to be financed by taxes or debt; its importance has been highlighted in Romer and Romer (Reference Romer and Romer2010). Unemployment potentially increases debt levels due to higher benefit payments and the fact that unemployment is usually higher during recessions, which should go hand in hand with increasing deficits. Because countries with high debt levels might be tempted to print money in order to finance the debt, the resulting inflation should help predict the level of debt. We also included the lag of the debt/GDP ratio. This is important, as the level of debt in a given year is not independent of the level of debt in the year before. We usually do not observe extreme jumps or reversals in the levels of debt, as changes are due to variations in the primary balance. Finally, we included health care spending as a percentage of GDP.
Variables Used to Construct the Counterfactual Euro 11 and their Sources

a Own calculation based on OECD data.
b Own calculations based data provided by the DPI database. The Rae fractionalization index is defined as one minus the Herfindahl index.
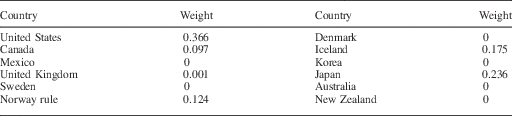
For the following applications, we select for each analysis those variables from the set of available variables that produce the best fit between the actual development of the debt/GDP ratio and its counterpart in the pre-treatment period, as suggested in Abadie, Diamond and Hainmueller (Reference Abadie, Diamond and Hainmueller2010). We thereby have to restrict the countries available to construct the synthetic counterfactual to 12. Table 2 shows these countries and their weights in the synthetic control group. Note that the countries as well as the variables receive a specific weight in all of the synthetic control studies.
Country Weights for Synthetic Control Unit

Note: Country weights smaller than 0.001 are indicated as 0.
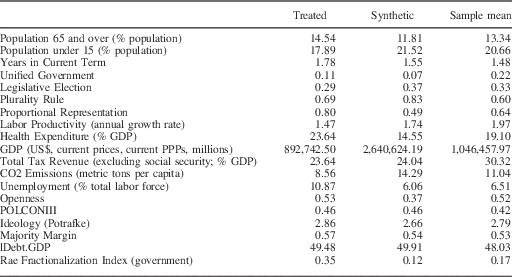
Restrictions are necessary due to problems in data availability and concerns about the similarity (and thus the comparability) of countries. For the synthetic control unit, only EU member states that have not adopted the euro are available, as the other member states are subject to the treatment we seek to measure. The 12 remaining countries are either EU or OECD members or both. From this sample of countries, only the United States, Canada, Norway, Iceland and Japan are used with a significant weight. The weight of the United States is the largest, followed by Japan and Iceland.Footnote 22 Table 3 gives an overview of the size of several independent variables for the synthetic control group and the actual values. For reasons of comparison, the sample mean is shown in the last column. For the variables with a significantly high weight, the values of the synthetic control group are closer to the true value than the sample mean. This suggests that the projections obtained from using the synthetic control method are better than simply using the mean.
Comparison of Values for Independent Variables (euro 11)

According to Table 3, the values between the euro 11 of the treated column are similar to those of the synthetic control group with weighted averages of the country values. Of particular importance is the similarity of values for those variables that have the highest weight in determining the dependent variable. These weights are shown in Table 4 in the Appendix. Tax revenue is the variable with the highest weight (0.51), followed by the lag of government debt (0.21). From the set of other variables, most political variables have significantly higher weights than the economic variables, for most of which the weights are much smaller than 0.01.
As the synthetic control method is a rather new approach, some points deserve further clarification. First, regarding our sample selection, one could argue that since the SGP is binding for all EU member states, they should face the same treatment. However, our argument is that the introduction of the euro constitutes a policy shock that affects the working of the SGP. Thus far, only the euro countries were treated effectively. This is corroborated by the fact that the non-euro members of the EU are not included in our synthetic control group. Second, the synthetic control method operates on a pure data basis. Theoretically, any variable that might help construct the counterfactual could be used. We use only variables that are recommended by the literature. However, we do not claim to test a general theory of government debt making in OECD countries. The weights used to construct the counterfactual are not equivalent to regression coefficients.
Results
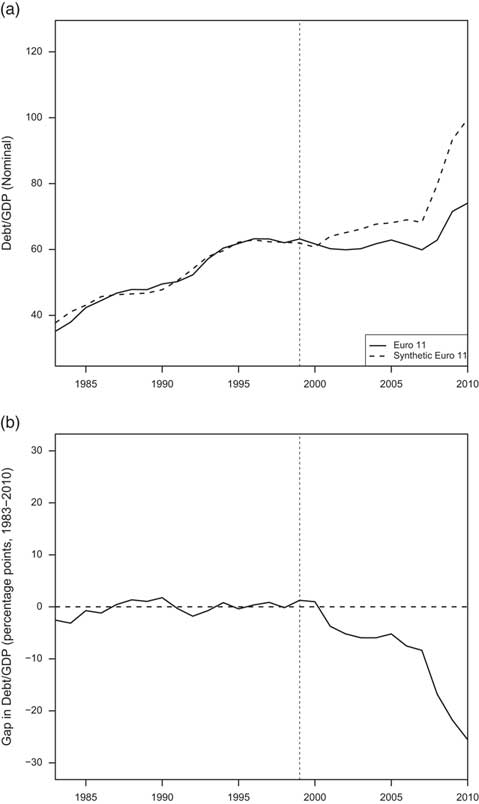
The results of the synthetic control analysisFootnote 23 for the euro 11 are plotted in Figure 3a. The solid line shows the time series of the debt/GDP ratio for the euro 11 group of countries. The dashed line illustrates the synthetic approximation (prior to 1999) and its extrapolation from 2000 onward. The curve for the synthetic control unit closely matches the development of the debt/GDP ratio in the pre-treatment period. This makes us confident that the extrapolation beyond the treatment period is a close approximation of the counterfactual we aim to measure.
Comparison of the euro 11 group of states and its synthetic counterpart (1983–2011)
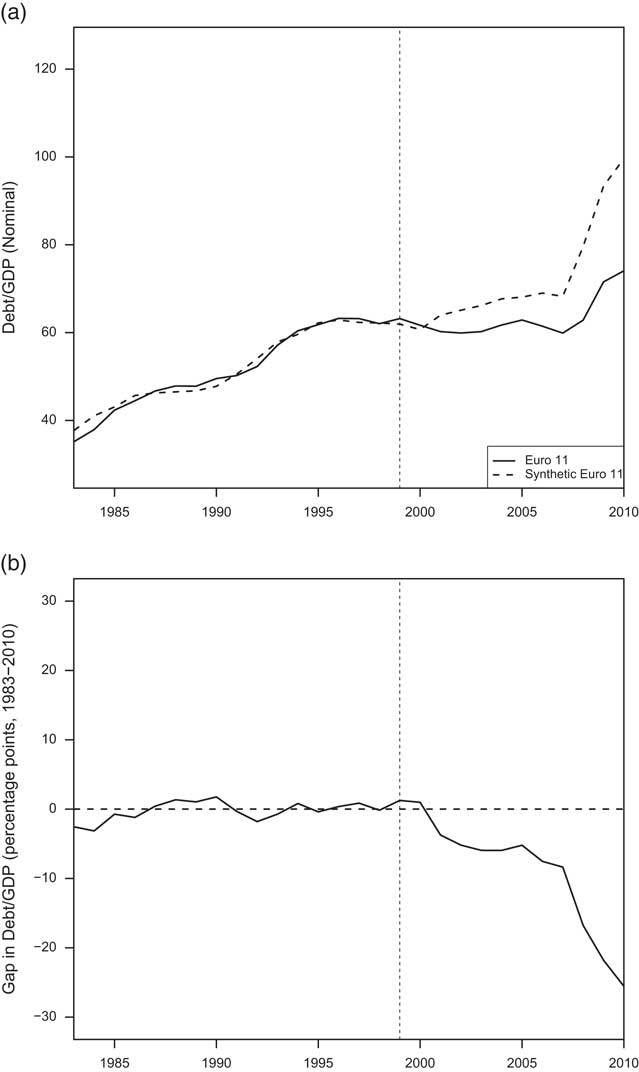
In 2000 the two curves start to diverge. The curve for the synthetic control unit lies constantly above the actual curve, and the difference is increasing over time. We thus predict that the average treatment effect of joining the euro is negative; that is, the levels of government debt are lower than they would have otherwise been. The effect is persistent, and seems to be accelerating rather than leveling out. Figure 3b shows the development of the difference between the two curves over time.Footnote 24
A potential problem is the self-selection of countries into the euro. Could it be that the results are driven by a selection of the best debt-performing countries into the euro? We think this is very unlikely, given that most countries did not comply with this criterion when introducing the euro. Since 8 out of 11 countries did not meet the 60 percent rule in the beginning, it is unlikely that they foresaw that this criterion would become important 10 years later in 2009. Moreover, a couple of non-euro EU member states are persistently performing better with regard to the SGP than many euro members do. Hence, we believe that the debt criterion is irrelevant for the decision to adopt the euro.
The difference increases to 16 percentage points in 2010. However, the data from 2007 onward have to be treated with care, as the economic crisis constitutes an asymmetric shock that affected the debt levels of all countries. As a consequence, our confidence in the accuracy of the counterfactual from 2007–08 onward is lower than for the period 2000–07. Nevertheless, the trend in the study period is clear and supports our argument on the working of the SGP since the introduction of the euro in 1999. While the maximum difference before the introduction of the euro in 1999 is 2.96 percentage points (in 1984), the maximum difference between the two curves is 27.77 percentage points in 2010. Even in 2007 the gap is already 8.59 percentage points.
Over time, the average effect is 2.52 percentage points per year. While at first sight this does not seem much, in fact it is. If we convert this result into monetary units, we see that, on average, the euro 11 countries would have increased their level of debt by USD 45 billion (euro 36 billionFootnote 25 ) more per year. The combined debt of the euro 11 in 2010 would thus have exceeded the actual level by approximately 397 billion euros, which is more than the 2010 level of Greece’s total debt (euro 357 billion). If we use 2007 to calculate the average effect in order to circumvent the potential problems of asymmetric shocks caused by the crisis, we still expect a yearly difference of euro 17.1 billion.
Our result clearly contradicts the conventional view that the SGP did not effectively constrain government debt making. While we observe multiple violations of the SGP rules by many euro countries following the ‘original sin’ of France and Germany, we find that the provisions still reduced debt levels in the aggregate. The debt/GDP ratio aggregated for the euro 11 would have been higher than it actually is. This is the consequence of a negative treatment effect. Admittedly, this effect may be lower than originally intended by the authors of the SGP, but the actual effects of the constraints are substantial. The SGP thus seems to be an effective ex ante mechanism that reduced the overall levels of debt in the euro countries.
However, as Hallerberg, Strauch and von Hagen (Reference Hallerberg, Strauch and von Hagen2009) have demonstrated, the aggregate view might mask individual differences. Close inspection of the development of the debt/GDP ratio within the original euro countries is given in Figure 8 (in the Appendix), which reveals that there is considerable variation in the development of the debt/GDP ratio between the euro countries. We therefore disaggregate the analysis by splitting the euro 11 into two subsamples and repeating the analysis.
Following our argument on institutional alarms, some countries may be more willing to adhere to the rules of fiscal governance due to different evaluations of noncompliance costs. As a proxy for those evaluations, we use the relative dependency on EU structural funds, which aim to mitigate differences in economic development between EU countries.Footnote 26 The overarching goal of the European Social Fund, the European Regional Development Fund (ERDF) and the newly created Cohesion Fund (CF) was harmonized with the introduction of the euro. The so-called Objective 1 is to foster economic convergence by reducing regional imbalances. This is important, as higher-equality economic development leads to a better synchronization of business cycles and potentially reduces the need for highly asymmetric fiscal policies. Regions with a GDP below 75 percent of the EU average are eligible for ERDF funding. This included most parts of Greece, Portugal and Ireland, as well as large parts of Spain and Italy in the funding period 2000–06. All EU member states whose gross national income is below 90 percent of the EU average are eligible for CF funding, including Portugal, Spain and Greece in 2000–13.
Based on this observation we divide the sample into donor countries and recipient countries.Footnote 27 For both groups of countries, we again aggregate the debt/GDP ratio using population weights. This procedure has advantages over the EU’s macroeconomic imbalances approach, because the latter only captures economic variables. The deficit (and thus debt levels), however, has a strong behavioral component, which is driven by governmental preferences.
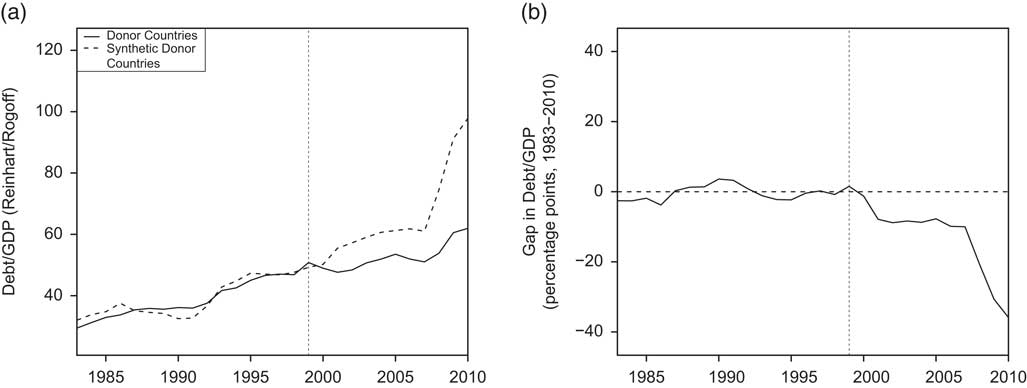
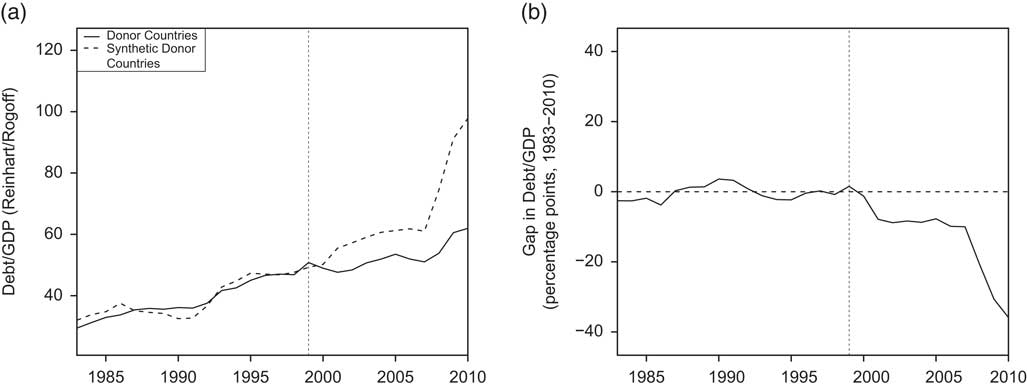
Figures 4a and 4b show the results of the analysis for the donor countries. A striking finding is that the synthetic control group again shows higher debt/GDP ratios for the synthetic control unit. That is, we find a negative effect on the debt/GDP ratio for the donor countries. As far as free riding, moral hazard and other problems are concerned, the SGP seems to effectively constrain the governments of these countries. After all, those countries are not directly punished by the markets with higher interest rates.
Comparison of the donor countries and their synthetic counterpart (1983–2010)
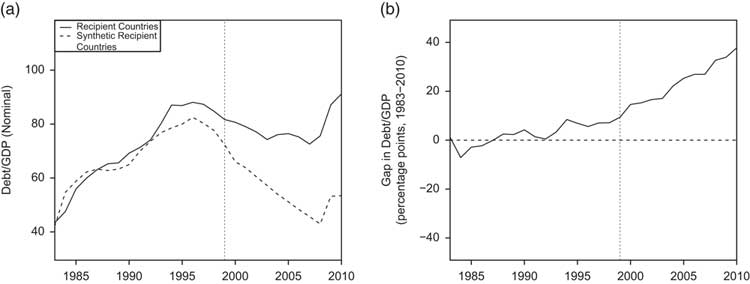
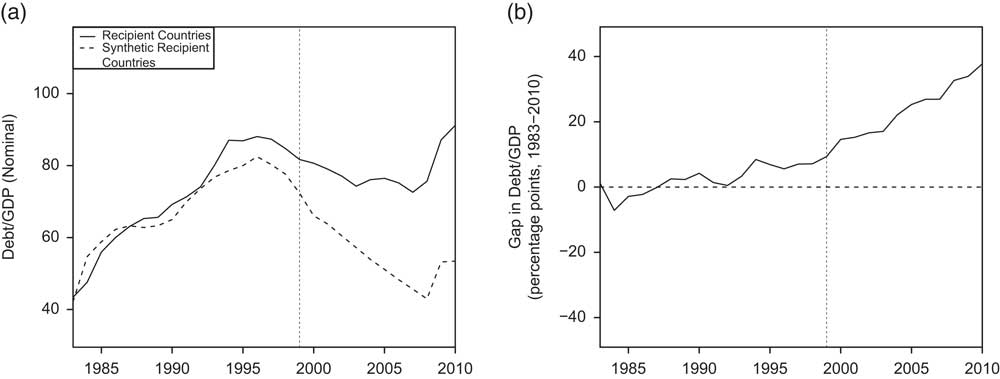
The picture is quite different for the recipient countries. Figures 5a and 5b show our estimates. The general fit of the synthetic control group is not as good as in the case of the donor countries, because Ireland, Italy and Greece already had quite high levels of debt in the pre-treatment period (especially in the early to mid-1990s). Thus it is harder to find a convex combination of non-treated countries in our sample that could closely approximate the pre-treatment curve. Inspecting the curve, we find that the general trend in the pre-treatment period until 2007 is slightly negative for the recipient countries. However, the treatment effect is generally positive for recipient countries. Without the introduction of the euro, their debt/GDP ratio would have been lower. Apparently, the SGP hardly works in countries that did not reduce their debt, which they would have done without the introduction of the euro. This finding supports the impression that fiscal governance is ineffective in countries that benefited from lower interest rates in the beginning. This suggests that institutional alarms do not communicate noncompliance costs in the expected manner because governmental (mis)performance in those poorer countries is evaluated differently.
Comparison of the recipient countries and their synthetic counterpart (1983–2010)
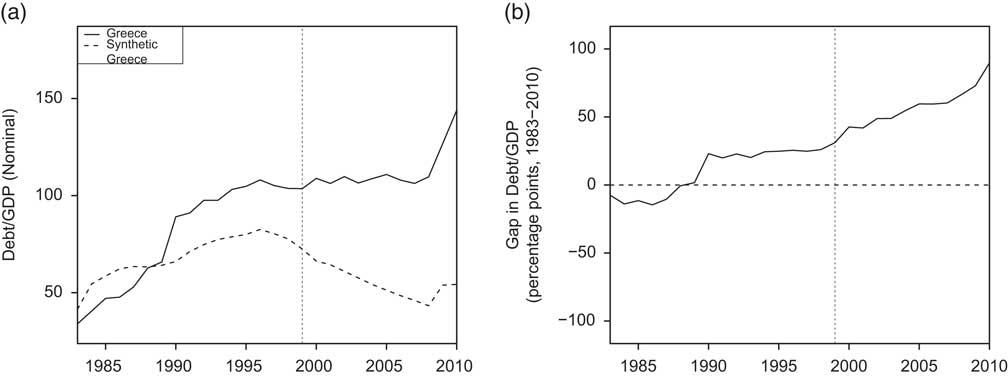
Comparison of Greece and its synthetic counterpart (1983–2010)
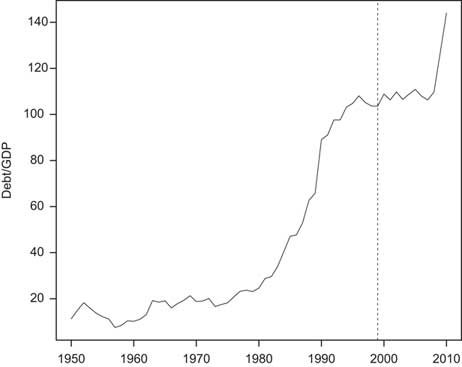
Greece’s debt GDP ratio (1950–2010)
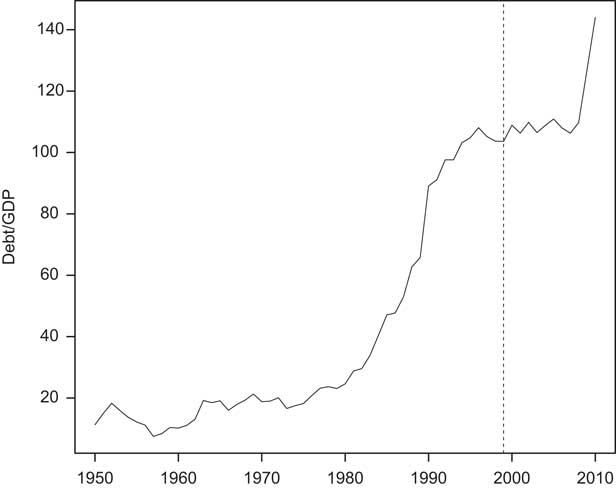
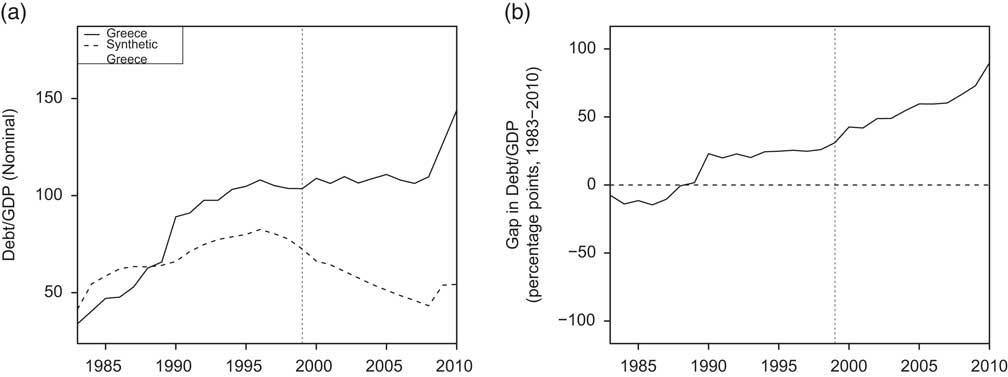
But what about the role of Greece? Is it driving the results of the recipient group? Although our approach is less appropriate for studying single (extreme) units, we disaggregate our analysis even more to provide further insights. Figures 6a and 6b show the results for Greece. Unsurprisingly, the fit of the actual development of Greece’s debt/GDP ratio and the counterfactual is rather poor. The problem in modeling the country’s development lies in the exceptional pattern of its long-term government debt, which is illustrated by Figure 7. The ratio is quite low until the beginning of the 1980s and starts to accelerate dramatically when Greece entered the EU in 1981. The debt kept on piling up until the end of the 1990s. Since then it has been relatively stable, with several minor ups and downs until the economic crisis hit in 2007. The development of debt in the 1980s and early 1990s is very exceptional, and therefore difficult to model as a convex combination of other countries with more moderate debt dynamics. But it also calls into question the notion of Greece’s debt levels being caused by the introduction of the euro. Rather, the pattern suggests that Greece’s debt exploded when the country joined the EU in 1981.
If, despite the relatively poor fit, one takes the results at face value, the conclusion is a positive effect for Greece. However, the fact that the gap between Greece and its synthetic counterpart is widening after the treatment should not be overinterpreted because Canada has a very high weight in the synthetic control group. It is thus mainly the result of Canada’s negative trend in the development of debt in the early 2000s. However, the exploration reveals that the Greek debt problem resulted from entering the EU rather than introducing the euro.
Looking at the development of the other four recipient countries (Ireland, Portugal, Italy, Spain), the results provide different pictures. The fit for Spain and Portugal is very good, while it is not too convincing for Ireland and Italy. While we see a negative treatment effect for Spain, and less clear, but potentially for Ireland, we find a positive treatment effect for Italy and Portugal (similar to Greece). This may indicate that fiscal governance is ineffective, and that the risk of moral hazard does exist—in particular for the latter group of euro countries. As not all countries are equally affected, we conclude that the SGP also works to some degree for some recipient countries. However, to increase the fiscal compliance of a large country like Italy, a more sophisticated mechanism would be needed. While smaller countries like Greece, Ireland and Portugal are supervised by the Troika, larger countries seem to have the power to escape from this mechanism.
How confident can we be in the predictions of this approach? How robust are our findings? There are two general ways to check the robustness of the results. One way is to compare the effect within each case by shifting the treatment periods and comparing the size and direction of the estimated effects with the effects obtained by setting the real treatment period, a so-called placebo study (Abadie, Diamond and Hainmueller Reference Abadie, Diamond and Hainmueller2012, 16f). We run the synthetic control study for the euro 11 countries and vary the treatment from 1988 to 2001 to check whether we find a significant effect for an arbitrary treatment year. Our findings are substantial if we find no comparable effect for those placebo studies. For every treatment year up to 1997, the gap between the actual and counterfactual outcomes is positive, indicating that we would expect a higher debt/GDP ratio than the one observed. This effect turns negative in 1998, although it is not as clear as the treatment effect we estimate for 1999. This strongly suggests that our study captures the effect of the SGP in 1999 at best. It also rules out the possibility that the driving force behind our findings is compliance with the Maastricht criteria. Figures 17–20 in the Appendix show the results of our robustness checks for selected years.
An alternative way to check the robustness of the results in a cross-sectional setting is to compare the effects obtained from using the real treatment period with the effects of applying the method to untreated units. Abadie, Diamond and Hainmueller (Reference Abadie, Diamond and Hainmueller2010) use this type of analysis in their study of the effects of the Californian Tobacco Control Program on tobacco consumption. We accordingly estimate the effects of a hypothetical treatment in 1999 for a couple of OECD countries. For the United States, the United Kingdom, Japan, Korea and Turkey, the effect is positive. For Mexico and Canada, the effect is sometimes positive and sometimes negative. For Chile it is negative. This shows that while the method would estimate significant effects for other countries, the effects are in most cases opposite to our finding for the euro 11. The effect for the euro 11 is different from the effects of other countries, which also increases confidence in our results.
Conclusion
The high levels of government debt in many of the euro countries are seen as the major threat to the survival of the euro. The conventional perspective on the European sovereign debt crisis is that the introduction of the euro had detrimental effects on the development of government debt in those countries due to the SGP’s failure to establish fiscal coordination. In analyzing these questions, however, the trajectory of debt is rarely evaluated in its own right. We contribute to this debate by proposing a new perspective to assess the working of the SGP. We use the synthetic control approach developed by Abadie, Diamond and Hainmueller (Reference Abadie, Diamond and Hainmueller2010) to estimate the relationship between the SGP and the introduction of the euro for the development of government debt in the euro countries. Our approach is based on the idea that the introduction of the euro constituted a policy shock for the euro countries. Because government debt did not play a role in the introduction of the euro and compliance with the rules, this structural break allows for the estimation of a counterfactual trajectory of government debt in the euro countries.
We find that the aggregated level of debt for the euro 11 countries is significantly lower than the level we would have observed without the introduction of the euro and the working of the SGP. By 2010 the cumulative effect was 397 billion, which is larger than Greece’s total debt in that year. This is strong evidence of a constraining effect of the SGP on governmental debt making in the euro countries. Although the SGP experienced several violations, it remains a reference value that has stimulated the euro countries to make compliance efforts and reduce governmental spending since the introduction of the euro. We also find that Greece’s debt was not caused by the introduction of the euro, but rather by its EU membership and the economic crisis.
On closer inspection, this effect is stronger for the donor states. We show that the debt/GDP ratios of donor countries are lower than one would expect without the introduction of the euro and the working of the SGP. This suggests that the SGP sends institutional alarms about governmental performance and constrains governmental spending in donor countries. For the recipient countries, our findings are mixed. We conclude that fiscal governance is less effective in countries with lower expectations on governmental fiscal performance, but there is some variation. In some of the recipient countries, the government debt would be lower without the euro. Ireland and Spain, on the contrary, did quite well under the SGP. We conclude that the overall effectiveness of fiscal governance in the eurozone is much higher than is usually claimed in the literature, despite cross-country variation.
Our data suggest, however, that surveillance mechanisms like the SGP do have effects that are unaccounted for in the theoretical literature. In particular, the conditional nature of the preventive legislation is usually ignored. The effects of an institutional alarm sounded by violations of the SGP differ across the eurozone. The results also suggest that the macroeconomic imbalance procedure that was implemented in the ‘six-pack’ legislation may not be the best way to predict problematic developments, as it ignores government incentives to act on these imbalances. An additional strengthening of the coercive arm may be needed to make fiscal policies work in countries where institutional alarms are weak.