


Introduction
A variety of ice- and debris-dammed periglacial lakes exist at the front or margins of glaciers as well as in permafrost areas of high-mountain regions. Outbursts of such proglacial, ice marginal or thermokarst lakes constitute a major natural hazard and can be associated with extreme discharge events (Reference Lliboutry, Arnao, Pautre and SchneiderLliboutry and others, 1977; Reference HaeberliHaeberli, 1983; Reference Vuichard and ZimmermannVuichard and Zimmermann, 1987; Reference Evans, Clague and BrasEvans and Clague, 1993; Reference O’Connor and CostaO’Connor and Costa, 1993). Outbursts of large ice-dammed lakes often take place through flotation of the ice dam followed by progressive enlargement of subglacial channels (Reference Clague and MathewsClague and Mathews, 1973; Reference Spring and HutterSpring and Hutter, 1981; Reference ClarkeClarke, 1982; Reference EvansEvans, 1986), but smaller events may be due to sudden-break mechanisms causing especially high ratios between peak discharge and outburst volume (Reference HaeberliHaeberli, 1983). Breaching of moraine dams involves piping (progressive ground-water flow) within the morainic material, liquefied flow/slippage on steep slopes, and overtopping with retrogressive incision (Reference Jackson, Hungr, Gardner and MackayJackson and others, 1989; Reference Clague and EvansClague and Evans, 1994; Reference HaeberliHaeberli, 1996). Glacier shrinkage induced by atmospheric warming may eliminate problems relating to ice-dammed lakes in some places but create new ones in others. Especially proglacial lakes, growing behind large terminal moraines built up by heavily debris-covered glaciers, constitute a recognizable and rapidly growing hazard in countries such as Nepal and Bhutan (Reference GansserGansser, 1983; Reference Hanisch, Delisle, Pokhrel, Dixit, Reynolds and GrabsHanisch and others, 1998; Reference YamadaYamada, 1998). Technical measures have been taken in some cases to mitigate the hazard (Reference Lliboutry, Arnao, Pautre and SchneiderLliboutry and others, 1977; Reference Haeberli and EpifaniHaeberli and Epifani, 1986; Reference Reynolds, Dolecki, Portocarrero, Maund and EddlestonReynolds and others, 1998).
On steep slopes covered with abundant loose sediments in the form of talus and moraines, the sudden emptying of even small lakes can lead to devastating debris flows (Reference HaeberliHaeberli, 1983, Reference Haeberli1996). The densely populated Swiss Alps have repeatedly been affected by such floods and debris flows. A multitude of factors must be taken into account when assessing risks from such events (Reference HaeberliHaeberli, 1983; Reference Haeberli, Alean, Müller and FunkHaeberli and others, 1989). The corresponding hazard depends on potential flood volumes, outburst mechanisms, discharge development, erosional and depositional processes, slope and distance to human installations, and the nature and locations of artificial structures. One aspect, however, is common to many cases: the long-term evolution of potentially dangerous water bodies at the surface can be recognized at an early stage and systematically monitored. This approach offers possibilities of carrying out hazard prevention work in time.
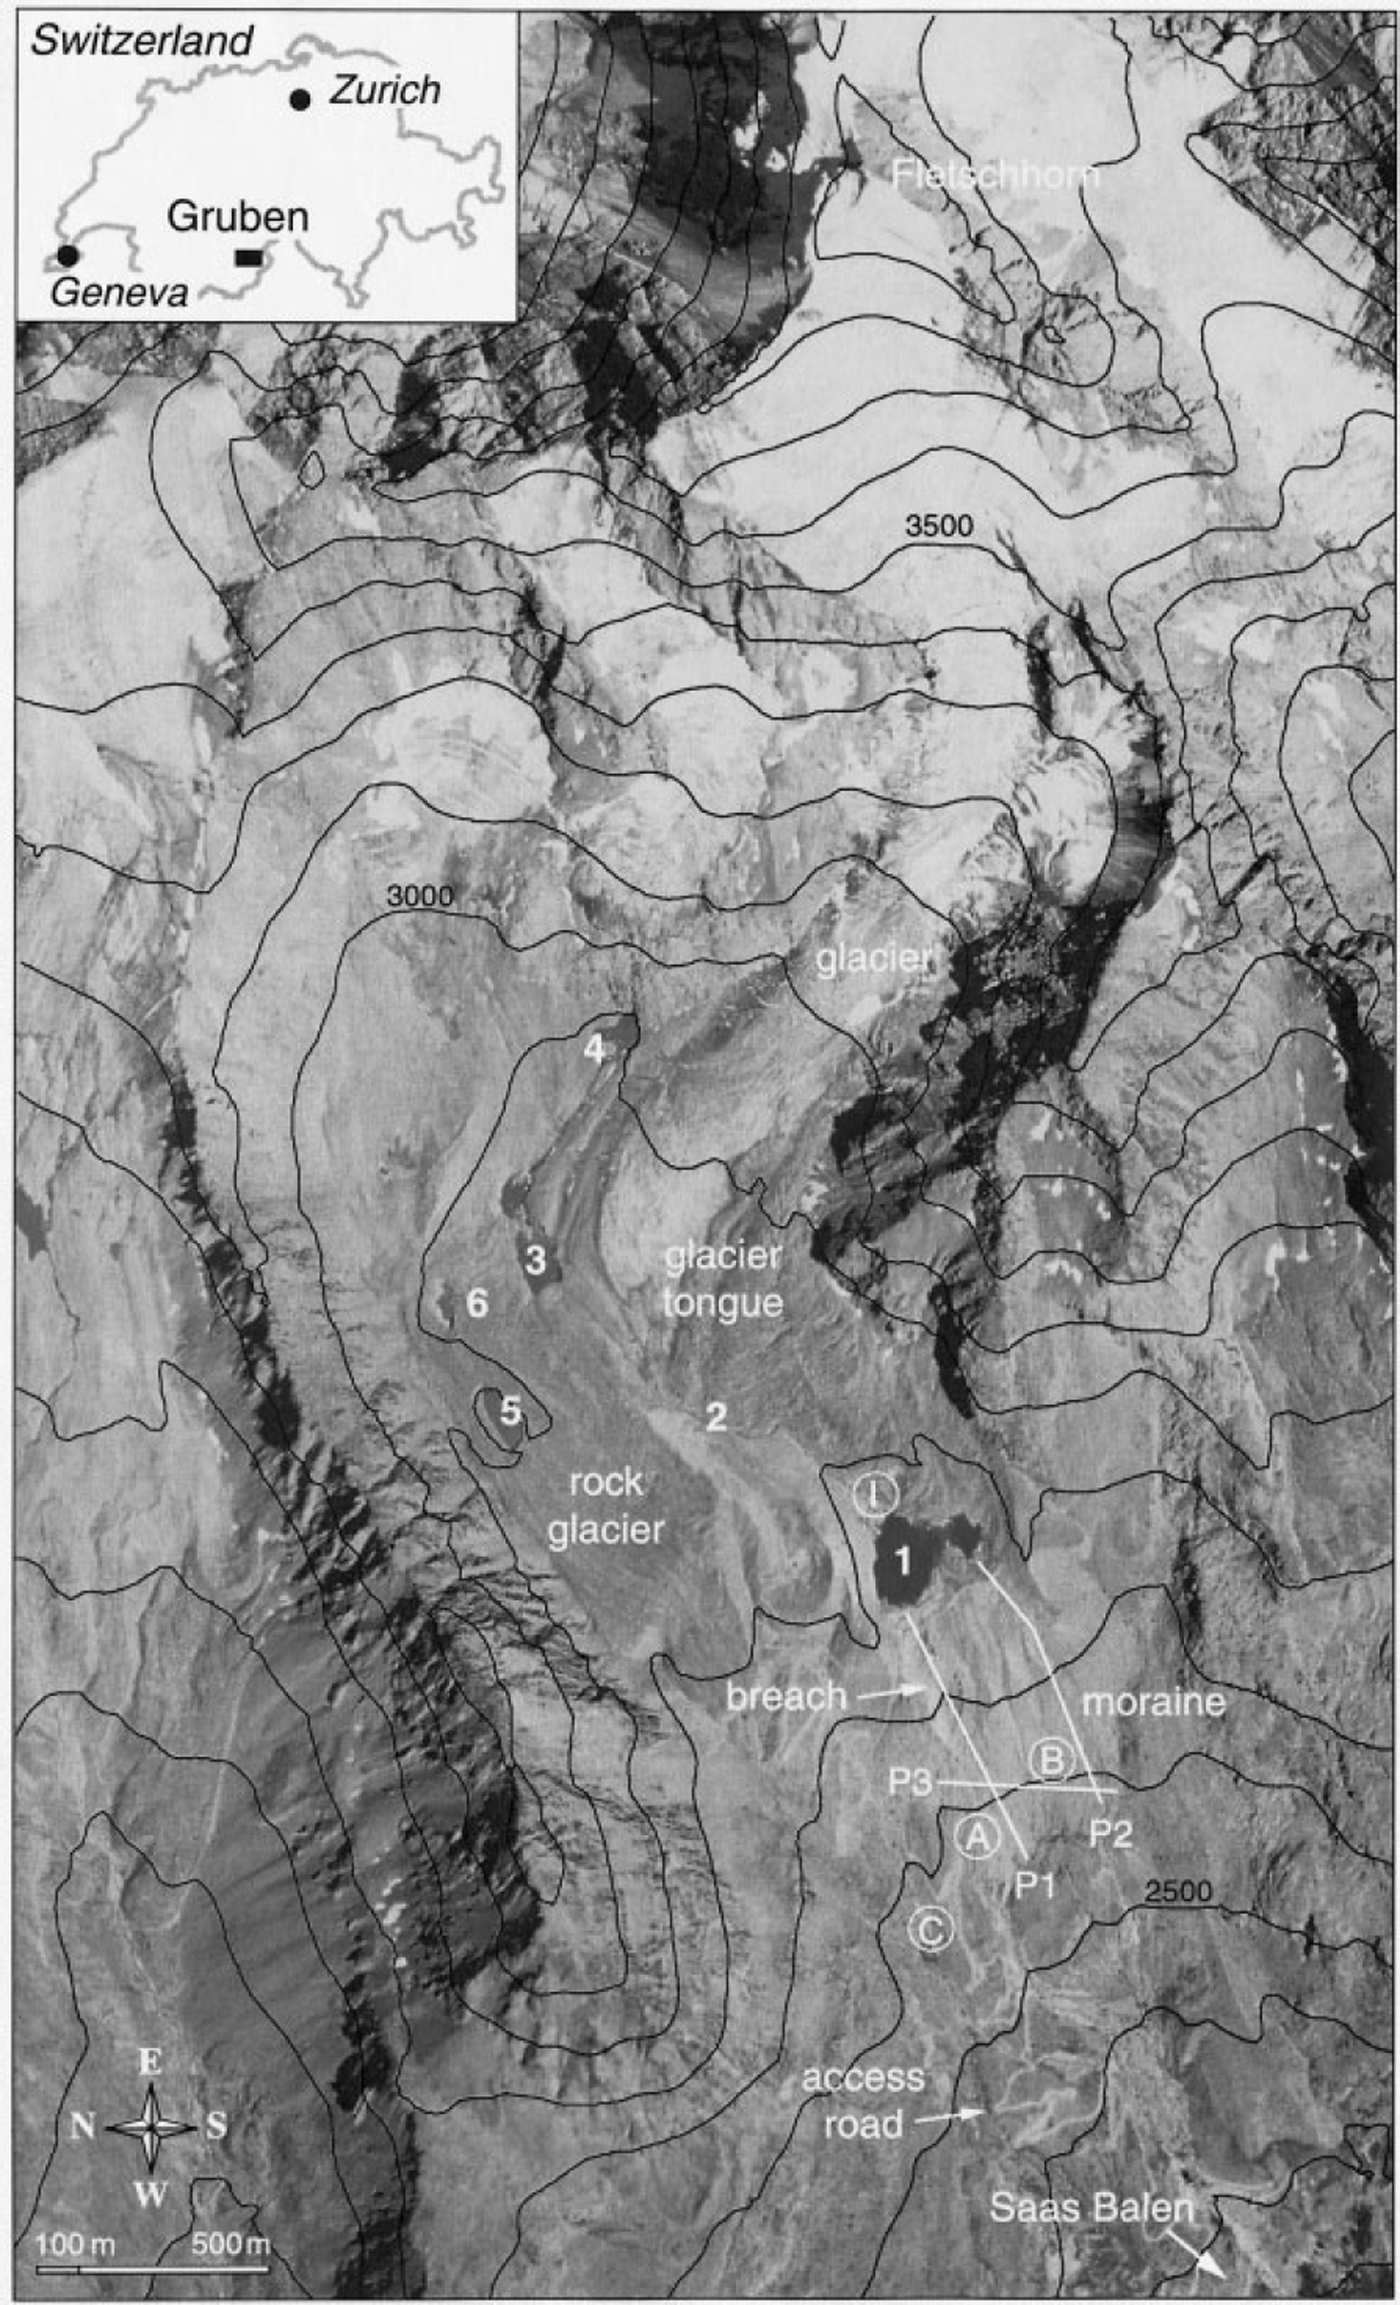
Five major glacier floods and debris flows had affected the village of Saas Balen, Saas Valley, Valais (Fig. 1), during the 19th and 20th centuries, repeatedly causing heavy damage to the community. The source area of these events is a glacial cirque situated 1400 m above and only about 3 km away. As a consequence of glacier recession and permafrost degradation, a number of lakes developed during the past decades in thick debris accumulations around the tongue of Grubengletscher. Flood prevention work was done at two of these lakes (Lakes No. 1 and 3) following the last outburst event in 1970. These measures proved to be successful during a period of intermittent glacier growth in the 1970s and early 1980s. However, new problems developed in recent years when glacier thinning started to accelerate again. Analysis of specially flown aerial photographs, together with geophysical soundings and hydrological observations, allowed the design of new preventive measures. The present paper summarizes the research which formed the basis for such hazard-prevention activity and addresses the construction work carried out at this high-mountain site (cf. detailed reports in German by Reference Kääb and HaeberliKääb and Haeberli, 1996; Reference Kääb, Haeberli and TeysseireKääb and others, 1996; Reference Vonder Mühll, Haeberli and KlingeléVonder Mühll and others, 1996; Reference HaeberliHaeberli and others, 1999a).
Situation ( Switzerland) and orthophoto map of the Gruben cirque between the Fletschhorn (3993 m a.s.l.) and Saas Balen (not visible). Numbers 1–6 refer to the periglacial lakes, letters A–C to important springs related to hydrological investigations, and I to the injection point for tracer experiments. Lines P1 P2 and P3 are seismic refraction profiles. Geoelectrical d.c. resistivity soundings were taken along the seismic lines P1 and P2 gravimetric measurements were made along P1 and P2 and also perpendicular to these lines along the contour lines 2650 and 2770 m a.s.l. Air photos taken by Federal Office of Cadastral Surveys, 30 August 1991, flying height 8000 m a.s.l.
Site and Historical Background
The region under study lies within a glacial cirque in which the tongues of Grubengletscher and of the Gruben rock glacier lie side by side (Fig. 1). Several lakes formed within this complex combination of polythermal glacier ice, thick morainic deposits and discontinuous permafrost. For historical reasons, the numbering of the lakes starts with the proglacial Lake No. 1, then proceeds up-glacier to the ice-marginal Lakes No. 2, 3 and 4, and finally includes Lakes No. 5 and 6 in dead ice deposited within periglacial permafrost. Following two outbursts of ice-dammed Lake No. 3 in 1968 and 1970, an access road was constructed to enable flood prevention work and corresponding site investigations. The same road together with accumulated local knowledge also greatly facilitated projects of predominantly scientific interest (Reference Barsch, Fierz and HaeberliBarsch and others, 1979; Reference Haeberli, King and FlotronHaeberli and others, 1979; Reference Haeberli and FischHaeberli and Fisch, 1984; Reference HaeberliHaeberli, 1985; Reference Kääb, Haeberli and GudmundssonKääb and others, 1997).
Grubengletscher (Fig. 1) flows from the summit of the Fletschhorn at 3993 m a.s.l to the bottom of the cirque at around 2800 m a.s.l. The accumulation area exposed to the northwest is assumed to be predominantly cold above about 3500 m a.s.l., with characteristic 10 m temperatures reaching −10°C in the highest parts (Reference HaeberliHaeberli, 1975; Reference SuterSuter, 1995; Reference Frauenfelder, Allgöwer, Haeberli and HoelzleFrauenfelder and others, 1998; Reference Suter, Laternser, Haeberli, Frauenfelder and HoelzleSuter and others, 2001). Fast flow of thin and crevassed ice on the steep slopes, together with warmer firn temperatures in the lower accumulation area between about 3500 and 3200 m a.s.l., explains the predominantly temperate ice in the ablation area. However, a slightly cold surface layer (10 m temperatures between −1° and −2°C), some 20–30 m thick, exists on the flatter glacier tongue which is frozen to the bed at its margin. Artesian water has been observed in boreholes which were drilled to the glacier bed in the transition zone between warm- and cold-based ice. The cold-based glacier margin indeed acts as an effective hydraulic barrier for the ice-marginal Lake No. 3, keeping the water pressure high in the central, warm-based part of the glacier. The glacier tongue rests on a thick sedimentary, permeable and deformable bed. D.c. resistivity soundings carried out at the bottom of boreholes drilled to the glacier bed (Reference Haeberli and FischHaeberli and Fisch, 1984) indicate a total subglacial sediment thickness of about 100 m underneath the glacier tongue, which is typically about 50 m thick.
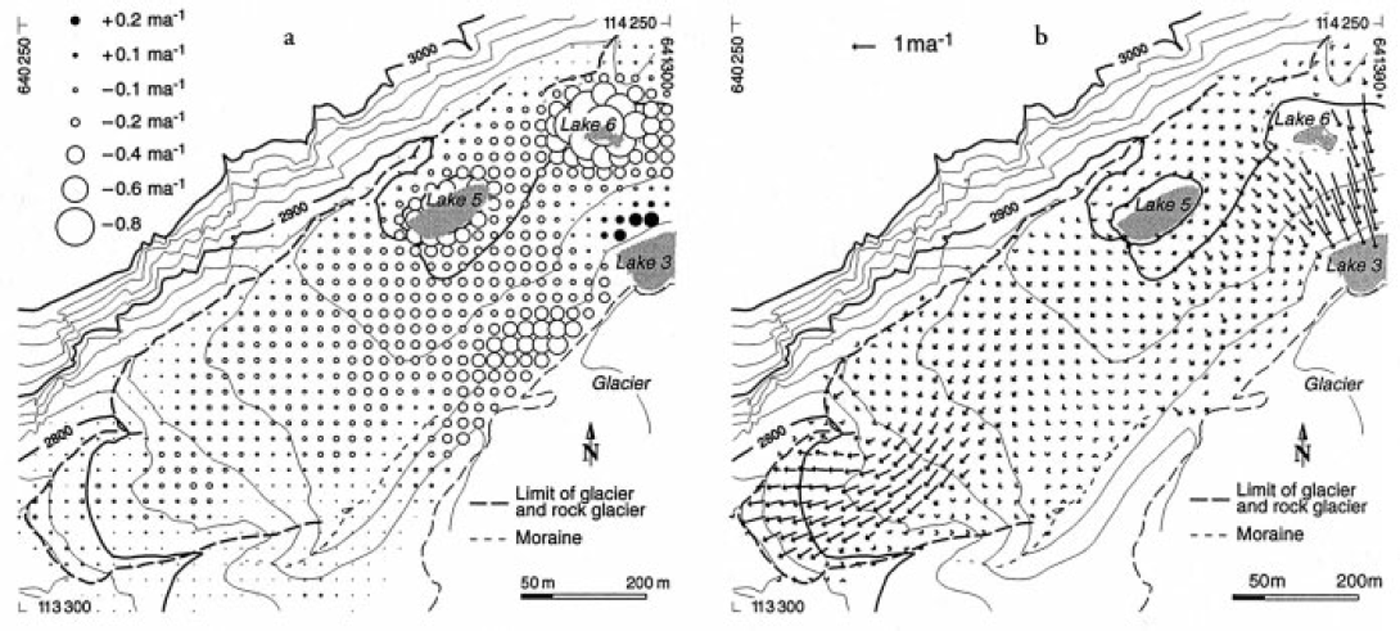
Ice-rich frozen ground within the adjacent Gruben rock glacier reaches depths of > 100 m (Reference King, Fisch, Haeberli and WaechterKing and others, 1987) but may not be in contact with bedrock everywhere. Mean annual temperature at the permafrost table today is close to −1°C but must have been colder during the Little Ice Age in order to explain the measured permafrost thickness (Reference Barsch, Fierz and HaeberliBarsch and others, 1979). Creep of the frozen sediments typically amounts to some decimeters per year at the surface, predominantly exhibits extending flow, and points to an overall rock-glacier age measured in thousands of years (Reference Haeberli, King and FlotronHaeberli and others, 1979; Reference Kääb, Haeberli and GudmundssonKääb and others, 1997). Pronounced seasonal variations of surface velocities indicate some sliding or discrete shear, possibly on wet and deformable sub-permafrost sediments (Reference HaeberliHaeberli, 1985). Strain-rate components and surface-altitude changes for the time period 1970–95 (Reference Kääb, Haeberli and GudmundssonKääb and others, 1997) reveal an overall tendency for the rock-glacier surface to subside at a rate of a few centimeters per year. This is largely due to 20th-century warming and corresponding thaw settlement of ice-supersaturated debris in combination with vertical thinning as a consequence of predominant longitudinal extension.
In the area of former contact between the rock glacier and the more extended glacier during the maximum stage of the Little Ice Age around AD 1850, remains of buried ice are embedded on top of the permafrost. The thermokarst Lakes No. 5 and 6 developed in such massive ground ice. Here, permafrost was probably glacitectonically deformed and pushed upslope by the advancing cold-based margins of the Little Ice Age Grubengletscher. The resulting morphologically distinctive push moraine at the former line of contact between the glacier and the rock glacier is now creeping and sliding backwards into the topographic depression which was left by the glacier retreat during the past decades (Reference Kääb, Haeberli and GudmundssonKääb and others, 1997; cf. Fig. 2). Temporary lakes sometimes form during the melt season within two permafrost-free areas in the background of the cirque and in between the tongues of the glacier and the rock glacier. Proglacial Lake No. 1 developed in front of, and within, the heavily debris-covered glacier tongue, on top of thick morainic debris and behind small terminal moraines probably deposited during the intermittent readvance of Alpine glaciers around 1890 and 1920. Lake No. 2 was a small ice-marginal pond in the 1960s and early 1970s but was completely filled by the intermittently readvancing ice margin in the late 1970s and 1980s. Lake No. 3 was dammed at its down-valley end by a mixture of frozen ground and glacier ice in the contact zone between the glacier and the rock glacier. Lake No. 4 fills episodically at the glacier margin where Grubengletscher enters the flat cirque floor from the much steeper rock slopes below the summit of the Fletschhorn.
Topography, surface elevation change and surface displacements on the Gruben rockglacier. (a) Topography of 1991 and changes in surface elevation during 1970–95 indicating different subsidence rates in the periglacial part (lower left) and the glacier-affected part containing massive remains of dead ice ( upper right ). (b) Surface displacements on the Gruben rock glacier during 1970–95 indicating different creep regimes of the periglacial part ( lower left) and the glacier-affected part (upper right).The velocity field and the changes in surface elevation allow for an estimate of recent glacial impacts and related dead-ice occurrences on the rockglacier.
Earlier sudden floods from the Gruben area occurred in 1829, 1868 and 1958 (Reference LichtenhahnLichtenhahn, 1979). The 1958 event was due to Lake No. 3 overflowing its ice/permafrost dam. In the summer of 1968, Lake No. 3 emptied catastrophically by progressive enlargement of a subglacial channel. The lake outburst volume was roughly 170 000 m3, causing a peak discharge of only about 10 m3 s−1 but eroding about 400 000 m3 of debris within Holocene morainic material immediately below Lake No. 1 and within late-glacial morainic material near Grubenalp (bottom right corner of Fig. 1), at about mid-distance to the main valley. The resulting damage in the village of Saas Balen was heavy. A similar event from Lake No. 3 again took place in summer 1970 after closure of the subglacial channel during winter. This time, the peak discharge was about 15 m3 s−1 and the total volume eroded in morainic deposits amounted to about 100 000–150 000 m3. After the event, a tunnel was excavated through the basis of the damming ice margin, and later a large pipe was installed within the subglacial permafrost of this tunnel in order to keep the lake at a safe water level. At Lake No. 1, an artificial dam consisting of coarse blocks with a concrete outlet was constructed to prohibit retrogressive erosion in case of unpredictable floods from upstream lakes and ponds or subglacial reservoirs (Reference LichtenhahnLichtenhahn, 1971, Reference Lichtenhahn1979; Reference RöthlisbergerRöthlisberger, 1971, Reference Röthlisberger1979, Reference Röthlisberger1981; Reference HaeberliHaeberli, 1980). Annual air-photo flights at low altitude were initiated in 1970 to monitor the development of the conditions at the site.
Observations, Measurements and Soundings
Photogrammetric analysis with multitemporal digital terrain models and simultaneous monoplotting in photogrammetric stereo models (for details of the newly developed methodology, cf. Reference Kääb, Haeberli and GudmundssonKääb and others, 1997; Reference Kääb and FunkKääb and Funk, 1999) enabled the evolution of lake areas to be documented, changes in surface elevation to be determined and surface flow fields of the glacier and the rock glacier to be measured. The large moraine at Lake No. 1 was investigated using a combination of seismic refraction, geoelectrical d.c. resistivity and gravimetry to gain information about the thickness, internal structure and porosity of the morainic material. At this site, discharge and water-temperature measurements together with tracer experiments were also carried out.
The observations collected by these investigations and regular field inspections are described in the following. Thereby, the lakes are treated in a sequence along the general drainage direction, i.e. from the lakes higher in the drainage down to Lake No. 1. This makes it easier to understand the hazard potential at each lake which includes possible chain reactions along the drainage path from lake to lake. The safety of Lake No. 1, for instance, not only depends on the stability of its own outlet but also on processes relating to upstream lakes. Note that Lakes No. 6 and 4 independently of each other flow into Lake No. 3.
Thermokarst Lakes No. 6 and 5
During the mid-1960s, crevasses formed at the upper margin of dead-ice occurrences within the creeping permafrost area (cf. Fig. 2). Two corresponding depressions progressively enlarged, forming the thermokarst Lakes No. 6 and 5.
Lake No. 6 fills up only during winter and spring. When the lake is full of water, the frozen lake bottom starts leaking and the lake slowly empties through the permeable permafrost active layer, through remaining dead-ice layers or through the underlying permafrost. Freezing water seems to seal the bottom of the lake depression in late autumn. Subsequently, the lake fills with water, ice and finally snow until melting starts in spring. At its deepest point, the bottom of Lake No. 6 has lowered continuously by about 1 m a−1 since 1970; the related depression had an area of roughly 10 000 m2 in the late 1990s (cf. Fig. 2). Although the enlargement of the lake was accompanied by various manifestations of thermokarst development such as undercutting of ice walls by circulating lake water, melting and down-wasting of exposed massive ice, small landslides in morainic material along the oversteepened lake shores, rock falls, or collapse phenomena in the permafrost active layer, signs of catastrophic emptying were never observed, or corresponding runoff changes were damped below critical levels by the retention function of the artificially regulated Lakes No. 3 and 1 lower in the drainage.
The surface of Lake No. 5 grew at an accelerating rate and asymmetrically towards the south, exposing there an increasingly high ice front. In 1994, the lake reached an area of 10 000 m2 and a volume of some 50 000 m3 (Fig. 3). During the summer, the lake surface was more or less free of ice, and the water warmed to temperatures of about 2°C under the influence of solar radiation and high air temperatures. As shown by strong undercutting of the ice front and drifting of small icebergs away from it, the density increase due to warming triggered a process of thermal convection: warmer and denser surface water sinks to the lake bottom, flows towards the ice front, cools by ice melting and undercutting the ice front, thereby reducing its density, and rises again to the lake surface where it flows away from the ice front and warms up (Fig. 4). Such convection is strengthened by a positive feedback, in that melting of ice leads to a larger surface area of the lake, increased energy input and more melting, etc. This positive feedback together with the existence of massive ground ice represents the main cause for the accelerating lake growth.
Growth of thermokarst Lake No. 5. (a) Planimetrie representation of the lake outline in selected years of the time period 1967–95 (note asymmetric lake growth towards the massive ground ice in the south; the sudden displacement of the northern lake shore is a consequence of the lake-level lowering in 1984). (b) Lake level and area over the period 1968–95. Lake level smoothly dropped some meters in 1985 and1988; assessment of future lake growth suggested an area of about 20 000 m2 or a volume of100 000 m3 in the year 2000 (dashed line with arrow). In 1995, the lake was pumped out due to its increasing hazard potential.

Schematic representation of energy input by solar radiation, convective heat transport to the damming front of buried massive ice, subsequent ice melt and water cooling of the lake water leading to a positive feedback which drives the non-linear growth of thermokarst Lake No. 5. After drainage of the lake, strong undercutting and vertical pear-like convexities of about 1 m height were found in the exposed ice front, presumably related to local thermic convection cells.

During the early 1990s, the last years of its existence, Lake No. 5 grew annually by about 1500 m2 in surface area and 7500 m3 in volume. On two occasions in the 1980s, the lake level smoothly dropped by several meters without leaving any traces of surface runoff. These changes in lake level pointed to the existence of near-surface crevasses in the surrounding ice and permafrost, but the corresponding water losses did not significantly slow down the overall growth rate of the lake (Fig. 3). Photogrammetrically measured differential melt, subsidence and flow rates (Fig. 2; Reference Kääb, Haeberli and GudmundssonKääb and others, 1997) indicated that massive ground ice at the southern lake border continued right into the steeper slope towards Lake No. 3 where creep is accelerating (extending flow). Extrapolated lake growth would have reached this critical area with potential crevasse formation and fast lowering of the southern lake shore in the years 1998–2000 at the latest (cf. Fig. 3b). It was therefore decided to determine the geometry of the lake bottom from a rubber boat, using a microdigitizer echo-sounder in combination with a tachymeter and later a differential real-time global positioning system receiver. A total of 4200 points were measured with an estimated accuracy of ±0.1 m. Based on this information and the photogrammetric data, the area and volume of the lake at the expected outburst time were estimated at 20000 m2 and 100 000 m3, respectively. A sudden outburst of such volumes could have produced peak discharges of several m3 s−1 (cf. Reference HaeberliHaeberli, 1983), potentially triggering outbursts of Lakes No. 3 and 1 with corresponding debris-flow hazards at Lake No. 1, at the rock glacier front or on steep slopes lower down. The recognizable hazard potential from the quickly enlarging Lake No. 5 was therefore considered to be unacceptable (cf. further comments in the section on hazard-mitigation works).
Ice-marginal Lakes No. 4, 3 and 2
The topographic depression at the right glacier margin contains the ice-dammed Lakes No. 4, 3 and 2 (Fig. 1), the development and safety of which are strongly affected by changes in mass and geometry of the glacier.
Lake No. 4 started to grow in the late 1960s up to an area of some 5000 m2 in the mid-1970s. During the following years of general glacier growth, the related depression was mostly filled year-round by snow and ice. From the late 1980s on, the lake enlarged again by successively melting towards the glacier, reaching an area of 6000 m2 in the mid-1990s. Almost every year, Lake No. 4 slowly emptied in late fall. The normal lake drainage towards Lake No. 3 is partially along and partially beneath the glacier margin. Presently, Lake No. 4 is growing from its flat sediment bottom towards thicker ice and steeper, rocky parts of the glacier bed. Formation of slush avalanches in snow covering the outflow can cause suddenly increased discharge towards Lakes No. 3 and 1 during spring and early summer. However, the lake has remained empty during the past few years.
The outbursts of Lake No. 3 in 1968 and 1970 (Reference RöthlisbergerRöthlisberger, 1979) had occurred when the lake water rose to the flotation threshold of the damming ice and snowdrift, triggering subglacial drainage and progressive enlargement of a subglacial channel during early summer (cf. Reference NyeNye, 1976, for the principle of the outburst mechanism). After artificial water-level regulation via a subglacial drainage pipe, the lake was stabilized until recent years when the surface of the ice dam started to sink and approach the flotation threshold from above. Such a potentially dangerous situation had been anticipated on the basis of careful monitoring by regular visual inspection and photogrammetric analysis of the specially flown annual air photos. Between 1976 and 1989, the slightly advancing glacier had reduced the area of the lake surface (Fig. 5). More recently, glacier shrinkage enabled renewed increase in lake surface area by melting and undercutting of the calving ice front (cf. Reference Haeberli and RöthlisbergerHaeberli and Röthlisberger, 1976; Reference IkenIken, 1977). In 1996, the lake surface area had reached 18 000 m2. A collapse structure in the ice, visible on air photos since 1994, indicated that the lake water had begun to melt a large cavity underneath the glacier, probably in connection with water from Lake No. 4 flowing over morainic material and entering the eastern part of Lake No. 3. The total lake volume could, therefore, only roughly be estimated at about 100 000 m3 (for 1996). The lake had not always been completely full during the air-photo flights in the fall, a fact which must be taken into account when interpreting the evolution of the photogrammetrically mapped lake surface.
Evolution of ice-dammed Lake No. 3 during the time period 1968–95. (a) Planimetric representation of the lake outline at selected times of photography, 1967–94. (b) Lake level and area as a function of time. Note that lake level is varying over time. The presented values only reflect the situation at the time of aerial photography in the fall.

The safety of the ice dam at Lake No. 3 depends on the height of the ice surface above lake level. This geometry critically depends on ice advection by glacier flow which, in turn, is a function of the mass-balance evolution of the entire glacier. Recent mass changes of the entire glacier up to the summit of Fletschhorn were determined by photogrammetric analysis of high-altitude flights (Reference KääbKääb, 2000) carried out by the Swiss Federal Office of Topography at time intervals of several years for the standard revision of the Swiss National Topographic Map. As compared to the time interval 1975–85 with predominant volume increase especially in the lower glacier part, the time interval 1985–91 is characterized by average thickness losses of −0.8 m a−1 (Fig. 6), a value which is in good agreement with similarly strong mass losses measured directly at other Alpine glaciers (Reference Haeberli, Hoelzle and FrauenfelderHaeberli and others, 1999b).
Spatial pattern of mean annual changes in surface elevation of Grubengletscher during the time intervals 1975–85 (left) and 1985–91 (right). The results were derived from regular spaced photogrammetrically measured digital terrain models (DTMs) (50 m grid) of 1975, 1985 and 1991. Note the strong increase in surface elevation affecting the lower part of the glacier tongue and indicating an advance between 1975 and 1985 followed by decrease in ice thickness from 1985 to 1991.

Information from the annually flown low-altitude air photos (Reference KääbKääb, 2000) showed that the velocity of ice flow on the glacier tongue at Lake No. 3 (Figs 7 and 8) had reached a maximum around 1980 and then dropped by about 50% until 1994. This drastic reduction of flow velocity is only partially correlated with changes in ice thickness (cf. Fig. 8), probably due to changes in the subglacial water pressure. It caused the ice dam at Lake No. 3 to lower after 1985, i.e. 5 years after the velocity maximum in 1980, at a rate of −1.5 m a−1 on average with an extreme value of −3 m a−1 in 1990. In 1994, the ice surface was lower than in the years of the lake outbursts in 1968 and 1970 and at the time of artificial lake-level regulation. In view of such developments, imminent reversal of the ice-thinning trend near Lake No. 3 could not be assumed.
Field of mean annual velocities on the tongue of Grubengletscher during the time intervals fall 1973–fall 1974, fall 1979–fall 1980 and fall 1991–fall 1992. The average surface velocity dropped drastically between the latter two stages, presumably due to marked changes in subglacial water pressure.

Change in flow velocity and surface elevation on the tongue of Grubengletscher during the time interval 1973–92. (a) Cumulative changes in mean annual velocity. Bold data points indicate high-precision results from redundant and independent photogrammetric measurements; unfilled ones indicate single measurement procedures, (b) Cumulative changes in average elevation of the entire Grubengletscher (filled area) and its tongue (dotted line), 1967–91 (1967–95 for the tongue). Due to the limited availability of high-altitude aerial photographs covering the entire glacier, DTMs could be collected only in selected years, whereas a DTM of the tongue region could be measured almost every year.

Ice depth near Lake No. 3 is known from radio-echo soundings and hot-water drillings which were combined with subglacial d.c. resistivity soundings using borehole electrodes (Reference Haeberli and FischHaeberli and Fisch, 1984). Based on this information and the above-mentioned photogrammetric data, the safety against dam failure was calculated as the excess thickness above the critical flotation threshold (Fig. 9). In the fall of 1995, this safety reached a minimum of 8 m at the thinnest point of the ice dam. By extrapolating the observed subsidence rates (−1.5 to −3 m a−1) of the ice surface, a potential early outburst time was estimated as 1998–2000. It was therefore considered advisable to undertake the necessary steps for avoiding another uncontrolled lake drainage (cf. further comments in the section on hazard-mitigation works).
Safety of ice-dammed Lake No 3 in 1995: ice thickness above flotation threshold was calculated from glacier bed topography determined by radio-echo sounding, photogrammetry-derived ice-surface topography and extrapolated lake level applying the “iceberg model” of Reference NyeNye (1976).

Lake No. 2 was situated at the right margin of the heavily debris-covered part of the glacier tongue (Fig. 1). Its area was continuously reduced by the growing glacier (cf. Fig. 6) from some 2000 m2 in 1975 to its complete disappearance in 1981.
Proglacial Lake No. 1
Lake No. 1 grew on top of a very thick sediment bed or morainic apron. Such thick morainic beds form where glaciers receive much more debris from the surrounding rock walls than the meltwater stream can evacuate (Reference HaeberliHaeberli, 1996; Reference Maisch, Haeberli, Hoelzle and WenzelMaisch and others, 1999). As a positive feedback, they reduce the transport capacity of meltwater streams through percolation of surface water into the subsurface or through lake formation in closed topographic depressions. Lakes thus formed represent an obvious potential for moraine-dam breaching and the formation of large debris flows. At Gruben, the flood events of 1968 and 1970 had initiated the breaching process in the morainic apron, and an artificial dam consisting of coarse blocks with a concrete outlet structure had to be installed in order to prevent further incision and debris-flow formation in the eroded stream channel.
During recent years, hydrogeological conditions at Lake No. 1 have undergone remarkable changes. Lake level more and more remained below the artificial dam and only reached the concrete outlet during time periods of strong ice melt combined with events of heavy precipitation. Water leaving Lake No. 3 drained into coarse, highly permeable morainic deposits before entering Lake No. 1. Moreover, the southern part of the lake (Fig. 1) quickly enlarged into dead ice buried within material of the 1890/1920 moraines but only filled when water from the northern lake part was flowing over a threshold between the two parts. This development was favourable in that it increased the potential retention volume of Lake No. 1 with respect to unexpected floods from upstream lakes and ponds. However, it also created concern among the local population that the stability of the moraine dam could degrade due to internal erosion or ice melt. This concern was later substantiated by the observation made during one event of heavy precipitation and fast-rising lake level, that percolating water was flowing underneath the outlet structure to reappear as strong springs in the moraine breach on the valley side. The stability of the moraine dam is, indeed, a crucial component of the hazard potential in the entire drainage basin, because the retention capacity of Lake No. 1 essentially helps protect the village of Saas Balen from the formation of dangerous debris flows in the eroded stream channel but could most seriously aggravate the danger in case of dam failure. Geophysical, hydrological and photogrammetric investigations were therefore carried out on the huge morainic apron in order to investigate the stability aspects and to redesign the protective measures.
Characteristics and stability of morainic materials at Lake No. 1
Breaching of moraine dams may involve (a) piping (progressive ground-water flow) within the morainic material, (b) liquefied flow/slippage on steep slopes, and (c) overtopping with retrogressive incision (Reference HaeberliHaeberli, 1992, Reference Haeberli1996; cf. Reference Youd, Wilson and SchusterYoud and others, 1981). In all cases, high water levels are critical and the internal structure, the porosity and the water saturation within the morainic material constitute the main factors influencing the stability. The primary questions to be answered by the investigations, therefore, related to trajectories of subsurface water flow and to the presence or absence of ground ice, of loose erodible material and of water-saturated sediments.
Three seismic refraction profiles and 13 geoelectrical d.c. resistivity soundings were measured in 1993 by GEOTEST Consulting Company (Geotest, unpublished; Figs 1 and 10). Geoelectrical d.c. resistivity of (unfrozen) bedrock was determined to be about 9 kΩm at outcrops near the foot of the moraine slope. The internal moraine structure (Fig. 10) was analyzed using characteristic values for seismic velocities and d.c. resistivities usually observed in starting zones of debris flows (Reference Haeberli, Rickenmann, Zimmermann and RösliHaeberli and others, 1990). In addition, the ratio ρ (Ωm)/V p (m s−1) between the electrical resistivity ρ and the seismic velocity V p, multiplied by a factor R reflecting the vertical sequence of resistivities, was also considered (Reference Vonder Mühll, Haeberli and KlingeléVonder Mühll and others, 1996). Gravimetric observations were made in 1994. Determination of the regional gravity field requires measurements on outcropping bedrock on each side of the expected anomaly, here the morainic layers. This task was made difficult by the fact that nearby rock outcrops hardly exist in the eastern part of the investigated area. Hydrological investigations were carried out in 1993 and 1994.
Two sections through the moraine dam near Lake No. 1 as obtained from seismic refraction and d.c. resistivity soundings. Numbers refer to an index combining the results from the two sounding methods mentioned in the text. The light-dotted area shows loosely compacted layers, the darker-dotted area represents possible occurrences of ground water, and the remaining parts are non-saturated and well-compacted morainic material.

The seismic refraction soundings indicated bedrock as a marked refractor with P-wave velocities of 3900–4900 m s−1 (Fig. 10). Bedrock depth is only a few meters at the foot of the moraine dam but increases continuously towards Lake No. 1 where it reaches 100 m and more. Within the uppermost 5–20 m of the moraine, seismic velocities are 400–900 m s−1 and resistivities are 2 to > 15 kΩm in places. Deeper morainic layers are characterized by seismic velocities of 1000–1700 m s−1 and resistivities of 2–8 kΩm. The highest resistivity values are correlated with very low seismic velocities, indicating large porosity rather than ground ice (which would have high seismic velocities). Particularly loose parts of the moraine therefore occur relatively close to the surface, whereas indications for ground-water-bearing layers are sparse and concentrated at the interface between bedrock and the moraine.
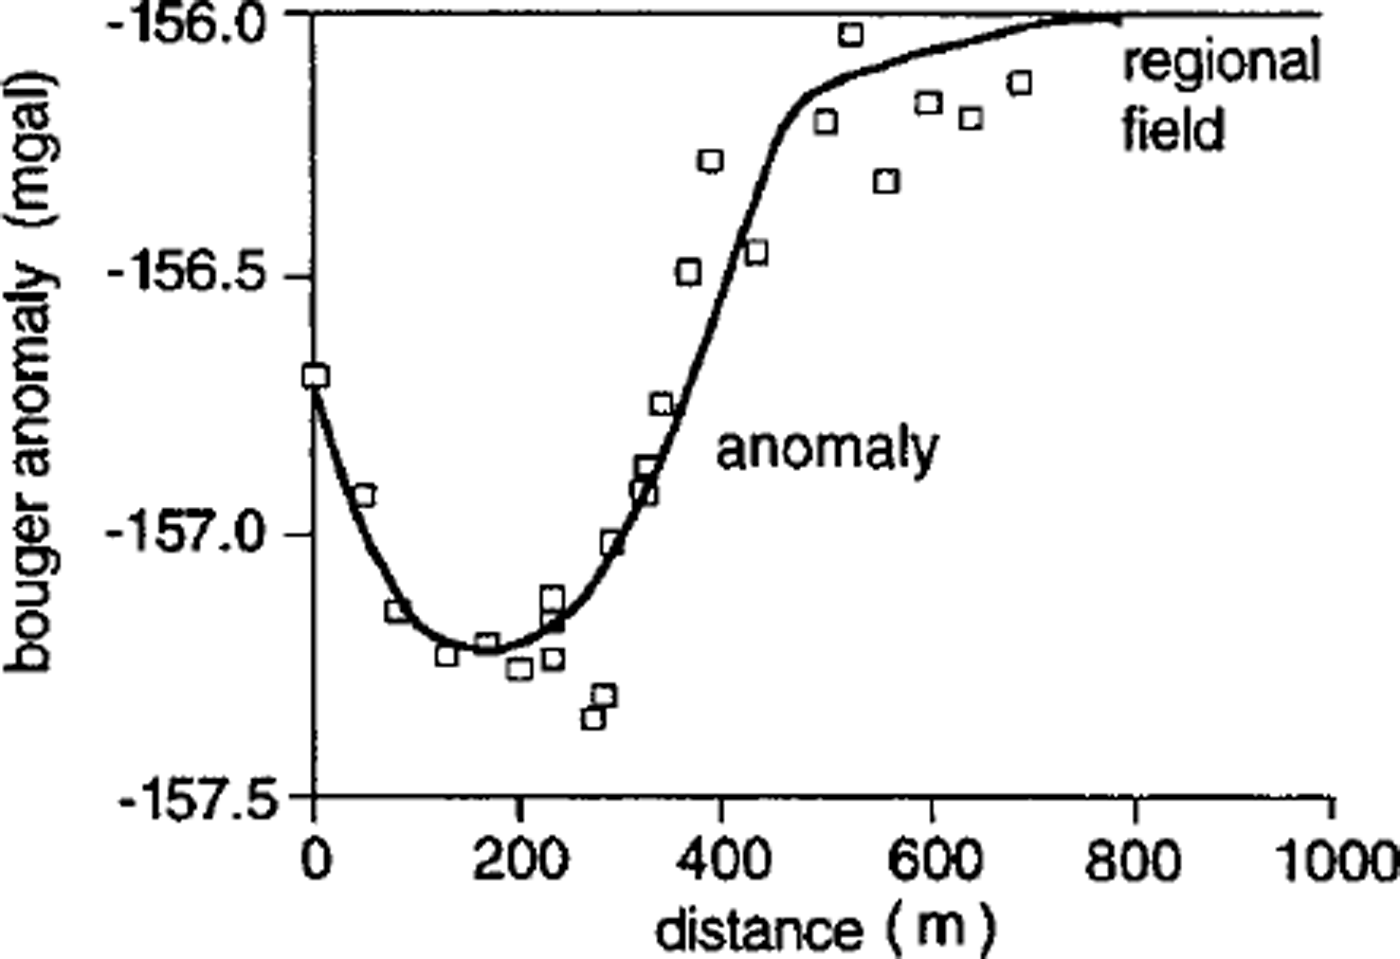
With total thickness and internal structure of the moraine being known from the seismic and geoelectrical soundings, gravimetry was applied to estimate density and porosity of the morainic material. As the gravity map of Switzerland (Reference Klingelé and OlivierKlingelé and Olivier, 1980) gives small gradients in the investigated area, the interpretation of the long profiles is based on the assumption that the regional gravity field is horizontal (−156.0 mgal). The resulting Bouguer anomaly for the moraine area is −1.2 mgal (Fig. 11), and the corresponding density contrast about 0.3 Mg m−3. Bedrock density was measured, using local samples, as 2.76 Mg m−3, giving an average density (ρ) of the moraine of roughly 2.4–2.5 Mg m−3, and a mean porosity (n) of 11% in air/rock mixtures and of 17% in water/rock mixtures. Such a low mean porosity points to a good overall consolidation with large amounts of fine sand, a phenomenon indeed observed in the subglacial channel excavated for the artificial drainage of Lake No. 3.
Regional and residual gravity field of a profile across the moraine dam along profiles P1 and P2 in Figure 1. (Lake No. 1 is to the left, and the bottom of the moraine to the right of plot) assuming a constant regional field of −156.0 mgal. The residual anomaly is up to −1.2 mgal.
Concerning the internal structure of the moraine as indicated by the results from the seismic and resistivity soundings, the entire deposit was treated in a second step as consisting of three main layers: the deepest layer was assumed to be water-saturated and to have average density, the intermediate layer to have air-filled pores and average density, and the uppermost layer to have air-filled pores but unknown density. A corresponding sensitivity study using variable thicknesses for the deepest and uppermost layer showed that near-surface layers of the moraine can have high to extremely high porosities if not real caverns, possibly from melting of buried ice or permafrost (Reference Vonder Mühll, Haeberli and KlingeléVonder Mühll and others, 1996). In fact, such a cavern with a diameter in the meter range had already been encountered during original construction work for the dam consisting of coarse blocks at Lake No. 1 where ice lenses had previously been found in an exploratory core drilling (cf. Reference HaeberliHaeberli, 1992). Thaw settlement from dead-ice melting is known to occur to the south of Lake No. 1, where photogrammetric analysis for the time interval 1976–94 indicates terrain subsidence at rates up to 0.3 m a−1 (Reference KääbKääb, 1996). Near the dam, however, the applied spacing for measurements of 25 m showed no significant changes in surface altitude.
Tracer experiments together with discharge and temperature measurements at the main springs of the area (Fig. 1) were carried out by members of ETH Zürich in June 1993 and by the University of Fribourg in June–August 1994 (Reference Gardaz and LugonGardaz and Lugon, unpublished; Reference SpeckSpeck, unpublished). The tracer experiments were difficult to interpret: fluorescine dye was injected where the meltwater stream between Lakes No. 3 and 1 disappeared into the ground, but reached two springs at the foot of the moraine apron in weak concentrations and only after several days. It must be assumed that the meltwater stream enters deeper layers of Lake No. 1 and that the dye had been dissolved by the lake volume and adsorbed by fine sediments at the lake bottom. Because discharge in the meltwater stream as measured by the salt dilution method corresponds to the discharge of the main spring at the foot of the moraine (A in Fig. 1), water from the northern part of Lake No. 1 must be connected with this main spring but percolates and flows through the moraine with velocities of 10−3 to 10−2 m s−1.
Water from the southern part of Lake No. 1 is connected to a number of smaller springs (B in Fig. 1) in the southern part of the moraine apron, which provide water with a delay of several days after the onset of overflow from the northern into the southern part of Lake No. 1 and the filling of the latter. This observation confirms the slow subsurface flow velocities estimated by the tracer experiments, and thus the generally low porosity of deeper layers in the moraine as indicated by the geophysical soundings. The bottom of the southern lake part is covered by a silty layer about 0.1–0.2 m thick. This layer is eroded where water from the northern lake part enters the depression of the southern lake part (Fig. 12). Because a discharge of 0.04 m3 s−1 filled the southern section of the lake within about 1 day, percolation into the underlying moraine via the gullies eroded into the silty lake bottom must be considerably less. Comparison with the total volume of the southern lake section (1–2 × 10³ m3) indicates a percolation rate of about 0.02 m3 s−1. Characteristic water temperatures of springs A and B were around 3°C. Since the water probably flows at depths between several tens of metres and 100 m below the surface, average temperatures inside the moraine apron are assumed to be 0–3°C. Given considerably colder temperatures during the Little Ice Age and maximum glacier advance around 1850 (Reference Haeberli and BenistonHaeberli and Beniston, 1998; Reference Maisch, Wipf, Denneler, Battaglia and BenzMaisch and others, 2000), it is highly probable that upper layers of the moraine apron had, at that time, been frozen underneath the cold glacier margins of the more extended polythermal glacier. Degradation of former subglacial permafrost with melting of ground ice could explain the weakly consolidated near-surface layers detected by the geophysical soundings. Permafrost still exists in an inactive, south-exposed rock glacier east of the moraine apron (Reference Haeberli, King and FlotronHaeberli and others, 1979). The corresponding spring (C in Fig. 1) has a temperature of about 1.5°C, a value which is typical for permafrost drainage.
Silty bottom of empty southern part of Lake No. 1; the view is towards the threshold between the southern and northern lake parts. Note small channels eroded to the gravelly bed (photo W. Haeberli, September 1992).

The combined consideration of all collected evidence shows that the moraine apron at Lake No. 1 (a) is up to > 100 m thick, (b) today contains no large bodies of buried ice or perennially frozen ground, but (c) could have been frozen in surface layers covered by the polythermal and more extended glacier tongue during the maximum stage of the Little Ice Age, (d) now has extremely loose parts near the surface, probably as a consequence of glacier retreat and permafrost degradation during the 20th century, (e) is well consolidated at greater depth, (f) only contains relatively thin water-saturated layers at the contact between the moraine and bedrock, and (g) discharges water from Lake No. 1 at great depths and slow rates. With respect to the safety of Lake No. 1, it was concluded that the 25–35° steep outer slope of the moraine dam as a whole could be considered stable against deep-seated sliding because of the low water saturation and good consolidation. It was, however, also clear that the loose material near its surface could be easily eroded by piping, shallow slope instability, backward incision of the breach or debris flows, possibly even in a combination of such processes with positive feedbacks between them. Hence, use could be made of the retention capacity represented by the lake basin, but uncontrolled flooding at the lake outlet and discharge of large water masses across the open moraine slope would have to be avoided.
Hazard-Mitigation Works
Based on the observations and measurements described above, it was assumed that
-
(1) thermokarst Lake No. 5 could soon drain in a dangerous way;
-
(2) the tongue of Grubengletscher would continue to shrink by downwasting rather than by retreat;
-
(3) Lake No. 3 would grow more and more in surface area and volume;
-
(4) the ice dam at Lake No. 3 could soon lower to the flotation threshold;
-
(5) future unforeseeable events could cause Lake No. 1 to spill over its dam consisting of coarse blocks and flood the steep, loose outer slope of the damming moraine; and
-
(6) internal erosion (piping) of loosely packed morainic material at the outlet structure of Lake No. 1 is conceivable in the case of high water level.
A hazard-mitigation scheme was therefore developed in cooperation with the authorities of the Community of Saas Balen, the Canton of Valais and the Swiss Confederation to prevent the future evolution of dangerous situations. This scheme was designed in such a way that the measures account for the special geotechnical conditions (ground ice, unfrozen–non-consolidated material), are adaptable to the rapidly changing situation and make best possible use of naturally occurring processes. The core of this strategy involved the decision to artificially empty Lake No. 5, to open a new periglacial outlet for Lake No. 3 and to enlarge the retention capacity of Lake No. 1 by deepening and reinforcing its outlet structure.
For the controlled emptying of Lake No. 5, pumping, syphoning, oblique drilling or tunnelling through the ice dam and construction of a V-shaped ditch were considered. In the fall of 1995, the lake was emptied almost entirely by pumping. This immediate but temporary measure gave the necessary time to effect measures at the lower Lakes No. 3 and 1 without flood risks from Lake No. 5 (Reference Kääb, Haeberli and TeysseireKääb and others, 1996). The slowly refilling Lake No. 5 was definitively drained in 1997 by the construction of a roughly 10 m deep V-shaped ditch. The formation of this ditch was initiated by artificial excavation of a slightly inclined channel down to the lake level and completed by downcutting through massive ground ice by the outflowing water.
The growing risk of large water volumes bursting out from Lake No. 3 was eliminated by lowering the lake level and reducing the lake surface area and volume. This was accomplished in summer 1996 by opening an approximately 2 m deep channel along the glacier margin and creating a periglacial outlet through the contact zone between the glacier and the rock glacier (Fig. 13). Removal of large, thermally insulating blocks of rock from the surface, and the effect of water running through the excavated channel may melt remains of frozen ground and enable continuous natural erosion of the channel to increasing depth, thereby further lowering lake level and volume. The excavated material was deposited in the lake and reduced its area and volume to a fraction of its original values.
Excavation of a drainage channel for ice-marginal Lake No. 3 (photo A. Kääb, 1995).

The overflow level of Lake No. 1 was lowered by about 2 m in summer 1996. The discharge capacity of the narrow concrete spillway through the existing dam (Fig. 14) consisting of coarse blocks is limited with regulating gates to 3 m3 s−1 in its lower part. This enables controlled outflow during events of suddenly rising lake level, and enlarges the retention capacity of the lake basin by about 50 000 m3. Inflow to, and outflow from, the outlet structure as well as the geometry of the foreland on the water side were adjusted by earthwork. During the fall of the same year, a grout curtain was created by injecting concrete through 10 m deep boreholes with a 1 m spacing. As a result, percolation distances underneath the dam consisting of coarse blocks became longer, reducing the hydraulic gradient and the potential for piping underneath the outlet structure. Ground-water levels are being observed on both sides of the grout curtain. The continuation of direct observations and special air-photo flights form an integral part of the hazard-mitigation scheme and should enable appropriate steps to be taken in time and according to the changes documented in the future.
New (lowered) flood-release (overflow) structure with regulating gates at proglacial Lake No. 1 (photo W. Haeberli, July 2000).

Conclusions and Perspectives for the Future
The work carried out at Grubengletscher described here illustrates the possibilities of early recognition, analysis and prevention of hazards arising from outbursts of periglacial lakes and resulting debris flows in high mountain areas. The combination of aerophotogrammetric analysis and geophysical ground-probing techniques proved especially useful with respect to judging ongoing developments, delineating possible future evolution and assessing geotechnical conditions for the installation of protection works. Long-term monitoring by direct observation and air-photo flights forms an invaluable planning basis under continuously changing ice conditions. In a scenario of future atmospheric cooling and glacier growth, situations would develop which are comparable with those now documented for the past decades. In a scenario of continued or even accelerated warming, however, the tongue of Grubengletscher could thin beyond available experience and even completely disappear. As a consequence, large water volumes partially dammed by (cold?) ice and frozen ground could collect in the area of the overdeepened glacier bed. Such a potentially hazardous development would be without historical precedent but could be recognized at an early stage on the basis of an adequate observation system.
The hazard-prevention project at Grubengletscher combined well-established with newly developed methods and techniques. It is hoped that the experience from the investigation at Grubengletscher provides some help and guidance for comparable cases which may develop at other mountain sites.
Acknowledgements
This work was a common effort of the University and ETH Zürich, the Community of Saas Balen, the Canton of Valais, the Swiss Confederation and the Swiss National Science Foundation through project No. 4031-034232 (Ice Melting and Natural Catastrophes in High Mountain Areas) of the Swiss National Research Programme 31 (Climate Change and Natural Catastrophes). The authorities and colleagues involved are gratefully acknowledged, and to the population of Saas Balen we express our deepest appreciation and thanks for collaboration and help. S. G. Evans (Geological Survey of Canada) and M. Jakob (EBA Engineering, Vancouver) provided constructive comments on an earlier version of the paper.
The present contribution is devoted to the memory of Lake No. 5 which had been a fascinating beauty during many years but became increasingly dangerous and had to be destroyed before its natural end. Its disappearance leaves mixed feelings of relief and regret.



