Introduction
Appetite-regulating peptides and anorexia nervosa (AN)
Although the pathophysiology of AN is not completely understood, an imbalance in appetite-regulating neuropeptides of the central nervous system has been associated with this eating disorder (Inui, Reference Inui2001; Monteleone et al. Reference Monteleone, Castaldo and Maj2008). In humans, food intake and energy homeostasis are regulated by several hypothalamic neuropeptides. In particular, the central melanocortin system and its components are known to play an important role in the control of these biological functions (Hillebrand et al. Reference Hillebrand, Kas and Adan2006a). Within the melanocortin system, agouti-related protein (AGRP) acts as a powerful orexigenic peptide that increases food intake and decreases energy expenditure. It is expressed in the hypothalamic arcuate nucleus by neurons co-expressing neuropeptide Y, another orexigenic mediator (Graham et al. Reference Graham, Shutter, Sarmiento, Sarosi and Stark1997; Rossi et al. Reference Rossi, Kim, Morgan, Small, Edwards, Sunter, Abusnana, Goldstone, Russell, Stanley, Smith, Yagaloff, Ghatei and Bloom1998; Lu et al. Reference Lu, Nicholson, Akil and Watson2001; Goto et al. Reference Goto, Inui, Takimoto, Yuzuriha, Asakawa, Kawamura, Tsuji, Takahara, Takeyama, Katsuura and Kasuga2003).
AGRP is an endogenous antagonist (inverse agonist) of α-melanocyte-stimulating hormone (α-MSH, derived from pro-opiomelanocortin) at the melanocortin 4 and melanocortin 3 receptors (Fong et al. Reference Fong, Mao, MacNeil, Kalyani, Smith, Weinberg, Tota and van der Ploeg1997; Yang et al. Reference Yang, Thompson, Dickinson, Wilken, Barsh, Kent and Gantz1999; Nijenhuis et al. Reference Nijenhuis, Oosterom and Adan2001). Both AGRP and α-MSH are downstream mediators of leptin, a protein that is primarily secreted by peripheral adipocytes (Zhang et al. Reference Zhang, Proenca, Maffei, Barone, Leopold and Friedman1994). Leptin communicates the abundance of available energy stores to the central nervous system, reducing food intake and increasing energy expenditure, thus leading to a decrease in body weight (Elmquist et al. Reference Elmquist, Elias and Saper1999; Zhang et al. Reference Zhang, Chen, Heiman and Dimarchi2005; Hebebrand et al. Reference Hebebrand, Muller, Holtkamp and Herpertz-Dahlmann2007). AGRP neurons in the hypothalamic arcuate nucleus express leptin receptors (Ollmann et al. Reference Ollmann, Wilson, Yang, Kerns, Chen, Gantz and Barsh1997), and application of leptin reduces secretion of AGRP in hypothalamic neurons in vitro and in animal models (Ebihara et al. Reference Ebihara, Ogawa, Katsuura, Numata, Masuzaki, Satoh, Tamaki, Yoshioka, Hayase, Matsuoka, Aizawa-Abe, Yoshimasa and Nakao1999). Hence, AGRP neurons are stimulated during fasting and inhibited in the overfed state (Hagan et al. Reference Hagan, Rushing, Schwartz, Yagaloff, Burn, Woods and Seeley1999; Mizuno & Mobbs, Reference Mizuno and Mobbs1999).
AGRP – previous findings
Results of clinical investigations on AGRP, and its role in obesity and fasting have been contradictory. Studies in obese men have revealed elevated plasma AGRP levels, as well as positive correlations with leptin and body mass index (BMI) (Katsuki et al. Reference Katsuki, Sumida, Gabazza, Murashima, Tanaka, Furuta, Araki-Sasaki, Hori, Nakatani, Yano and Adachi2001; Hoggard et al. Reference Hoggard, Johnstone, Faber, Gibney, Elia, Lobley, Rayner, Horgan, Hunter, Bashir and Stubbs2004). In obese individuals, fasting over a period of 6 days did not affect plasma levels of AGRP. However, individuals with normal weight showed significantly increased AGRP, and decreased leptin levels after 6 days of food deprivation (Hoggard et al. Reference Hoggard, Johnstone, Faber, Gibney, Elia, Lobley, Rayner, Horgan, Hunter, Bashir and Stubbs2004). AGRP was also elevated in lean subjects after 11 h of fasting (Shen et al. Reference Shen, Wu, Shearman, Camacho, Tota, Fong and van der Ploeg2002). Another study showed that leptin administration prevented the increase of AGRP following food deprivation (Gavrila et al. Reference Gavrila, Chan, Miller, Heist, Yiannakouris and Mantzoros2005). These differences between obese and lean individuals might indicate dysregulations within the melanocortin system in patients with obesity (Katsuki et al. Reference Katsuki, Sumida, Gabazza, Murashima, Tanaka, Furuta, Araki-Sasaki, Hori, Nakatani, Yano and Adachi2001) and possibly other eating disorders.
AGRP and AN
Several lines of evidence suggest that AGRP plays a role in the pathophysiology of AN. First, genetic studies have shown: (1) associations between a non-synonymous single nucleotide polymorphism in the AGRP gene, Ala67Thr, and AN (Vink et al. Reference Vink, Hinney, van Elburg, van Goozen, Sandkuijl, Sinke, Herpertz-Dahlmann, Hebebrand, Remschmidt, van Engeland and Adan2001; Dardennes et al. Reference Dardennes, Zizarri, Tolle, Foulon, Kipman, Romo, Iancu-Gontard, Boni, Sinet, Bluet, Estour, Mouren, Guelfi, Rouillona, Gorwood and Epelbaum2007); (2) healthy controls homozygous for the Thr-allele in AGRP are resistant to late-onset obesity; and (3) Ala67Thr is consistently associated with a reduction of body weight, BMI, fat mass and leptin (Marks et al. Reference Marks, Boucher, Lanouette, Pérusse, Brookhart, Comuzzie, Chagnon and Cone2004). Second, rodent models of AN have revealed that central infusions of AGRP prevent semi-starvation-induced hyperactivity, a characteristic symptom of AN (Davis et al. Reference Davis, Katzman, Kaptein, Kirsh, Brewer, Kalmbach, Olmsted, Woodside and Kaplan1997), and stimulate food intake (Kas et al. Reference Kas, van Dijk, Scheurink and Adan2003; Hillebrand et al. Reference Hillebrand, Kas and Adan2006b). Finally, a pilot study in patients with AN revealed significantly elevated plasma AGRP concentrations and a negative correlation with leptin (Moriya et al. Reference Moriya, Takimoto, Yoshiuchi, Shimosawa and Akabayashi2006).
Objective
These findings have contributed greatly to our understanding of the relationship of AGRP with eating disorders; however, it remains to be elucidated if and how AGRP contributes to the pathogenesis and maintenance of AN. Specifically, the regulation of plasma AGRP during and after weight gain has not been investigated. To date, it is unclear if changes in AGRP plasma concentrations in AN merely reflect the patient's current state of undernutrition (state marker), or if the AGRP system is dysregulated in general in these individuals (trait marker). In the latter case, abnormal AGRP plasma levels could be expected during all stages of the disorder, as well as in fully weight-restored patients.
The aim of the present study was to differentiate state from trait markers by investigating AGRP plasma levels in patients with acute AN and in patients after partial and full weight restoration in comparison with a group of healthy females. In addition, we explored the relationships between AGRP and leptin and obtained measures of psychopathology.
Method
Patient population
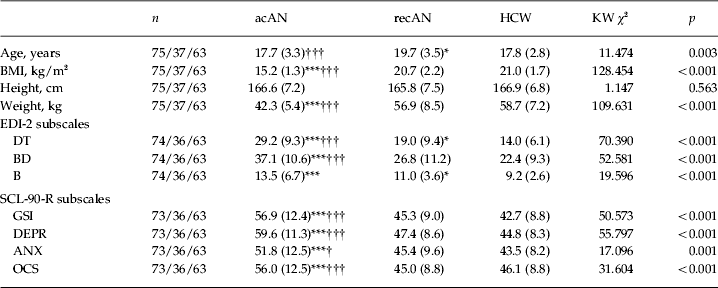
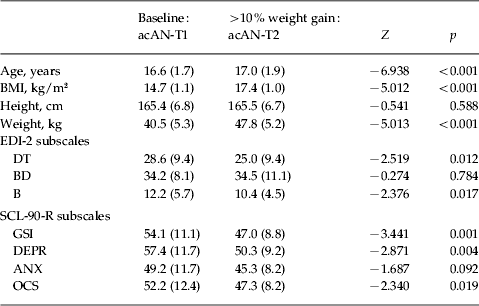
The sample population (see Table 1) consisted of 75 female patients with acute AN (acAN, aged 12–28 years), 37 subjects who had successfully restored their weight (recAN, aged 14–29 years) and 63 healthy control women (HCW, aged 13–25 years). A total of 33 patients of the acAN group were reassessed after partial weight restoration. We refer to these patients as acAN-T1 at baseline and acAN-T2 after partial weight gain (see Table 2).
Clinical and hormonal characteristics of patients with acAN and recAN and HCW: descriptive statistics and results of KW ANOVA

Data are given as mean (standard deviation).
acAN, Acute anorexia nervosa; recAN, weight-restored anorexia nervosa; HCW, healthy control women; KW, Kruskal–Wallis; ANOVA, analysis of variance; BMI, body mass index; EDI, Eating Disorder Inventory; DT, drive for thinness; BD, body dissatisfaction; B, bulimia; SCL-90-R, Symptom Checklist 90 – Revised; GSI, global severity index; DEPR, depression; ANX, anxiety; OCS, obsessive-compulsive symptoms.
Mean value was significantly different from that of the HCW:
* p<0.05, *** p⩽0.001 (Mann–Whitney U test).
Mean value was significantly different from that of the recAN group: † p<0.05, ††† p⩽0.001 (Mann–Whitney U test).
Clinical and hormonal characteristics of a subset of 33 acAN subjects before (acAN-T1) and after (acAN-T2) short-term weight restoration

Data are given as mean (standard deviation) and results of Wilcoxon tests.
acAN, Acute anorexia nervosa; acAN-T1, acAN patients at baseline; acAN-T2, acAN patients after partial weight gain; BMI, body mass index; EDI, Eating Disorder Inventory; DT, drive for thinness; BD, body dissatisfaction; B, bulimia; SCL-90-R, Symptom Checklist 90 – Revised; GSI, global severity index; DEPR, depression; ANX, anxiety; OCS, obsessive-compulsive symptoms.
Participants diagnosed with acAN according to DSM-IV-TR (54 of the restrictive subtype and 21 of the binge-eating/purging subtype) were recruited within 1 week after admission to the eating disorder programs of either a university child and adolescent psychiatry department or a psychosomatic medicine department. All acAN patients were enrolled in a behaviorally oriented nutritional rehabilitation program and were encouraged to gain at least 500 g of body weight weekly. Following a weight gain of 10%, but less than 35%, 33 of these acAN patients were reassessed.
We also included female subjects who had been previously treated for AN and who had successfully restored a healthy weight. The criteria for ‘weight-restored’ subjects were:
(1) maintain a BMI>18.5 kg/m2 (if older than 18 years) or more than the tenth BMI percentile (if younger than 18 years; Kromeyer-Hauschild et al. Reference Kromeyer-Hauschild, Wabitsch and Kunze2001) for at least 3 months prior to the investigation;
(2) menstruate (at least two times within the 3 months preceding the investigation);
(3) have maintained abstinence from binging, purging or engaging in significant restrictive eating patterns for at least 3 months before the investigation.
A matched sample of 63 healthy women who were normal-weight and eumenorrheic served as a control group. They were recruited through advertisement among middle school, high school and university students.
Exclusion criteria and possible confounding variables were obtained using a semi-structured research interview [the Structured Interview of Anorexia Nervosa and Bulimic Syndromes (SIAB-EX); Fichter & Quadflieg, Reference Fichter and Quadflieg1999] and by physical examination. For acAN and recAN patients, we derived information on co-morbid psychiatric diagnoses other than eating disorders from medical records. For the HCW, the lifetime history of psychiatric illnesses was determined by the semi-structured interview. HCW were excluded if they had any history of psychiatric illness. Patients were excluded if they had a lifetime history of any of the following clinical diagnoses: organic brain syndrome, schizophrenia, bipolar illness, substance dependence, bulimia nervosa or binge eating disorder. Further exclusion criteria for all participants were IQ less than 85, current inflammatory, neurological or metabolic illness, chronic bowel diseases, cancer, clinically significant anemia, pregnancy, breast feeding; current use of acetylsalicylic acid, cortisone, antibiotics, antihypertensive medication; and use of antidepressants, antipsychotics or any other psychotropic medications or substances within the 6 weeks preceding the investigation.
This study was approved by the Institutional Review Board of the Charité – Universitätsmedizin Berlin. All participants (and, if under the age of 18 years, their guardians) provided written informed consent.
Clinical measures
For all participants current and/or past diagnoses of eating disorders were ascertained by evaluation of the expert form of the SIAB (Fichter & Quadflieg, Reference Fichter and Quadflieg1999). The SIAB-EX for subjects aged between 12 and 65 years is an 87-item semi-standardized interview that assesses the prevalence and severity of specific eating-related psychopathology over the past 3 months. The interview provides diagnoses according to ICD-10 and DSM-IV. Internal consistency was good, and interrater reliability ranged from 0.86 to 0.96 (Fichter & Quadflieg, Reference Fichter and Quadflieg2001). Interviews were conducted by clinically experienced and trained research assistants under the supervision of the attending child and adolescent psychiatrist.
Eating disorder-specific psychopathology was assessed using the Eating Disorder Inventory (EDI-2), a self-report questionnaire comprising 91 items forming eleven scales (Rathner & Waldherr, Reference Rathner and Waldherr1997). Response categories range from 1 ‘never’ to 6 ‘always’. The three core eating disorder symptoms ‘drive for thinness’, ‘body dissatisfaction’ and ‘bulimia’ were part of the confirmatory analyses of this study.
General levels of psychopathology such as self-reported depression were determined using the global severity index (GSI) of the Symptom Checklist 90 – Revised (SCL-90-R) (Franke, Reference Franke2002). Based on previous results investigating psychiatric co-morbidities in a highly similar patient population (Salbach-Andrae et al. Reference Salbach-Andrae, Lenz, Simmendinger, Klinkowski, Lehmkuhl and Pfeiffer2008), we also chose to screen patients and controls for depressive (DEPR), anxious (ANX) and obsessive-compulsive symptoms (OCS) using the SCL-90-R (Franke, Reference Franke2002).
Blood collection and biochemical assessments
Within the first days of treatment initiation, venous blood samples of 9 ml were collected into vacutainer tubes containing ethylenediaminetetraacetic acid between 07:30 and 09:30 hours after the subjects had fasted overnight. For acAN patients, these procedures were preformed on the ward; recAN patients and HCW were asked to fast overnight and come to our department for a scheduled venepuncture between 07:30 and 09:30 hours. After centrifugation of the blood (800 g for 15 min), plasma samples were frozen and stored at −80°C until analysed.
We measured endogenous levels of AGRP in the thawed plasma samples using commercial enzyme-linked immunosorbent assay kits (ELISA; R&D Systems, USA) according to the manufacturer's instructions. Analytical sensitivity of the test ranged from 0.17 pg/ml to 2.68 pg/ml.
Plasma leptin concentrations were determined using a commercial Human Leptin ‘Dual Range’ ELISA kit (Millipore, USA), following the manufacturer's recommendations. Depending on the dilution factor specified in the protocol, sensitivity was 0.125–20 ng/ml or 0.5–100 ng/ml.
Statistical analyses
Due to violations of homogeneity of variances for plasma leptin concentrations, non-normality of plasma AGRP levels, and unequal group sizes, differences between the groups were examined with non-parametric methods such as the Kruskal–Wallis one-way analysis of variance (ANOVA) and subsequent Mann–Whitney U tests. The Wilcoxon signed-rank test was employed for longitudinal data. We calculated correlations using two-tailed Spearman rank-order correlation coefficients. All tests were two-tailed and a value of p<0.05 was defined as statistically significant. Results were analysed using the SPSS statistical software package version 16.0 (SPSS Inc., USA). Unless indicated otherwise, we presented all values as means and standard deviations.
Results
Sample characteristics
Table 1 summarizes clinical characteristics and hormonal variables of patients with acAN and recAN, and HCW. There were no significant differences in height between the three study groups or in mean age between acAN patients and HCW, but recAN patients were significantly older than acAN patients and HCW. BMI and plasma leptin concentrations in acAN subjects were lower in comparison to recAN subjects and HCW. There were no significant differences in BMI and plasma leptin concentrations of recAN patients when compared with HCW.
A subset of 33 patients of the acAN group was reinvestigated after partial weight restoration [acAN-T1 at baseline, acAN-T2 after partial weight gain; second time point 140.2 (s.d.=136.9) days after the baseline assessment; weight gain 7.2 (s.d.=2.2) kg]. Mean BMI, leptin, height and age of acAN-T1 patients were not significantly different from the acAN patients who were not followed up. After partial weight restoration, BMI and leptin concentrations in the acAN-T2 group were significantly elevated when compared with baseline evaluation (Table 2). However, in comparison with HCW, BMI and leptin levels were still significantly lower in acAN-T2 patients after partial weight gain.
AGRP: state or trait marker?
Kruskal–Wallis one-way ANOVA revealed significant overall group differences in AGRP between acAN and recAN patients and HCW (Fig. 1). Plasma AGRP in acAN patients was significantly higher when compared with HCW as well as compared with recAN patients. There were no statistically significant differences between the recAN and HCW groups. Following partial weight restoration in AN patients, plasma AGRP levels in the acAN-T2 group had decreased significantly to a value comparable with HCW (Fig. 2).
Plasma agouti-related protein (AGRP, ▪) and leptin levels (
 ) in patients with acute anorexia nervosa (acAN), patients with weight-restored anorexia nervosa (recAN) and healthy control women (HCW). Values are means, with standard deviations represented by vertical bars. * Mean value is significantly different from that of the acAN group (p<0.05; Mann–Whitney U test following Kruskal–Wallis one-way analysis of variance). Patients with acAN had significantly increased AGRP levels when compared with HCW (U=1756.000, p=0.01) and recAN (U=1016.000, p=0.022). AGRP in acAN was 123.6 (s.d.=71.0) pg/ml, in recAN 94.7 (s.d.=46.0) pg/ml and in HCW 95.6 (s.d.=45.0) pg/ml. Mean leptin levels are plotted for comparison. Patients with acAN had significantly lower plasma leptin levels when compared with HCW (U=139.500, p<0.001) and recAN (U=192.000, p<0.001). Leptin in acAN was 1.18 (s.d.=1.70) μg/l, in recAN 11.58 (s.d.=12.32) μg/l and in HCW 12.63 (s.d.=8.32) μg/l.

Plasma agouti-related protein (AGRP, ▪) and leptin levels (
 ) in patients with acute anorexia nervosa after short-term weight restoration (acAN-T2) and healthy control women (HCW). Values are means, with standard deviations represented by vertical bars. There were no significant differences in plasma AGRP (U=998.000, p=0.749), but leptin levels were significantly lower in acAN-T2 (U=508.000, p<0.001). AGRP in acAN-T2 was 92.9 (s.d.=33.2) pg/ml, and in HCW 95.6 (s.d.=45.0) pg/ml. Leptin in acAN-T2 was 6.42 (s.d.=6.70) μg/l, and in HCW 12.63 (s.d.=8.32) μg/l.

Relationship between AGRP and nutritional parameters (leptin, BMI)
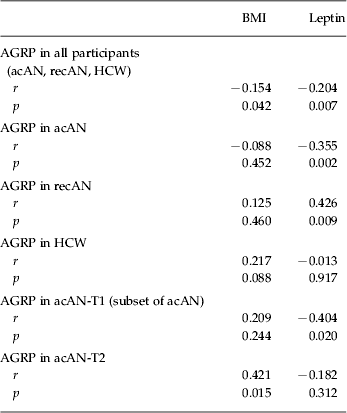
The associations of AGRP with leptin and BMI are shown in Table 3. When combining all study participants (acAN, recAN, HCW), we found significant negative correlations between AGRP and leptin, as well as between AGRP and BMI. When considered separately, we found a significant negative correlation between AGRP and leptin in acAN subjects. In AN patients after partial weight restoration and in HCW, AGRP and leptin were not related. However, in recAN patients there was a significant positive correlation between AGRP and leptin.
Relationship of AGRP and nutritional parameters (leptin and BMI)

Data are descriptive correlations: Spearman rank-order correlation coefficients.
AGRP, Agouti-related protein; BMI, body mass index; acAN, patients with acute anorexia nervosa; recAN, patients with weight-restored anorexia nervosa; HCW, healthy control women; acAN-T1, acAN at baseline (before short-term weight restoration); acAN-T2, acAN after partial weight gain (after short-term weight restoration).
Relationship of AGRP and psychopathology
acAN subjects reported significantly more eating disorder-specific and general levels of psychopathology than recAN subjects and HCW (Table 1). An exploratory analysis comparing plasma AGRP levels between acAN patients of the restrictive subtype with those of the binge/purge subtype showed no statistically significant differences between the two subgroups [AGRP in patients with restrictive AN was 122.2 (s.d.=70.2) pg/ml, AGRP in patients with the binge/purge subtype was 127.2 (s.d.=74.7) pg/ml; U=541.000, p=0.759].
Spearman correlation coefficients were calculated to analyse possible associations between plasma AGRP and psychological measures (EDI-2 core subscales ‘drive for thinness’, ‘bulimia’ and ‘body dissatisfaction’; SCL-90-R GSI and SCL-90-R subscales DEPR, ANX and OCS). Among all participants, AGRP was significantly positively correlated with the EDI-2 subscales ‘bulimia’ (r=0.159, p=0.036) and ‘body dissatisfaction’ (r=0.151, p=0.048). In addition, there was a significant positive correlation between AGRP concentration and the SCL-90-R ‘global severity index’ (r=0.169, p=0.027). AGRP did not correlate with age, use of contraceptive medication, smoking or excessive physical activity.
Discussion
This is the first study providing data on the regulation of AGRP during and after weight restoration in patients with AN. In contrast to increased AGRP in subjects with acute AN, AGRP in weight-restored AN patients was similar to that in healthy controls. Elevated AGRP in patients with acute AN normalized during weight gain. In addition we found relationships between AGRP and indicators of undernutrition such as BMI and plasma leptin.
Hypothesis I: AGRP – state or trait marker?
AGRP is known to be one of the most important orexigenic mediators in the hypothalamus, by stimulating food intake at times of negative energy balance. In rats, AGRP increased food intake up to 1 week after one single intracerebroventricular injection (Rossi et al. Reference Rossi, Kim, Morgan, Small, Edwards, Sunter, Abusnana, Goldstone, Russell, Stanley, Smith, Yagaloff, Ghatei and Bloom1998). Moreover, transgenic overexpression of AGRP led to increased food consumption and obesity in rodents (Graham et al. Reference Graham, Shutter, Sarmiento, Sarosi and Stark1997; Rossi et al. Reference Rossi, Kim, Morgan, Small, Edwards, Sunter, Abusnana, Goldstone, Russell, Stanley, Smith, Yagaloff, Ghatei and Bloom1998; Lu et al. Reference Lu, Nicholson, Akil and Watson2001). In studies of healthy, normal-weight humans, fasting led to an increase of AGRP (Shen et al. Reference Shen, Wu, Shearman, Camacho, Tota, Fong and van der Ploeg2002; Hoggard et al. Reference Hoggard, Johnstone, Faber, Gibney, Elia, Lobley, Rayner, Horgan, Hunter, Bashir and Stubbs2004; Gavrila et al. Reference Gavrila, Chan, Miller, Heist, Yiannakouris and Mantzoros2005).
Our results emphasize the effect of undernutrition and hypoleptinemia on peripheral AGRP concentrations. Increased AGRP in acAN, but not in recAN patients reflects the undernutrition characteristic of acAN, rather than a disease-specific trait. The assumption, that AGRP in AN represents a state marker of the disease, is also substantiated by our longitudinal results. AGRP plasma levels were significantly lower in AN patients after partial weight recovery, and similar to those observed in healthy controls at this second time point. In contrast to AGRP, BMI and leptin concentrations where still significantly lower in AN patients after partial weight gain, when compared with healthy subjects. Thus, initially elevated AGRP levels normalized with weight gain, and reached normal concentrations faster than initially decreased leptin levels. This might indicate that different hormonal systems with relevance to energy homeostasis do not equilibrate at the same rate, or at the same time, in patients with AN during weight gain. However, the possible implications of this variance in the time necessary for reconstitution requires further research.
Human data from studies in healthy individuals provide further evidence for the hypothesis that increased AGRP is a state marker related to the extent of undernutrition. Significantly elevated AGRP and decreased leptin levels were found in lean participants after 6 days of food deprivation (Hoggard et al. Reference Hoggard, Johnstone, Faber, Gibney, Elia, Lobley, Rayner, Horgan, Hunter, Bashir and Stubbs2004). In addition, AGRP in healthy subjects fasting overnight dropped significantly 2 h after breakfast, but continued food deprivation for an additional 2 h resulted in significantly increased AGRP (Shen et al. Reference Shen, Wu, Shearman, Camacho, Tota, Fong and van der Ploeg2002).
Hypothesis II: relationship of AGRP and nutritional parameters (leptin, BMI)
In energy homeostasis, AGRP is a downstream mediator of leptin. In animal models, leptin increased energy expenditure and decreased food consumption in the overfed state by inhibiting AGRP-expressing neurons (Hagan et al. Reference Hagan, Rushing, Schwartz, Yagaloff, Burn, Woods and Seeley1999; Mizuno & Mobbs, Reference Mizuno and Mobbs1999). Also, leptin administration reduced secretion of AGRP in hypothalamic neurons in vitro and in animal models (Ebihara et al. Reference Ebihara, Ogawa, Katsuura, Numata, Masuzaki, Satoh, Tamaki, Yoshioka, Hayase, Matsuoka, Aizawa-Abe, Yoshimasa and Nakao1999), while AGRP secretion was increased during undernutrition (Mizuno & Mobbs, Reference Mizuno and Mobbs1999).
In line with previously published results (Moriya et al. Reference Moriya, Takimoto, Yoshiuchi, Shimosawa and Akabayashi2006), we found significant negative correlations between AGRP and leptin, as well as between AGRP and BMI among all study participants. Patients in the acute state of AN showed significant negative correlations between AGRP and leptin. Thus, the undernutrition, negative energy balance, and hypoleptinemia characteristic of acAN may lead to increased AGRP plasma levels in order to stimulate food intake and decrease energy expenditure.
In contrast, in our sample of weight-restored AN patients, we found statistically significant positive correlations between AGRP and leptin. This was somewhat unexpected and raises the question of whether the regulation of energy homeostasis may be aberrant in recAN as a result of the illness. Interestingly, a positive correlation between AGRP and leptin (as well as BMI) has also been reported to occur in obese men (Katsuki et al. Reference Katsuki, Sumida, Gabazza, Murashima, Tanaka, Furuta, Araki-Sasaki, Hori, Nakatani, Yano and Adachi2001; Hoggard et al. Reference Hoggard, Johnstone, Faber, Gibney, Elia, Lobley, Rayner, Horgan, Hunter, Bashir and Stubbs2004). However, our results regarding mean plasma AGRP levels, leptin levels and BMI did not indicate an obese phenotype in weight-restored AN patients. Nonetheless, previous studies have shown that, in patients with AN, weight gain is associated with an abnormal distribution of body fat, being disproportionately deposited around the waist and the abdominal cavity (Mayer et al. Reference Mayer, Walsh, Pierson, Heymsfield, Gallagher, Wang, Parides, Leibel, Warren, Killory and Glasofer2005). Hence, positive associations between AGRP and leptin in weight-restored AN could reflect a sustained positive energy balance in these patients. Studies of AGRP in long-term recovered AN patients could help to determine whether the correlation we observed is secondary to the nature of weight gain and fat distribution during the early phases of AN recovery, and if endocrine parameters, such as leptin and AGRP, could be used as biomarkers to monitor nutritional recovery in AN patients in the future.
Dysregulations within the melanocortin system might contribute to the development of obesity (Katsuki et al. Reference Katsuki, Sumida, Gabazza, Murashima, Tanaka, Furuta, Araki-Sasaki, Hori, Nakatani, Yano and Adachi2001), as well as to the pathophysiology of AN. For AN, a complex dysregulation, or ‘mixed signaling’, of neuroendocrine mediators controlling energy homeostasis has been proposed (Inui, Reference Inui2001). According to this hypothesis, energy homeostasis breaks down due to the simultaneous up-regulation of anorexigenic and orexigenic signals. For instance, we were recently able to show evidence suggestive of increased α-MSH expression in the presence of suppressed leptin levels in patients with acute AN (Ehrlich et al. Reference Ehrlich, Weiss, Burghardt, Infante-Duarte, Brockhaus, Muschler, Bleich, Lehmkuhl and Frieling2010b). Further studies are needed to investigate the interaction of neuroendocrine mediators involved in energy homeostasis in the acute state of AN, as well as during and after weight restoration.
Hypothesis III: relationship between AGRP and psychopathology
Elevated AGRP concentrations were positively associated with ‘body dissatisfaction’, ‘bulimia’ and the ‘global severity index’. While the positive relationships between AGRP concentrations and ‘body dissatisfaction’ as well as global symptoms may be explained by severity of illness, the effect of bulimic symptoms is not easy to understand. A positive correlation between AGRP and bulimic behaviors is consistent with previous findings: we and others reported a leptin-lowering effect of bulimic symptoms (Monteleone et al. Reference Monteleone, Di Lieto, Tortorella, Longobardi and Maj2000, Reference Monteleone, Martiadis, Colurcio and Maj2002; Ehrlich et al. Reference Ehrlich, Burghardt, Schneider, Hein, Weiss, Pfeiffer, Lehmkuhl and Salbach-Andrae2009). Possibly, bulimic behaviors reinforce changes within the melanocortin system. However, regarding circulating AGRP, we found no differences between the restrictive subtype and the binge/purge subtype of AN.
Limitations
The findings of this study should be considered in light of the following limitations. First, the mediators investigated in our study were measured in peripheral blood. Nonetheless, there is considerable evidence that plasma AGRP levels reflect central AGRP concentrations (Ollmann et al. Reference Ollmann, Wilson, Yang, Kerns, Chen, Gantz and Barsh1997; Shutter et al. Reference Graham, Shutter, Sarmiento, Sarosi and Stark1997; Li et al. Reference Li, Finniss, Yang, Zeng, Qu, Barsh, Dickinson and Gantz2000). Second, endocrine mediators other than AGRP and leptin are also involved in the central regulation of food intake and energy homeostasis. For example, the hypothalamic regulation of appetite, motivational and hedonic aspects of food intake involve the dopaminergic system (Berridge, Reference Berridge2009; Kaye et al. Reference Kaye, Fudge and Paulus2009; Frieling et al. Reference Frieling, Römer, Scholz, Mittelbach, Wilhelm, De Zwaan, Jacoby, Kornhuber, Hillemacher and Bleich2010), and the serotonergic system modulates food intake and the social aspects of eating (Ehrlich et al. Reference Ehrlich, Franke, Schott, Salbach-Andrae, Pfeiffer, Lehmkuhl and Uebelhack2008, Reference Ehrlich, Franke, Scherag, Burghardt, Schott, Schneider, Brockhaus, Hein, Uebelhack and Lehmkuhl2010a).
Conclusion
In summary, the results of our study suggest an effect of undernutrition and hypoleptinemia on peripheral AGRP concentrations in individuals with AN. Patients in the acute state of the illness show elevated AGRP levels in comparison with healthy subjects and weight-restored AN patients. During weight gain, circulating AGRP levels decrease, and weight-restored patients show normalized AGRP concentrations when compared with healthy controls. Thus, changes in AGRP represent the current nutritional state, rather than an AN-specific trait. However, the relationship between AGRP and leptin in recAN patients was reversed when compared with acAN patients, but not in HCW compared with acAN patients. Further studies are needed to investigate possible dysregulations within the melanocortin system in weight-restored patients with AN.
Acknowledgements
We thank Andrea Oskamp for help with the recruitment of the participants, Dirk Megow, Josef Priller and Ulrich Dirnagel for permission to use their ELISA reader and Alexandra Cheetham for help with the manuscript preparation. S.E. was supported by a fellowship of the German Research Foundation. The research was also supported by the Charité Research Fund.
Declaration of Interest
R.B. has consulted for Shire, Germany.