Implications
The current structure of the Campolina population indicate a small effective population size and an increasing inbreeding coefficient on a historically recent horse breed. Results here reported indicate how states/regions may influence population stratification and genetic connectedness between family groups. This study can also be interpreted as a guideline for possible impacts of inbreeding over conformation traits in horses, as inbreeding depression was detected for all studied traits.
Introduction
The Brazilian gaited horse breed Campolina was founded in Minas Gerais (MG) state around 1870, making use of European stallions, such as the Anglo-Norman horse, Clydesdale, Holsteiner, Percheron and Thoroughbred in a crossbred herd of Iberian mares (Procópio, Reference Procópio, Bergmann and Costa2003). In 1951, it was founded the Campolina horse breeder’s association and today the Campolina horse is the sixth larger horse herd in Brazil and the third of the Brazilian gaited horses (Vieira et al., Reference Vieira, de Rezende, Lana, Barcelos, Santiago, Lage, Fonseca and Bergmann2015). The economic–social development at the MG state was historically linked to horse breeding (Rezende and Moura, Reference Rezende and Moura2004), therefore the Campolina horse has economical and historical importance in Brazil.
The selection process in the Campolina breed has been based primarily on results from horse shows and gait competitions, while inbreeding has been unrestrictedly considered by breeders. As this situation could cause loss of genetic variability due to the increase of inbreeding (Duru, Reference Duru2017), the possibility of inbreeding depression should be investigated. For the proper management of domestic populations, it is important to maintain genetic variability at a high level (Hasler et al., Reference Hasler, Flury, Menet, Haase, Leeb, Simianer, Poncet and Rieder2011). The increase on average inbreeding coefficient has a negative impact on the effective population size and reduces the genetic diversity (GD) (Frankham et al., Reference Frankham, Ballou and Briscoe2010).
The impacts of high levels of inbreeding can affect morphological traits (Gómez et al., Reference Gómez, Valera, Molina, Gutiérrez and Goyache2009), and, indirectly reproductive and survival rates. In horses, inbreeding depression has been associated to a decrease on juvenile survival, and the individuals that survive until adult ages show lowered growth rate and fertility, inability to mate, reduced fecundity and parental care (Collins et al., Reference Collins, Songsasen, Vick, Wolfe, Weiss, Keefer and Monfort2012). Therefore, the aim of this study was to describe the structure of the Campolina breed population, with emphasis in the effective population size and characterization of stratification, and to analyze the impact of inbreeding on morphological traits.
Material and methods
Data and pedigree analysis
Generation interval
Were considered genealogical records from 107 951 animals (born between 1960 and 2014) and morphological measurements from 43 465 individuals. All data were provided by the Brazilian Campolina Horse Breeders Association (ABCCCampolina). The generation interval is the average age of parents at the birth of their selected (with progeny records) offspring (Falconer and Mackay, Reference Falconer and Mackay1996). The generations intervals of four possible selection lines, sire to son, sire to daughter, dam to son and dam daughter were calculated.
Effective population size
The effective population size was calculated considering all pedigree information. As the association of breeders was founded in 1951, all animals born before that were treated as base animals, as well as the animals with unknown parents. The calculation was made over each year based on the rate of inbreeding (ΔF)·N e =1/2ΔF and also on the census information by the number of parents (Falconer and Mackay, Reference Falconer and Mackay1996).
Genealogical parameters
The equivalent complete generations were calculated based on Maignel et al. (Reference Maignel, Boichard and Verrier1996):
 $\mathop{\sum}{\left( {1{\rm \!/}2} \right)^{n} } $
where n is the number of generations between an animal and its ancestor. The number of founders was assumed as the number of ancestors with unknown parents. For each half-founder (animal with just one known parent) a dummy founder was created. The effective number of founders (f
e) was computed by the following formula (Lacy, Reference Lacy1989):
 $f_{{\rm e}} {\equals}1{\rm /}\mathop\!{\sum}{\left( {p_{i}^{2} } \right)} $
where p
i
is the proportion of the genes of the descendant population contributed by founder i.
The effective number of ancestors (f
a) was proposed by Boichard et al. (Reference Boichard, Maignel and Verrier1997) as the minimum number of ancestors explaining the same level of GD as the reference population. It was calculated by the formula:
 $f_{{\rm a}} {\equals}1{\rm /\!}\mathop{\sum}{\left( {q_{i}^{2} } \right)} $
where q
i
is the marginal genetic contribution of ancestor i. The ratio between the effective number of founders and the effective number of ancestors (f
e/f
a) could be used as an indicative of a population bottleneck (Boichard et al., Reference Boichard, Maignel and Verrier1997). The number of founder genome equivalent (f
ge) is defined as the number of founders that describes the same GD as in the population under study if no loss of alleles occurred and the founders were equally represented (Lacy, Reference Lacy1989; Caballero and Toro, Reference Caballero and Toro2000). It can be calculated by the formula f
ge=1/2f
g, where
 $\overline{{f_{{\rm g}} }} $
is the average coancestry in the population under study. According to Caballero and Toro (Reference Caballero and Toro2000) the
 $\overline{{f_{{\rm g}} }} $
can be calculated as:
 $$\overline{{f_{{\rm g}} }} \,{\equals}\,{{\mathop{\sum}{\mathop{\sum}{a_{{ij}} } } } \over {2n^{2} }}$$
where a ij is the elements of the relatedness matrix and n the number of animals. The ratio f a/f ge could be used as an indicator of effects of gene drift in the population (Boichard et al., Reference Boichard, Maignel and Verrier1997). The effective number of non-founders was proposed by Caballero and Toro (Reference Caballero and Toro2000) as the accounting for non-founders contribution:
 $$N_{{{\rm enf}}} \,{\equals}\,{1 \over {{1 \over {f_{{{\rm ge}}} }}{\minus}{1 \over {f_{{\rm e}} }}}}$$
The GD was computed by Lacy (Reference Lacy1989): GD=1−1/2f ge. The loss of GD since the founder generation in the population as defined by Caballero and Toro (Reference Caballero and Toro2000) was estimated: 1−GD. All pedigree analyses were performed using the PEDIG (Boichard, Reference Boichard2002) and CFC (Sargolzaei et al., Reference Sargolzaei, Iwaisaki and Colleau2006) software.
Population stratification
For this analysis, a subset from the population was taken, based on Roos et al. (Reference Roos, Hinrichs, Nissen and Krieter2015); in this study the reference population contained 2.89 times the generation interval. It contained only animals born between 1990 and 2016, with a total of 65 572 animals. All regions of birth of the animals were coded and the average relationships between them calculated, excluding the regions with less than 20 animals. The R package heatmap (R Development Core Team, 2016) was used to obtain a visual inference over the magnitude of genetic relationship between animals born in different regions. For this, diagonal elements were set as 0 because the average relationship coefficient within the states or regions were remarkably greater than between, causing the scale to be an obstacle to visual interpretation.
Inbreeding effects on morphological traits
The individual inbreeding coefficient was calculated for all animals in the pedigree using CFC software (Sargolzaei et al., Reference Sargolzaei, Iwaisaki and Colleau2006). In order to estimate the effects of inbreeding over morphological traits in the Campolina breed, a regression of each trait on the inbreeding coefficient (F) of individuals have been performed. The measurements were performed by certified technicians of the ABCCCampolina. In this study, we considered data from 16 of the most important morphological measurements performed at 36 months of age for the analyzes. Phenotypic means for the studied traits varied from 18.93 to 156.15 cm, for cannon girth (CG) and body length (BL), respectively; and the minimum N was 43 300 for heart girth (HG) (descriptive statistics are shown in Table 1).
Descriptive statistics for the conformation traits in the present study

The traits were: height at withers, height at back, height at croup, height at chest, head length, neck length, shoulder length, back-loins length, BL, leg length (LL), croup length, head width, chest width (CW), buttock width (BW), HG and CG.
Model of description
The linear mixed model proposed for the analysis was:
 $$\eqalignno{ y_{{ijklmn}} \,{\equals}\,&\beta _{0} {\plus}ys_{i} {\plus}bh_{j} {\plus}yregis_{k} {\plus}sex_{l} {\plus}\beta _{1} {\rm age}\cr&{\plus}\beta _{2} {\rm age}^{2} {\plus}\beta _{3} F{\plus}a_{m} {\plus}e_{{ijklmn}} $$
where y
ijklmn
represent the value for the trait; β
0 an intercept; ys
i
the systematic effect of year-season of birth interactions; bh
j
the systematic effect of the individuals birth herd; yregis
k
the systematic effect of the year of the individual’s registry; sex
l
the systematic effect of sex; β
1 and β
2 represent the coefficients of the covariate (linear and quadratic, respectively) age (in months); β
3 represent the coefficients of the covariate inbreeding coefficient; a
m
the random effect of the nth animal where
 $a\,\sim\,N\left( {0,\,A\sigma _{a}^{2} } \right)$
, where A is the relationship matrix and e
ijklmn
represent the random residual terms, where
 $e\,\sim\,N\left( {0,\,\sigma _{e}^{2} } \right)$
.
Inference
The analysis of inbreeding effects on morphology was implemented using a Bayesian framework, thus all inference was performed through the analysis of the posterior distributions of the parameters. According to Bayes rule, the posterior density of all unknown parameters is
 $p\left( {\theta {\rm \mid}y} \right)\propto p(y{\rm \mid}\theta )p\left( \theta \right)$
, where
 $\theta {\equals}\left\{ {\beta _{0} ,\,\ldots\,,\,a,\,\sigma _{a}^{2} ,\,\sigma _{e}^{2} } \right\}$
is the collection of unknown model parameters for the morphological traits, p(θ) the prior distribution for θ, p(y|θ) the conditional distribution of the data and p(θ|y) the posterior distribution of the unknown parameters. Thus, the joint prior distribution for all unknowns was defined as:
 $p\left( \theta \right) \propto p\left( {a{\rm \mid}\sigma _{a}^{2} } \right)p\left( {\sigma _{a}^{2} } \right)p\left( {\sigma _{e}^{2} } \right)$
, that is:
 $$p\left( \theta \right) \propto N\left( {a{\rm \mid}0,\,A\sigma _{a}^{2} } \right)\chi ^{{{\minus}2}} \left( {\sigma _{a}^{2} {\rm \mid}df_{a} ,\,S_{a} } \right)\chi ^{{{\minus}2}} \left( {\sigma _{e}^{2} {\rm \mid}df_{e} ,\,S_{e} } \right)$$
where
 $\chi ^{{{\minus}2}} \left( {{}_{ \cdot }{\rm \,\mid\,}df_{ \cdot } ,\,S_{ \cdot } } \right)$
is a scaled inverse χ
2 distribution with df and scale parameter S.
Analyzes were performed using GIBBS1F90 software (Misztal et al., Reference Misztal, Tsuruta, Strabel, Auvray, Druet and Lee2002). A total of 550 000 samples were generated in a single chain, assuming a burn-in period of 50 000 and a thinning interval of 50. Thus, inference was realized over 10 000 samples from the posterior distribution. Convergence of the Markov Chain Monte Carlo chains was verified by applying the Z criterion of Geweke (Reference Geweke1992), using the ‘coda’ package (Plummer, Reference Plummer, Best, Cowles and Vines2006) from R software (R Development Core Team, 2016).
Results
Demographic structure
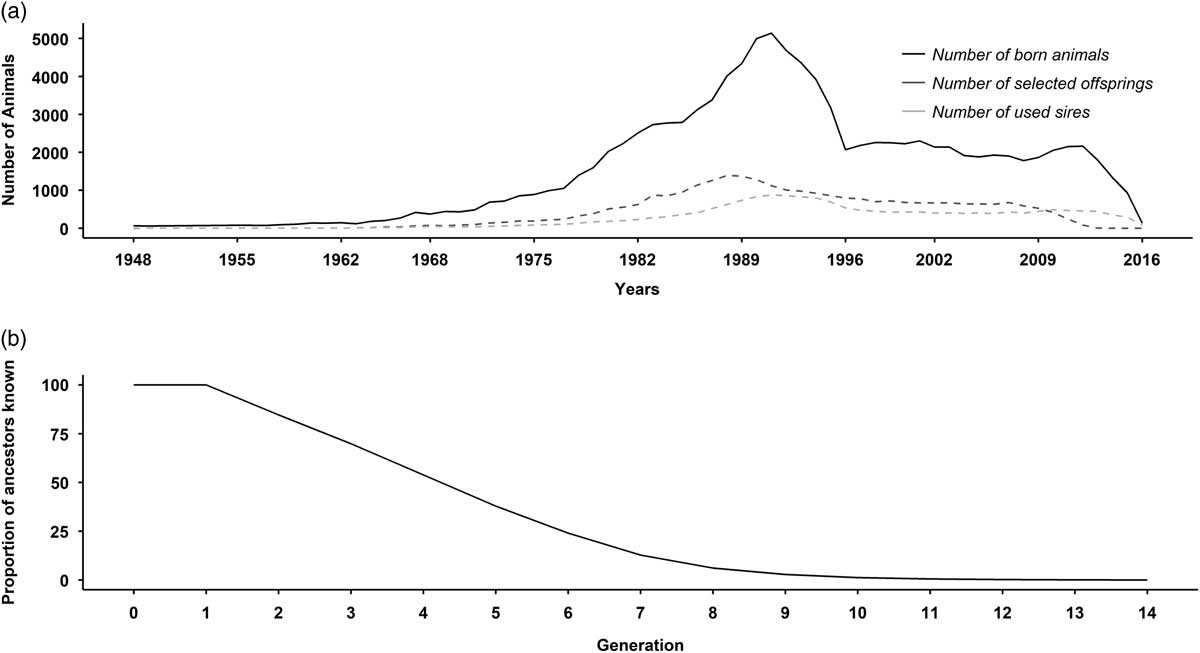
An average of 1380 females were born per year between the year of 1990 and 2016, with a decreasing linear trend of −75.386 births per year. In this interval, the average number of males born was 1051, decreasing in a linear trend of −51.615 births per year. The breeding population (individuals who left descendants) in the Campolina horse consisted of 2464 males and 5948 females. The number of selected offspring per year presented a decrease around the year 1989, and the number of males used as stallions on each year also decreased in the period between the years 1989 and 1996, with a stabilization after this period (Figure 1a). Pedigree completeness was assessed by calculating the proportion of ancestors known in each generation (Figure 1b), for the first three generations was 100%, 99.98% and 84.64%, respectively.
(a) Number of animals registered by year and the number of sires that have at least one service registered by year and the number of selected offspring in each year. (b) Average completeness per generation.

Generation interval
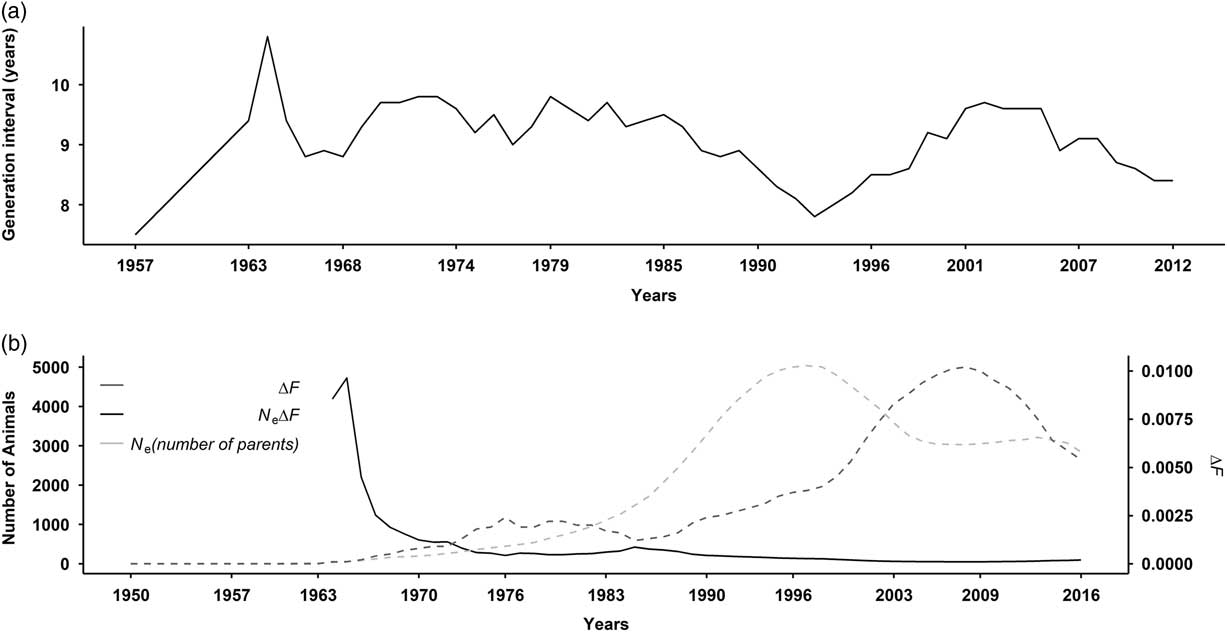
Changes on generation interval for the studied time period are shown in Figure 2a. The overall average generation interval observed was 9.00±0.09 years. The generation interval between mares and their progeny was longer than for stallions and their offspring. The interval between mares and their sons was the longest of all categories. The average generation interval showed a slight but inconsistent decrease by year.
(a) Changes in generation interval by year. (b) Effective population size (N e) and increase in each generation inbreeding coefficients (ΔF) by year. N e(ΔF) is N e calculated on the basis of ΔF and N e (number of parents) is calculated on census information.

Parent’s age at the moment of birth of their offspring with progeny records did not differ between sires and dam. The average age of sires at the moment of birth of their offspring was 8.3 years, while for dams it was 8.9 years. In general, all breeding animals started reproduction young and stallions were strongly used between 3 and 7 years of age. For females, the most intense reproduction period occurred between 4 and 9 years of age, while 75% of births were originated from females at until the fourth parity episode.
Effective population size
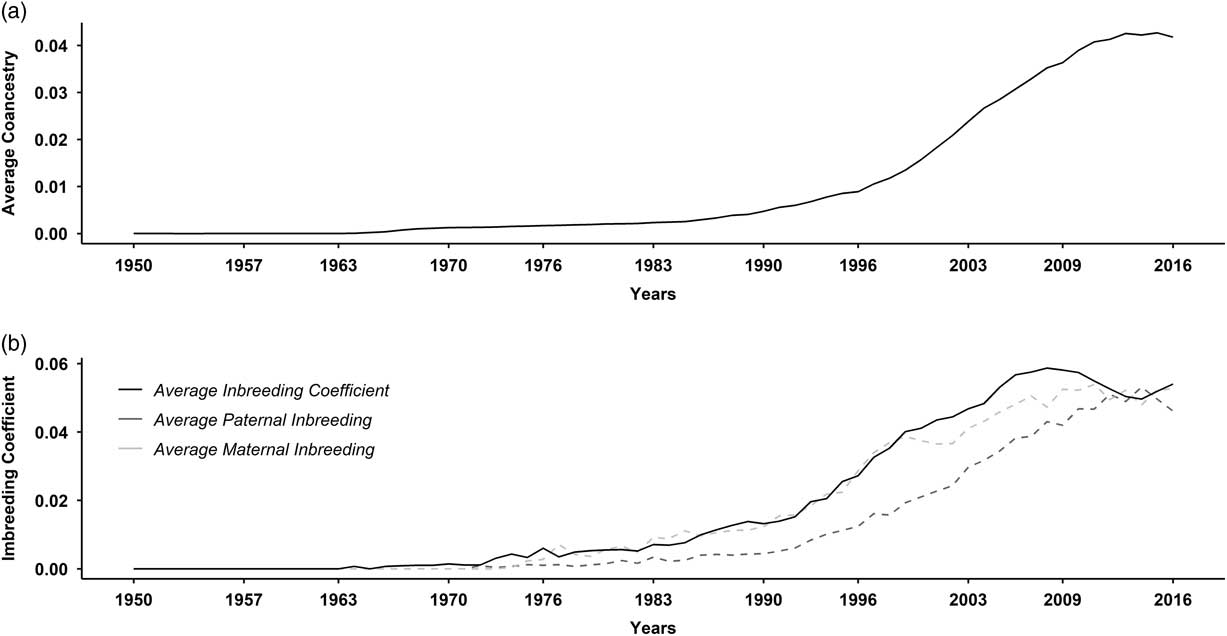
The N e when calculated based on ΔF, suggests the increase in the usage of inbreeding by Campolina horse breeders since 1970 (Figure 2b). The highest value for ΔF and the average coancestry coefficient were observed for the year 2009 (Figures 2b and 3a). A pronounced increase on the average coancestry was observed between the years 1990 and 2016. Even when ΔF started decreasing (after the year 2009), the average coancestry was increased with the inbreeding coefficient, as shown in Figure 3. The effective population size (N e ) in the Campolina horse was 93 when based on the ΔF parameter and 2846 when calculated based on the number of parents. The family size variation showed a decreasing trend between years 1900 and 1990, switching to an increasing linear trend after 1990. The family size for stallions (21.54±2.02) was greater than for mares (3.42±0.12).
(a) Average coancestry coefficient per year. (b) Average, maternal and paternal inbreeding coefficients by year.

Genealogical parameters
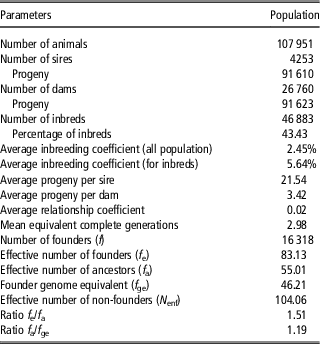
Results suggest that around 0.60% of GD was lost due the unequal contribution of founders in the Campolina population. Since its foundation, 1.08% of GD were lost in the population and 0.48% of GD were lost due to genetic drift. In terms of bottleneck, the loss of GD was predicted as 1/2f a=0.91%. There were 316 sires and 16 002 dams in the founders group, but the effective number of founders was equivalent to 83.13 (Table 2), implying a reduction of 99.49% in the number of founder explaining the same level of GD found in the complete population. The genetic contributions of founders were between 9.26×10⁻⁴% and 7.17%, which means that founders have not had an equal contribution, supporting other results presented in this study.
Genealogical parameters of the Campolina horse population

Inbreeding effect on morphological traits
The overall average percentage of inbreeding coefficient was 2.45±0.02% for the complete population, and 5.64±0.03% for the inbred animals. Table 3 shows the number of animals per category of F. Around 84% of the animals were located between F=0% and F=5% and only 1.68% of the animals were above F=25%.
Number of animals per inbreeding category and percentage of each class

The mean F started increasing in a pronounced manner after the year 1970 with a trend of +8.30% per year, where the paternal F (2.98%) was higher than maternal (2.75%) (Figure 3b). Sires had higher F than dams throughout the time series studied, however, females presented a higher value of F (5.68%) then general (sire+non-sire) males (5.57%). Gelding individuals composed the lowest inbred category, with F=5.34%.
Population stratification
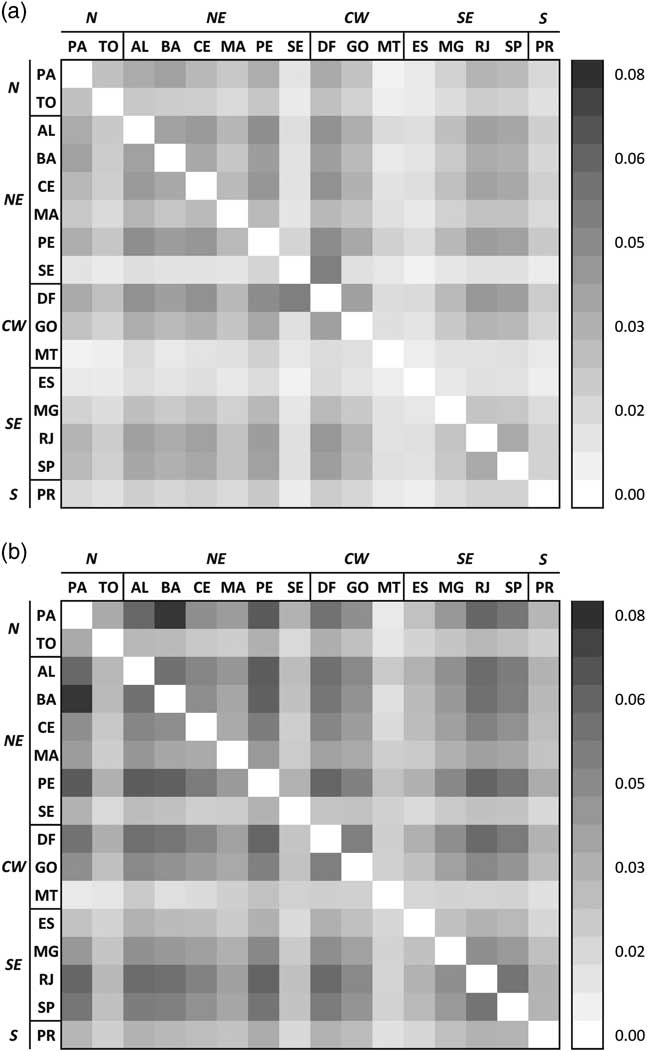
The average coancestry coefficient presented a continuous increase (Figure 3a) for the time series studied. The average relationship between animals born in different states presented an increase for animals born after the year 1990 (Figure 4b), except for the relationship between animals from Sergipe state (Northeast region) and the Federal District (Center-West region), as shown in Figure 4. The mean of average relationships between states or regions was f=0.021, and within states was f=0.214. Although not shown in Figure 4, the average relationship within the states decreased for animals born between the years of 1990 and 2016 (Figure 4a and b), except for Bahia and MG states, with an increase of 22.71% and 32.37%, respectively. The decrease on the average relationship within the states ranged between −80.14% and −7.92%, for Sergipe and São Paulo states, respectively.
Average relationship between states and demographic regions for the complete population (a) and for animals born between the years 1990 and 2016 (b). N=North; NE=Northeast; CW=Center-West; SE=Southeast; S=South; PA=Para; TO=Tocantins: AL=Alagoas; BA=Bahia; CE=Ceará; MA=Maranhão; PE=Pernambuco; SE=Sergipe; DF=Federal District; GO=Goiás; MT=Mato Grosso; ES=Espírito Santo; MG=Minas Gerais; RJ=Rio de Janeiro; SP=São Paulo; PR=Paraná. Diagonal elements were set to 0 for scale purposes. Italic letters were used to identify the geographic regions.

The regression coefficients of the phenotype on F for the morphological traits studied, as well as the chain convergence parameters, are shown in Table 4. Geweke Z scores obtained for the parameters varied from −0.762 (BL) to 1.506 (LL), and the autocorrelation at lag50 (r-lag50) was very low, as the maximum observed value was 0.018 (LL). The linear effect of F over the analyzed traits was mainly negative, varying between −0.003 (BL) and −0.063 (BW). The percentage of the phenotypic mean represented by the estimated effect of F varied from 0.002 (BL) to 0.195 (CG).
Posterior mean, median, highest-posterior density (HPD), Geweke’s test (Z score), autocorrelation (r-lag50) and percentage of mean values for the effect of inbreeding coefficient on morphological traits

 $\,\%\,\bar{\mu }_{{{\rm phen}}} {\equals}{\rm percentage}\,{\rm of}\,{\rm the}\,{\rm phenotypic}\,{\rm mean}\,{\rm represented}\,{\rm by}\,{\rm the}\,{\rm estimated}\,{\rm effect}.$
HW=height at withers; HB=height at back; HC=height at croup; HCh=height at chest; LL=leg length; HdW=head width; CW=chest width; BW=buttock width; HL=head length; NL=neck length; BLL=back-loins length; CL=croup length; SL=shoulder length; BL=body length; HG=heart girth; CG=cannon girth.
Discussion
The observed numbers for the Campolina horse population showed that even though this breed is still recent in historical terms, its size is equivalent to older international horse breeds (different breeds – N e between 19.8 and 322, Cervantes et al., Reference Cervantes, Goyache, Molina, Valera and Gutiérrez2010). The values of pedigree completeness up to the sixth generation were greater than found by Teegen et al. (Reference Teegen, Edel and Thaller2009) for the Trakehner horse and that may be attributed to the improved capability of genealogical recording in most recent times. Moreover, the politics implemented by the ABCCCampolina, in which all recent born animals are DNA tested for parental confirmation, contributes for a more precise genealogical recording. The values of pedigree completeness found in this study were similar to Druml et al. (Reference Druml, Baumung and Sölkner2009) and Duru (Reference Duru2017) for the Austrian Noriker draught and Turkish Arab horse breeds, respectively; the authors found values greater than 80% of completeness up to the sixth generation, while in the present study a value of 84% was observed for the same depth of completeness. The greater decrease in pedigree completeness shown after the third generation may have support on the beginning of the Campolina as a breed. The large Brazilian territory represent an obstacle for controlling the population, impairing information collection ability from sires and dams in older generations for technological and infrastructural purposes.
As shown in Figure 1a, the number of animals born per year has experienced a pronounced growth from 1900 to 1990s, but showed an abrupt decrease after the year 1990, a result that is highly connected to a specific moment of the Brazilian economy. During this period, Brazil was under an uncontrolled economic crisis, which lasted at least 4 years (from 1990 to 1994). As a result, the investment in agribusiness shortened, and thus, horse market shrinked drastically. The slight return of growth, observed around 1996–97, had major obstacles as, from this period onwards, other horse breeds started to lead the horse market due to preferences of new breeders.
The proportion of males and females registered in this period was different from the expected (43.24% of males and 56.76% of females) and that could have many reasons: first, the costs involved in breeding a stallion are higher than for mares, second, the particularities of the stallions’ management requirements: stallions need a larger area without direct contact with other males, they also need more handling cares because they are more agitated than mares. The third reason is the introduction of reproductive technologies by the ABCCCampolina, as only registered purebred animals are accepted as recipient mares.
Changes in the generation interval by year found in the present study were more intensive than reported by Yamashita et al. (Reference Yamashita, Oki, Hasegawa, Honda and Nomura2010) in the Japanese Thoroughbred horse, and this may be associated with the greater variation per year of the generation interval found in this study. Roos et al. (Reference Roos, Hinrichs, Nissen and Krieter2015) reported average generation intervals between 10.03 and 10.59 years in Holstein horse. Likewise, Teegen et al. (Reference Teegen, Edel and Thaller2009) observed a generation interval of 10±0.06 years in Trakehner horse population and Yamashita et al. (Reference Yamashita, Oki, Hasegawa, Honda and Nomura2010) found an average generation interval from 10.5 to 11.5 in Thoroughbred horses in Japan. The slightly lower generation interval (9 years) observed for the Campolina breed may be associated with the preference of most breeders to ‘initiate’ a foal at the age of 2 to 3 years in morphological and gait competitions. The choice for reproduction is therefore conditional to animal’s performance in those competitions. Because of this earlier introduction to reproduction, most animals are parents at younger ages, decreasing the average generation intervals. The particularity of the large intervals in the maternal side can have the competitions as main reason; while a mare is under competition it cannot get pregnant. Breeders often introduce very young females in competitions in order to obtain prizes and thus start reproduction earlier in life. Shorten generation intervals impact, positively, the genetic gains; results reported for the Campolina horse support that the implementation of a national breeding program considering morphological traits could help to guide the genetic evolution of the population.
To avoid inbreeding depression in the short term, Frankham et al. (Reference Frankham, Ballou and Briscoe2010) suggested that the need of a minimum value of N e higher than 50. However, in the long term, even larger populations must be monitored in order to avoid inbreeding depression on fitness, reproductive and survival traits. The N e values reported by Roos et al. (Reference Roos, Hinrichs, Nissen and Krieter2015) in the Holsteiner horse population (55.31) were lower than found in the Campolina population (93), which can be resulted from the high inbreeding present in this breed. The value here observed was close to results found for indigenous horse breeds of 83.6 (Hasler et al., Reference Hasler, Flury, Menet, Haase, Leeb, Simianer, Poncet and Rieder2011), that may be attributed to the mean inbreeding coefficient found for the Campolina horse population, which was similar to the value reported by those authors (5.19%).
In the present study, within both methods, N e based on the number of parents and rate of inbreeding, were found differences in the average coancestry and average inbreeding coefficient. This result suggests that there may be differential contribution from sires in the Campolina breed, which in the long term may contribute to a further deepening in the partitioning of the population. The reduction of 96.7% between results of N e obtained by different methods is attributable to the strong increase of F i from 1990.
The family size variation shows that the possible implementation of the ‘optimum contribution selection’ method would increase response to selection, due to the combination of unrelated families. This method aims to avoid extreme relationships of offspring and provide low inbreeding levels of the parents in the next generation (Sonesson and Meuwissen, Reference Sonesson and Meuwissen2000). According to Teegen et al. (Reference Teegen, Edel and Thaller2009), another consequence of this method is the maintenance of higher values of the effective population size, by balancing the number of males and females, standardizing family size and introducing genetic exchange within family (rotation of sires).
Reductions of genetic variability can happen due to unequal contribution of founders, bottleneck and drift events (Duru, Reference Duru2017). The reduction on the effective number of founders and ancestors comparing to the real value found in this study suggest loss of genetic variability and that was confirmed by the loss of 0.60% of GD. Although, the results of this study showed a large difference between the number of founders and the effective number of founders, the effective number of founders found in this study was greater than found by Duru (Reference Duru2017), Roos et al. (Reference Roos, Hinrichs, Nissen and Krieter2015) and Santana and Bignardi (Reference Santana and Bignardi2015), of 40.00, 50.20 and 56.40 respectively, which indicates that the Campolina population still present some level of GD, but that needs to be monitored in order to prevent further losses in the future. In this study, the losses due to unequal contribution of founders represented 55.55% of the total loss of GD, which was less then found by Santana and Bignardi (Reference Santana and Bignardi2015), due to a probable less intense use of specific influential individuals in the population.
The f a was lower than the real number of ancestors, showing that the observed loss of GD was passed from parents to their progeny as a result of the bottleneck. If the rate f e/f a is equal to 1, then the population is considered stable in terms of founder contributions and the bottleneck do not affect the population (Duru, Reference Duru2017). In this study, the f e/f a rate was 1.51, indicating that the Campolina population may be suffering a bottleneck effect and these effects were higher as a result of reduction in the number of individuals used for mating over the past generations.
The effective number of founder genomes was around 50% of the effective number of founders and the ratio (1.80%) show that even the loss of GD due to bottleneck was intense, in the Campolina breed the loss of founder alleles over the time is not so high due the genetic drift. The N enf was 104.06, indicating considerable genetic contribution from non-founder individuals, decreasing losses in the GD in opposition to losses due to unequal contribution of founders.
The mean average relationship coefficient in the population (f=0.022) was low when compared to average coancestry, that may indicate a presence of breeding societies (suggested term to describe preferential regional mating by Teegen et al. (Reference Teegen, Edel and Thaller2009)) in the population. As the increase in the average coancestry and inbreeding were very strong, was expected increase in the average relationship in between the states and also within the states. It is possible to see (Figure 4b) that the f between states and demographic regions has increased for individuals born after the year 1990. This result is in accordance to the observed increase in the average coancestry. It is possible to infer that as parental f increased, the average coancestry has also increased for the progeny of those inbred parents, resulting in more prominently related progeny between states/regions in the latest generations.
Although the average relationship between states and regions has increased, the average relationship within states decreased. This event may be associated with the introduction of new reproductive technologies, such as embryo transfer and artificial insemination, which allows a broader distribution of genetic material for longer distances. Another event that could influence in favor of the observed results is the increase in the number of live animal’s exchange (by selling/trading) between more distant herds, due to the improvement of transportation and management practices after the 1+990s decade.
The rate between average genetic relationship within and between states was 10 : 1 when considering the entire population, and for the recent population (animals born after 1990) this ratio decreased to 3 : 1. These differences indicate that the recent increase in the exchange of genetic material has impacted the genetic relationship between states. However, mating of animals born in the same region is still prevalent, resulting in breeding societies, and thus, still a higher than 1 : 1 ratio observed for the average genetic relationship between and within states for the recent generations.
It is interesting that the patterns of average relationship between the demographic Brazilian regions showed no major changes over time, only increasing its magnitude when comparing the entire population and animals born from 1990 onwards. This may indicate that breeding societies formed in the past generations of the Campolina population are still functional in recent days. The average relationship within the MG was the only one largely increased, that may be attributed to the fact that this breed was developed in that specific state, where preferential regional mating is more common. The observed average genetic relationship between MG and others states was the most invariant when comparing heatmaps in Figure 4, which is in accordance to historical facts. Considering the Campolina breed was first developed in MG, it is plausible to infer that animals from all others regions should have a minimum genetic relationship with animals from this state, as the first individuals brought to other regions were invariantly originated from there.
The average inbreeding in the Campolina horse was higher than found by Gonçalves et al. (Reference Gonçalves, Costa, Rezende, Rocha Júnior and Leite2012) in Mangalarga Marchador horse breed, but lower than reported by Gómez et al. (Reference Gómez, Valera, Molina, Gutiérrez and Goyache2009) of 8.2% mean for the Spanish Purebred population. It was also lower than the average F reported for European horse populations, such as the Lipizzan (Zechner et al., Reference Zechner, Solkner, Bodo, Druml, Baumung, Achmann, Marti, Habe and Brem2002) and the Pura Raza Española (Valera et al., Reference Valera, Molina, Gutiérrez, Gómez and Goyache2005). That may be related with the proportion of founders with unknown parents, which contribute as 0 in computation of inbreeding.
In the present study, differences on the average F between sires and dams were observed. This result may be explained by the fact that stallions are, in general, the most important category in the structure of herds. Therefore, a lot more investment is put into the acquisition of stallions, allowing it to be bought from other breeders as an adult, embryo or even by the acquisition of semen from stallions bred in distant regions. The production of mares, however, is much more focused on mating individuals within the herd, which on average results in higher inbreeding coefficients as parents are often much more related.
Conflicting results have been published for the effect of the increase in F over morphological traits (Gandini et al., Reference Gandini, Bagnato and Miglior1992; Bergmann et al., Reference Bergmann, Costa, Mourão and Houri Neto1997; Wolc and Balińska, Reference Wolc and Balińska2010), varying from negative to positive. This lack of pairing must be attributed to different population structure, selection criteria and magnitude of inbreeding practiced in distinct horse breeds. Depending on the selection criteria practiced in determined horse breeds, it could cause an increase in the frequency of homozygous genotypes for alleles which are actually favorable, allowing the estimation of positive effects of inbreeding over morphological traits.
When morphological traits are considered as selection criteria, negative effects of inbreeding may actually allow new selection possibilities. Bergmann et al. (Reference Bergmann, Costa, Mourão and Houri Neto1997) found a negative influence of inbreeding on morphology in the Brazilian Pony breed, but the authors argued that this effect benefits breeder’s selection objectives as they wish smaller animals. When considered exclusively on the perspective of morphological traits, inbreeding has been used as a tool for achieving more homogeneous groups of progenies and for fixating some desirable features in specific lines of horses. However, genetic associations between morphological and functional (health, performance and survival) traits can impose a limiting factor in the overuse of inbred mating. Favorable genetic correlation was reported between conformation and health traits in the Swedish Warmblood riding horse (Jönsson et al., Reference Jönsson, Näsholm, Roepstorff, Egenvall, Dalin and Philipsson2014), which implies that similar genomic regions may be affecting both types of traits. Therefore, it is plausible to assume that negative effects of F over morphological traits due to the increase in the frequency of homozygous loci may also impair health traits. As an example, Sevinga et al. (Reference Sevinga, Vrijenhoek, Hesselink, Barkema and Groen2014) have reported that inbreeding was at least partly the cause of the high incidence of retained placenta in Friesian Horses. This suggests that the increase of inbreeding can cause not only the reduction of morphological phenotypes, but further drastic consequences for the Campolina breed in the long term.
Conclusions
The results of the present study do not indicate a severe narrowing of the Campolina breed population in Brazil. The average genetic relationship between animals is increasing and signs of impairment caused by the increase in the inbreeding coefficient were estimated. Inbreeding must be controlled to avoid losses in the future. The assessment of the population stratification can support the development of strategies to minimize inbred mating.
Acknowledgments
The authors would like to thank the Brazilian Association of the Horse Breeders Campolina, that provided its database, making the analyzes for the present study possible.
Declaration of interest
The authors report that there are no conflicts of interest relevant to this publication.
Ethics statement
This study was performed with a dataset provided by the ABCCCampolina, thus there is no relevance for approval of the work by the ethics committee from University of São Paulo.
Software and data repository
The scripts of analyses are available on: https://github.com/FBussiman/Animal-Script