1. Introduction
Since its birth approximately 40 years ago (Dubetskii et al., Reference Dubetskii, Kazantsev, Chebotayev and Yakovlev1984), the field of atom interferometry has matured significantly. The current state and prospects in this area are presented, for example, in reviews (Tino and Kasevich, Reference Tino and Kasevich(ed)2014) and proposals (Canuel et al., Reference Canuel, Abend, Amaro-Seoane, Badaracco, Beaufils, Bertoldi, Bongs, Bouyer, Braxmaier, Chaibi, Christensen, Fitzek, Flouris, Gaaloul, Gaffet, Garrido Alzar, Geiger, Guellati-Khelifa, Hammerer, Harms, Hinderer, Holynski, Junca, Katsanevas, Klempt, Kozanitis, Krutzik, Landragin, Roche, Leykauf, Lien, Loriani, Merlet, Merzougui, Nofrarias, Papadakos, Pereira Dos Santos, Peters, Plexousakis, Prevedelli, Rasel, Rogister, Rosat, Roura, Sabulsky, Schkolnik, Schlippert, Schubert, Sidorenkov, Siemß, Sopuerta, Sorrentino, Struckmann and Tino2020; Zhan et al., Reference Zhan, Wang, Ni, Gao, Wang, He, Li, Zhou, Chen, Zhong, Tang, Yao, Zhu, Xiong, Lu, Yu, Cheng, Liu, Liang, Xu, He, Ke, Tan and Luo2020; Badurina et al., Reference Badurina, Bentine, Blas, Bongs, Bortoletto, Bowcock, Bridges, Bowden, Buchmueller, Burrage, Coleman, Elertas, Ellis, Foot, Gibson, Haehnelt, Harte, Hedges, Hobson, Holynski, Jones, Langlois, Lellouch, Lewicki, Maiolino, Majewski, Malik, March-Russell, McCabe, Newbold, Sauer, Schneider, Shipsey, Singh, Uchida, Valenzuela, van der Grinten, Vaskonen, Vossebeld, Weatherill and Wilmut2020; Battelier et al., Reference Battelier, Bergé, Bertoldi, Blanchet, Bongs, Bouyer, Braxmaier, Calonico, Fayet, Gaaloul, Guerlin, Hees, Jetzer, Lämmerzahl, Lecomte, Le Poncin-Lafitte, Loriani, Métris, Nofrarias, Rasel, Reynaud, Rodrigues, Rothacher, Roura, Salomon, Schiller, Schleich, Schubert, Sopuerta, Sorrentino, Sumner, Tino, Tuckey, von Klitzing, Wörner, Wolf and Zelan2019; El-Neaj et al., Reference El-Neaj, Alpigiani, Amairi-Pyka, Araújo, Balaž, Bassi, Bathe-Peters, Battelier, Belić, Bentine, Bernabeu, Bertoldi, Bingham, Blas, Bolpasi, Bongs, Bose, Bouyer, Bowcock, Bowden, Buchmueller, Burrage, Calmet, Canuel, Caramete, Carroll, Cella, Charmandaris, Chattopadhyay, Chen, Chiofalo, Coleman, Cotter, Cui, Derevianko, De Roeck, Djordjevic, Dornan, Doser, Drougkakis, Dunningham, Dutan, Easo, Elertas, Ellis, El Sawy, Fassi, Felea, Feng, Flack, Foot, Fuentes, Gaaloul, Gauguet, Geiger, Gibson, Giudice, Goldwin, Grachov, Graham, Grasso, van der Grinten, Gündogan, Haehnelt, Harte, Hees, Hobson, Hogan, Holst, Holynski, Kasevich, Kavanagh, von Klitzing, Kovachy, Krikler, Krutzik, Lewicki, Lien, Liu, Luciano, Magnon, Mahmoud, Malik, McCabe, Mitchell, Pahl, Pal, Pandey, Papazoglou, Paternostro, Penning, Peters, Prevedelli, Puthiya-Veettil, Quenby, Rasel, Ravenhall, Ringwood, Roura, Sabulsky, Sameed, Sauer, Schäffer, Schiller, Schkolnik, Schlippert, Schubert, Sfar, Shayeghi, Shipsey, Signorini, Singh, Soares-Santos, Sorrentino, Sumner, Tassis, Tentindo, Tino G, Tinsley, Unwin, Valenzuela, Vasilakis, Vaskonen, Vogt, Webber-Date, Wenzlawski, Windpassinger, Woltmann, Yazgan, Zhan, Zou and Zupan2020; Tino et al., Reference Tino, Bassi, Bianco, Bongs, Bouyer, Cacciapuoti, Capozziello, Chen, Chiofalo, Derevianko, Ertmer, Gaaloul, Gill, Graham, Hogan, Iess, Kasevich, Katori, Klempt, Lu, Ma, Müller, Newbury, Oates, Peters, Poli, Rasel, Rosi, Roura, Salomon, Schiller, Schleich, Schlippert, Schreck, Schubert, Sorrentino, Sterr, Thomsen, Vallone, Vetrano, Villoresi, von Klitzing, Wilkowski, Wolf, Ye, Yu and Zhan2019; Abe et al., Reference Abe, Adamson, Borcean, Bortoletto, Bridges, Carman, Chattopadhyay, Coleman, Curfman, DeRose, Deshpande, Dimopoulos, Foot, Frisch, Garber, Geer, Gibson, Glick, Graham, Hahn, Harnik, Hawkins, Hindley, Hogan, Jiang, Kasevich, Kellett, Kiburg, Kovachy, Lykken, March-Russell, Mitchell, Murphy, Nantel, Nobrega, Plunkett, Rajendran, Rudolph, Sachdeva, Safdari, Santucci, Schwartzman, Shipsey, Swan, Valerio, Vasonis, Wang and Wilkason2021).
Among other applications, atom interferometers (AIs) are now proposed for use as inertial measurement units (IMUs) in navigation.
The precision accuracy of AIs allows us to hope for significant progress, improving the accuracy and duration of the navigation. These applications are based on the possibility of using an AI as an accelerometer (Kasevich and Chu, Reference Kasevich and Chu1991). If the atoms move with acceleration $\boldsymbol{a}$ , then the AI phase is given by

where $\mathbf {k}$ is the effective wave vector of the Raman pulses and $T$
 is the delay time between these pulses. The error of the acceleration measurement is

where $\phi _{{\rm err}}$ is the accuracy of the AI phase measurement. To date, for example, the accuracy of differential acceleration measurements has reached

at the delay time

For navigation applications, a system of six AIs was created and tested (Canuel et al., Reference Canuel, Leduc, Holleville, Gauguet, Fils, Virdis, Clairon, Dimarcq, Borde and Landragin2006). However, the direct use of a precise AI as an IMU is difficult. As a matter of fact, the IMUs data should be substituted into the navigation equations, and for an accurate numerical solution of these equations, the IMUs measurements should be repeated with a time step of at least $\tau \sim 1$ ms (Ahmed and Cuk, Reference Ahmed and Cuk2005). To do this, the interrogation time of the AI must be no more than $\tau$
 , and therefore $T\lesssim \tau /2$
 . Thus, with the same accuracy of the phase measurement $\phi _{{\rm err}}$
 and the effective wave vector $k$
 , the acceleration measurement error increases by six orders of magnitude to the level of $5$
 ppm. With such an inaccuracy, atomic interferometers will be even an order of magnitude worse than conventional accelerometers (Jekeli, Reference Jekeli2001) and will not result in any progress in navigation.
Two methods have been proposed to avoid this difficulty. In one method, AIs are used in a hybrid mode together with conventional IMUs (Canciani, Reference Canciani2012; Lautier et al., Reference Lautier, Volodimer, Hardin, Merlet, Lours, Pereira Dos Santos and Landragin2014; Cheiney et al., Reference Cheiney, Fouché, Templier, Napolitano, Battelier, Bouyer and Barrett2018; Wu et al., Reference Wu, Guo, Feng, Chen, Yuan and Zhang2020; Wang et al., Reference Wang, Kealy, Gilliam, Haine, Close, Moran, Talbot, Williams, Hardman, Freier, Wigley, White, Szigeti and Legge2021). Another option Kasevich and Dubetsky (Reference Kasevich and Dubetsky2005) is related to the fact that one can restore the position of the platform directly from the AI phase without measuring the atomic acceleration and, in principle, without any use of conventional IMUs. To understand why this is possible, one notes that Equation (1) is valid only for the uniform accelerated motion of the atom. If the atomic cloud moves in the platform frame, then, ignoring the quantum effects, for the phase instead of that from Equation (1), one gets


where $\mathbf {x}(t)$ is the classical trajectory of the cloud in the platform frame. Knowing the trajectory at the previous moments $t_{1}$
 and $t_{2}=t_{1}+T$
 and measuring the phase of the AI, one restores the trajectory at the moment $t_{3}=t_{1}+2T$
 . At the same time, there is no need to solve navigation equations, and as a result, the restriction on the feasible delay time $T$
 is removed. One sees that when using an AI as an IMU, one actually does double the work: first, by measuring the trajectory, $\mathbf {x}(t_{3})$
 , to determine the acceleration, and then from solving the navigation equations to determine the trajectory.
The error of measuring the position $\mathbf {x}(t_{3})$ is given by

where to estimate the parameter $\phi _{{\rm err}}/k$ , one can use Equations (2), (3), (4). Despite the fact that at each step the error determined by Equation (6) does not depend on $T$
 , the total error $\Delta X$
 during navigation time $t_{n}$
 accumulates after repeated measurement of phases at time multiples of $T$
 . For the given $t_{n}$
 , the number of steps is

The use of AIs with a longer interrogation time T leads to a reduction in the number of steps and, consequently, to a reduction in the accumulated error. Thus, one sees that, as proposed by Kasevich and Dubetsky (Reference Kasevich and Dubetsky2005), the rejection of the use of AIs as accelerometers allows the use of an unprecedentedly high accuracy of trajectory measurement by Equation (6) for an unprecedentedly accurate navigation.
Atom interference is an exclusively quantum phenomenon. Nevertheless, Equation (5) for the phase is purely classical. This means that instead of quantum objects, atoms, one can use classical material points, which in the future we will call particles. We do not specify the kind of particles. However, we assume that the mass of the particle $M$ is sufficiently large to neglect the recoil velocity $\hbar k/M$
 , where, in our case, $\hbar k$
 is the change in momentum that accompanies the measurement of the particle position.
Like in the patent of Kasevich and Dubetsky (Reference Kasevich and Dubetsky2005), in this paper, we propose to abandon the use of accelerometers, gyroscopes, and navigation equations, and instead measure the trajectories of particles that are launched in the platform system from certain points, at certain speeds, and with a time interval $T$ . We will develop a theory of such navigation here and perform numerical simulations. The obvious advantages of classical objects are a dramatic mitigation in the requirements of high vacuum, avoiding the necessity to solve the problem of the phase multiple ambiguity, and the absence of a recoil effect. The obvious disadvantage of our method is that for classical objects, the accuracy by Equation (6) of their position measurement is hardly achievable at the present time. We have, however, developed methods here that will significantly relax the requirements for $\delta _{x}$
 . The ultimate goal of numerical simulation is to answer the question of what the accuracy of measuring the coordinates and velocities of particles should be to achieve a given accuracy of navigation $\Delta X$
 for a given period of time $t_{n}$
 . Specifically, we will find the answer to this question for


The accelerometer in conventional navigation measures the acceleration of particle $\mathbf {a}$ in the platform system. For $\mathbf {a}$
 in the absence of rotation, one has

where $\mathbf {g}$ and $\mathbf {A}$
 are the gravitational field of the Earth and the acceleration of the platform. Knowing $\mathbf {g}$
 and measuring $\mathbf {a}$
 , one obtains the acceleration of platform $\mathbf {A}$
 , and by substituting it into the navigation equation

one can determine the trajectory of the platform $\mathbf {X}(t)$ .
In Kasevich and Dubetsky (Reference Kasevich and Dubetsky2005), it is actually proposed to replace the accelerations $\mathbf {a}$ and $\mathbf {A}$
 with the trajectories $\mathbf {x}(t)$
 and $\mathbf {X}(t)$
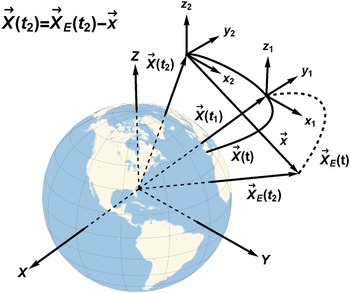
 . The procedure for determining the position of the platform by measuring the position of the particle in the absence of rotation of the platform is illustrated in Figure 1.
(Colour online) Exploiting the measurement of the particle position in the platform frame for navigation. The trajectories of the platform and the particle are shown with solid and dotted curves

We are interested in the trajectory of the platform $\mathbf {X}(t)$ in the coordinate system $\{ X,Y,Z\}$
 rotating with the Earth. On the platform, one installs a local frame $\{x,y,z\}$
 with the origin at the point $\mathbf {X}(t)$
 and sensors that measure the position of the particle $\mathbf {x}(t)$
 in that local frame. At the moment of time $t_{1}$
 , one launches the particle. After the launch, the particle is completely decoupled from the platform and moves along the trajectory $\mathbf {X}_{E}(t)$
 in a vacuum under the influence of only the rotating Earth. Knowing the potential of the Earth's gravitational field and the velocity of the Earth's rotation $\vec {\Omega }_{E}(t)$
 , one can obtain the trajectory $\mathbf {X}_{E}(t)$
 . At time $t_{2}$
 , one measures the position of the particle $\mathbf {x}$
 . Then from Figure 1, one gets for the platform trajectory

The position of the particle at the time of launch in the system $\{ X,Y,Z\}$ , obviously coincides with the position of the platform, $\mathbf {X}_{E}(t_{1}) =\mathbf {X}( t_{1})$
 . To determine the trajectory $\mathbf {X}_{E}(t)$
 , it is also necessary to determine the initial velocity of the particle, $\mathbf {v}_{E}(t_{1})$
 , which depends on the velocity of the platform $\vec {V} (t_{1})$
 , the velocity of the particle $\mathbf {v}$
 in the platform frame, the initial orientation of the platform, the rotation matrix $R(t_{1})$
 , and the initial rate of the platform rotation $\mathbf {\Omega }(t_{1})$
 . It is also necessary to take into account that at the moment $t_{2}$
 , the orientation of the system changes, the rotation matrix $R( t_{2}) \not =R( t_{1})$
 , and one must rotate the vector $\mathbf {x}$
 from the frame $\{x,y,z\}$
 in which it is measured to the frame $\{ X,Y,Z\}$
 . Below we will derive an obvious generalisation of Equation (11) taking into account all these factors. However, here we we would like to note that for successful navigation restoring the position of the platform, it is also necessary to restore the parameters

However, to demonstrate the power of the navigation method we are considering here, let us assume that these parameters are known exactly. We also assume that the particles are launched with a step $T=300$ ms, and the position of the particle is measured with accuracy [standard deviation (SD)]

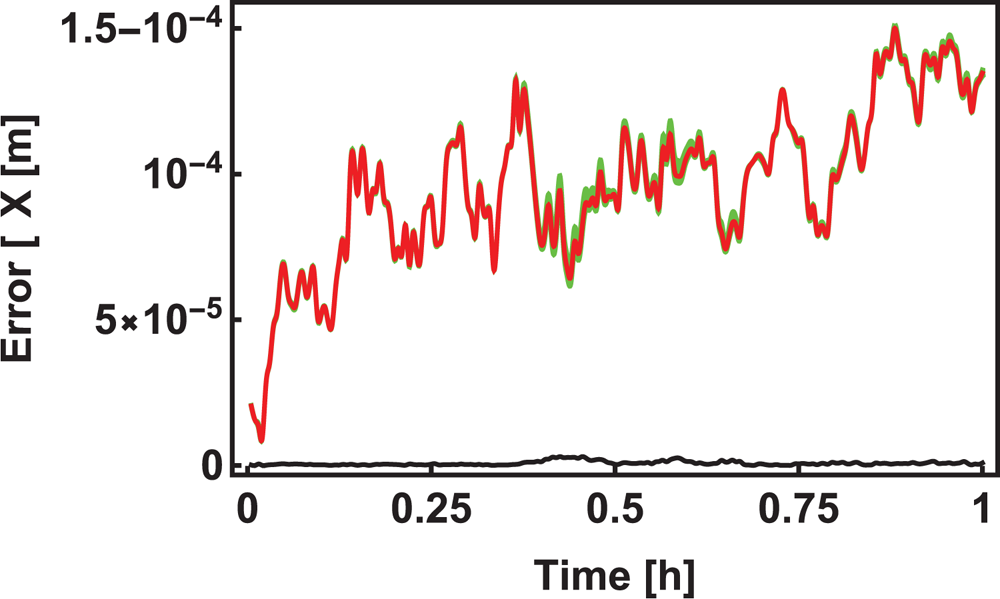
Then the time dependence of the navigation error is shown in Figure 2.
(Colour online) Time dependence of the navigation error (green curve) $\Delta X(t)$ for an ensemble of 30 randomly generated platform trajectories $\mathbf {X}(t)$
 . The red curve is the average error in the ensemble $\langle \Delta X(t) \rangle$
 and the black curve is the SD $\sqrt{\left\langle \left[ \Delta X\left( t\right) \right] ^{2}\right\rangle -\left\langle \Delta X\left( t\right) \right\rangle ^{2}}$


We assume that the accuracy of measuring the trajectory of a classical particle using Equation (13) is six orders of magnitude worse than the accuracy of measuring the trajectory of a quantum atomic cloud using Equation (6), which is achievable by atomic interferometry methods (Dubetskii et al., Reference Dubetskii, Kazantsev, Chebotayev and Yakovlev1984). Nevertheless, ideally, the accuracy of navigation in ${1}$ h does not exceed $150\,{\mu }$
 m and practically remains the same for different trajectories.
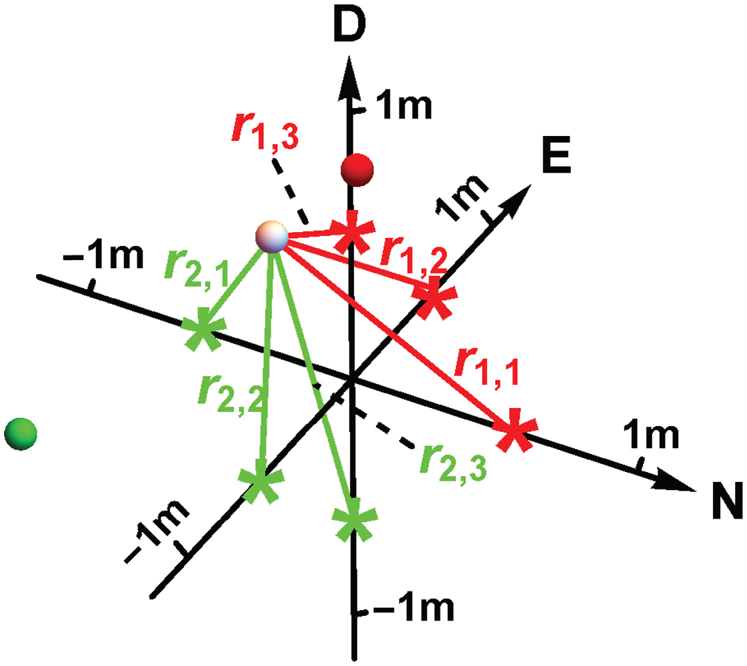
Following Jekeli (Reference Jekeli2001), in the future we will assume that the north-east-down (NED) local frame is installed on the platform. Likewise for GPS, we propose to install in the NED frame a sensor system to measure the distance to the particle, which we will call the local positioning system (LPS), see Figure 3. As in GPS, we will call these sensors satellites.
(Colour online) LPS – measurement of the particle's coordinates. From the distances to three red satellites, one determines two positions of the particle, true white and false red. Similarly, for green satellites, one gets true white and false green. The true solution is obviously the same for the red and green satellites

Our code can be used for any satellite location. However, in the simulation, we use only satellites located on the frame axes. When three satellites are located on the positive semi-axes of the system, the vectors connecting the particle and the satellites do not lie in the same plane, and the coordinates of the vector $\mathbf {x}$ can be obtained from the distances to the satellites. The equations for $\mathbf {x}$
 have two solutions, one true, the other false. To overcome this ambiguity, one can use an additional system of satellites located, for example, symmetrically on negative semi-axes and choose as true the solution that is the same for both satellite systems. During the simulation, pseudo-random corrections were made to the exact distances using a normal random number generator (Box and Muller, Reference Box and Muller1958) with SD $\delta _{x}$
 .
At the launching time, we need to restore the values of the parameters listed in Equation (12). Errors in restoring these parameters degrade the navigation accuracy by several orders of magnitude. These parameters can be restored using conventional IMUs. In this case, we come to another kind of hybrid. Our code can be included in the code of operation of such a hybrid. In this paper, however, we will consider the possibilities of reconstructing $Z$ by launching particles with different velocities and simultaneously measuring their coordinates and velocities through time $T$
 .
The most significant factor affecting the accuracy of navigation is the platform rotation. In the case of atomic navigation, it was proposed to use a gimbal (Kasevich and Dubetsky, Reference Kasevich and Dubetsky2008) to reduce the effect of rotation. In this paper, we also assume the presence of a gimbal, which we define as reference systems that perform only noisy rotations at small angles, with zero mean value and SD $\delta _{g}$ . In the future, we will determine the quality of the gimbals, SD $\delta _{g}$
 , to achieve the ultimate goal of navigation set up in Equation (8).
An elementary loop of the navigation is the restoration of the position, velocity, orientation, and rate of rotation of the platform at time $t_{2}=t_{1}+T$ from their values at the time of the particle launch $t_{1}$
 . Then the restored parameters at the time $t_{2}$
 are used for navigation at time $t_{3}=t_{2}+T$
 and so on. We will call this method first-order navigation. Due to the large Doppler broadening of the spectral lines, one could not use both the atomic interferometry (Dubetskii et al., Reference Dubetskii, Kazantsev, Chebotayev and Yakovlev1984) and the Ramsey fringes (Ramsey, Reference Ramsey1949) in this method. We propose installing velocimeters together with satellites in the NED frame. Measuring the velocity of a particle in the platform frame will restore the velocity of the platform $V(t_{2})$
 , while measuring the distance difference between particles launched at different velocities will restore the orientation of the platform $R( t_{2})$
 , and finally, measuring the velocity difference of these particles will restore the rotation rate of the platform $\mathbf {\Omega }(t_{2})$
 .
The severe requirements on the platform velocity recovery can be mitigated in the case of the second-order navigation, when one measures the particle's positions at three times $\{ t_{1},t_{2}=t_{1}+T,t_{3}=t_{1}+2T\}$ and employs the second-order difference by Equation (5b) to restore the platform position $\mathbf {X}(t_{3})$
 . The reason here is that even with an arbitrary trajectory of the platform, the difference by Equation (5b) does not depend on the initial velocity of the particle if the platform does not rotate and the Earth's gravitational field is uniform. The weak inhomogeneity of the field and the noisy, small rotation of the gimbal lead to such a weak dependence of $\mathbf {p}$
 on the platform velocity that there is no need for velocimeters.
The requirements for the quality of the gimbal can also be relaxed if one launches simultaneously three particles with different velocities and restores the orientation of the gimbal from the differences in their trajectories. In the case of atom interferometry, an iterative method for this kind of restoration was developed by Kasevich and Dubetsky (Reference Kasevich and Dubetsky2008). Here, we generalise this method to the case of LPS navigation (LPS-N).
We offer here five varieties of LPS-N:
1.1 first-order LPS-N, the quality of the gimbal is high enough to neglect its rotation;
1.2 first-order LPS-N, the quality of the gimbal is sufficient to neglect its rotation, but one does not neglect the rate of rotation, and restores it by applying data from velocimeters;
1.3 first-order LPS-N, one restores the orientation and rotation rate of the gimbal by applying data from satellites and velocimeters;
2.1 second-order LPS-N, the quality of the gimbal is high enough to neglect its rotation;
2.2 second-order LPS-N, one restores the orientation of the gimbal from the satellite data.
The paper is arranged as follows. The exact expression for the trajectory of a particle in the field of the rotating Earth, when the potential of this field is expanded to the first-order gravity-gradient terms, is obtained in Kasevich and Dubetsky (Reference Kasevich and Dubetsky2005). For the completeness of this study, we derive this expression in the next section. The technique of restoring the orientation, rotation rate, velocity, and then the position of the platform is described in Section 3 for LPS-N of the first-order and in Section 4 for LPS-N of the second-order. The results of the simulation and their discussion are carried out in Section 5. In Appendix C, we describe the model of the Earth's gravitational field accepted in our code.
2. Particle trajectory
If the source of gravity rotates at a constant velocity $\mathbf {\Omega }_{E}$ , then the trajectory of the particle obeys the following equation of motion:

where $\mathbf {v}_{E}=\overset {_{\bullet }}{\mathbf {X}}_{E}$ is the velocity of the particle in the rotating Earth frame, $U( \mathbf {X})$
 is the potential of the gravitational field. If the motion occurs in a small vicinity of the point $\mathbf {X}_{c}$
 , then expanding the potential to the second-order terms,

where

and


are the gravitational acceleration and the first-order gravity-gradient tensor, one comes to the equation of motion

where


and the tensor $\underline {\Omega }_{E}$ is given by

where $\varepsilon_{ikm}$ denotes the fully antisymmetric tensor. Despite the fact that Equation (18) is a linear system of equations with permanent coefficients, most of the papers used expansions of $\mathbf {x}_{E}(t)$
 into power series over time. In Dubetsky and Kasevich (Reference Dubetsky and Kasevich2006) and Bongs et al. (Reference Bongs, Launay and Kasevich2006), the terms up to the fourth order were calculated, the fifth- and sixth-order terms were obtained by Hogan et al. (Reference Hogan, Johnson and Kasevich2008), and the expansion to the seventh order was obtained by (Kleinerta et al., Reference Kleinerta, Kajaria, Roura and Schleich2015). The exact solution of Equation (18) is obtained in the patent of Kasevich and Dubetsky (Reference Kasevich and Dubetsky2005). Here we derive exact solutions for arbitrarily large values of the tensor $\underline {q} ( \mathbf {X}_{c})$
 and the rate of rotation of the gravity field source, $\mathbf {\Omega }_{E}$
 . In this case, we are using the method proposed by Kotkin and Serbo (Reference Kotkin and Serbo1971). Consider first the homogeneous equation $[ \mathbf {g}( \mathbf {X}_{c}) =0]$
 . Its solution is $\mathbf { x}_{E}( t) =\mathbf {x}( \omega ) e^{-i\omega t}$
 , where $\omega$
 and $\mathbf {x}( \omega )$
 are the eigenvalue and eigenvector of the matrix

where $I$ is the unity matrix. One notices that owing to the symmetry of the tensor $\underline {q}( \mathbf {X}_{c})$
 , the determinant $\vert \underline {A}( \omega ) \vert$
 is an even function $\omega$
 , $\vert \underline {A}( \omega ) \vert =\vert \underline {A}( -\omega ) \vert$
 , and, therefore, the characteristic equation

is reduced to the third-order equation for $\omega ^{2}$ ,

where


Equation (23) has six roots


where $z_{i}$ is the root of the equation $z^{3}+pz+s=0$
 and


The eigenvectors are given by

Let us return now to Equation (18). We introduce a six-dimensional vector

which obeys the equation

One gets that the solution is given by


where the $6\times 6$ matrix $\underline {Y}( t)$
 is composed of eigenvectors,

Since

one can represent the matrix in Equation (32) as

where $3\times 3$ -matrices $\underline{x} _{\pm }$
 and $\omega$
 are composed of the eigenvectors in Equation (27) and eigenfrequencies


To inverse the matrix $\underline {Y}( 0)$ , one can use the method developed by Chui and Chen (Reference Chui and Chen1999). It is convenient to represent the $6\times 6$
 -matrices $\underline {\Phi }(t)$
 and $\underline {Y} ^{-1}( 0)$
 as $2\times 2$
 -matrices


in which the matrix elements are $3\times 3$ -matrices. Then one gets for $b_{mn}$


Solving Equations (37) and substituting their solutions consequently in Equations (31) and (30), after integrating Equation (30), one arrives at the next exact solution of Equation (18):


where


3. First-order LPS-N
Suppose that in the platform frame, one launches a particle at the time $t=0$ from the point $\mathbf {x}(0)$
 at the velocity $\mathbf {v} (0)$
 . After the interrogation time $T$
 , one measures the position and velocity of the particle $\{ \mathbf {x}(T), \mathbf {v}(T) \}$
 using the local system of satellites and velocimeters and applying Equations (A.1) and (A.4). The navigation purpose is to restore the position, orientation, velocity, and rotation rate of the platform, $\{ \mathbf {X}(T), R(T), \mathbf {V}(T), \mathbf {\Omega }(T) \},$
 from these measurements.
After the launch, the particles are decoupled from the platform and move into the Earth's gravitational and inertial fields. Its position with respect to the Earth's origin is given by

where $\mathbf {x}_{E}(t)$ is obtained from Equation (38a). If the origin of the platform frame moves along the trajectory $\mathbf {X}(T)$
 , then

Since the derivative of the rotation matrix is determined by the rotation rate, $\dot {R}(T) =-\underline {\Omega }(T) R(T) ,$ one obtains for the particle velocity

The particle is detached from the platform only after launch, at $T>0$ . If $T=0$
 , one gets from Equations (41) and (42),


Then one gets


Equation (44a) gives the exact trajectory of the particle in the platform frame, which can, for example, be used for exact calculation of the AI phase, instead of the approximate calculations in previous papers (Bongs et al., Reference Bongs, Launay and Kasevich2006; Dubetsky and Kasevich, Reference Dubetsky and Kasevich2006; Hogan et al., Reference Hogan, Johnson and Kasevich2008; Kleinerta et al., Reference Kleinerta, Kajaria, Roura and Schleich2015). Like in the previous studies (Kasevich and Dubetsky, Reference Kasevich and Dubetsky2005; Kasevich and Dubetsky, Reference Kasevich and Dubetsky2008), here we are going to use Equation (44) to restore the position and velocity of the platform. For them, one has


3.1 Rotation rate restore
To obtain the position and velocity of the platform, it is necessary to initially restore the rotation rate $\mathbf {\Omega } (T)$ and the rotation matrix $R(T)$
 . For these restorations, one can use a differential technique. If from the same point one launches three particles with velocities $\mathbf {v}$
 , $\mathbf {v}^{\prime }$
 , and $\mathbf {v}^{\prime \prime }$
 , then using Equation (44b) to get the velocity differences at the time $T$
 ,


one arrives at the following equation for $\mathbf {\Omega }(T)$ :

where


One sees that one velocity difference, for example, $\delta \mathbf {v}_{1}$ , is not sufficient, as it allows us to restore only the component of the rotation rate perpendicular to $\mathbf {a}_{1}$
 . That is why one starts with three particles and considers two velocity differences. Decomposing $\mathbf {\Omega } (T)$
 as

one gets from Equation (48) for $i=1$ ,

Substituting Equation (51) into Equation (50) and then into Equation (48) for $i=2$ , one obtains the equation for $\Omega _{\parallel }(T)$
 . After solving it, one arrives at the following result:


3.2 Rotation matrix restore
Here, also, one should use the differential technique (Kasevich and Dubetsky, Reference Kasevich and Dubetsky2005; Kasevich and Dubetsky, Reference Kasevich and Dubetsky2008). For the same three particles with launch velocities $\mathbf {v}$ , $\mathbf {v} ^{\prime }$
 , and $\mathbf {v}^{\prime \prime }$
 instead of the velocities’ difference given by Equation (47), one now measures the positions’ differences,


which depend only on the rotation matrices,


where $\delta \mathbf {v}_{i}$ is defined in Equation (49c). The matrix $r$
 in the Rodriguez representation (Rodrigues, Reference Rodrigues1840) is given by

where the vector $\boldsymbol{\delta }$ contains three parameters that define the rotation. Kasevich and Dubetsky (Reference Kasevich and Dubetsky2008) proposed an iterative method for calculating the angle of rotation $\boldsymbol{{\delta }}$
 from the phase differences of six AIs, in which the atoms were launched at different speeds, and the wave vectors did not lie in the same plane. Here we adapt this method for the case of LPS.
In the case of rotation at a small angle, $\delta \ll 1$ , when $r\approx 1-\underline {\delta }$
 , and matrix $\underline {\delta }$
 defined as

one gets that

where

and $\vert b_{i}\vert \ll \vert a_{i}\vert$ . This equation coincides with Equation (48), and hence,

where $\mathbf {f}$ is the vector function defined in Equation (52b).
Let us now turn to the general case. Then, from Equation (54a), one gets

where $\mathbf {n}=\boldsymbol{\delta }/\delta$ . One can introduce the parameter

and expand the solutions of Equation (60) in the series


The lower-order terms in these series are equal:


In Appendix B, we have derived the recurrence relations for the coefficients $\{ \mathbf {n}^{( s-1) },\delta ^{( s) }\}$ .
4. Second-order LPS-N
In this case, one restores the trajectory and orientation of the platform $\{ \mathbf {X}(2T), R( 2T) \}$ from their previous values at moments $t=0$
 and $t=T$
 , using a second-order difference

in which the particle positions in the platform frame, $\mathbf {x}(T)$ and $x(2T)$
 are measured using satellites.
An important advantage of such navigation is the tremendous decrease of the navigation sensitivity to the initial velocity of the platform. For successful navigation, it is sufficient to put (Kasevich and Dubetsky, Reference Kasevich and Dubetsky2005; Kasevich and Dubetsky, Reference Kasevich and Dubetsky2008)

where, for a given loop of the navigation cycle, $t\in [ 0,2T]$ , the positions of the platform $\mathbf {X}(-T)$
 and $\mathbf {X}(T)$
 are restored in the previous loops.
If all the particles are launched from the center of the platform $[ \mathbf {x}( 0) =0]$ , then the lever-arm term, $\mathbf { \Omega }(0) \times \mathbf {x}(0)$
 , disappears, and simultaneously the need to restore the angular velocity of the platform rotation $\mathbf {\Omega }(0)$
 disappears also. Let us also assume for simplicity that $\mathbf {X}_{c}=\mathbf {X}(0)$
 . Then,

In the absence of rotation $[ R( t) =I]$ and for a uniform, non-rotating gravitational field,

the first term in Equation (66) disappears and the difference $\mathbf {p}$ does not depend on the initial velocity of the platform. The simulation showed that despite the weak inhomogeneity of the field, the presence of inertial forces due to the rotation of the Earth and the small rotations of the gimbal, the first term remains so small that the error in restoring the velocity with Equation (65) has a much smaller impact on the accuracy of navigation than other factors, and one may not take it into account. Then the coordinate of the platform $\mathbf {X}( 2T)$
 is restored as

If one neglects the rotation of the gimbal, assuming $R(2T) =R(T) =R(0)$ , then no further steps are required. Otherwise, like in Section 3.2, one launches three particles simultaneously from the origin with velocities $\mathbf {v}( 0) =\mathbf {v}$
 , $\mathbf {v}^{\prime }$
 , and $\mathbf {v}^{\prime \prime }$
 , and measures the double differences


which lead to the equations for the rotation matrix $R(2T)$ . In this case, one comes to the equation

where


where $\delta \mathbf {v}_{i}$ is defined in Equation (49c). After that, one follows the method of solving Equation (54a), described above and in Appendix B, with the only difference that now $\mathbf {a}_{i}$
 is given by Equation (71b) and

5. Simulation results
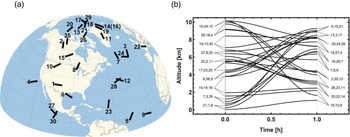
We test the LPS-N on an ensemble of 30 randomly generated platform trajectories, shown in Figure 4.
(Colour online) Platform trajectories. Platform moves along each trajectory during the time $t_{n}=1$ h. The trajectories are chosen so that the platform velocity $V(0) =V(t_{n}) =0$
 and it reaches a maximum at $t=t_{n}/2$
 . Only those trajectories were selected for which $V(t_{n}/2) \in [ 200\,\text {m/s}, 240\,\text {m/s}]$
 . (a) Trajectories latitudes and longitudes. (b) Time dependences of the platform trajectories’ altitudes. (The trajectories are randomly generated in the western part of the Earth's northern hemisphere for the sole purpose that they are visible in panel (a))

Regarding the orientation, we assume that the NED frame has been installed initially on the platform, i.e. the initial gimbal rotation matrix is given by

where $\phi$ and $\lambda$
 are initial latitudes and longitude of the platform. Later on, the gimbal commits only random noisy rotations at small angles of the order of gimbal stabilisation level $\delta _{g}$
 , in the frequency band $f_{g}=100$
 Hz.
Our navigation code consists of the following points.
1. One calculates the exact values of the particle's coordinate and velocity in the platform frame using Equations (44) and (38b–38d) and exact expressions for the trajectory and rotation matrix of the platform and the Earth's gravitational field (see Appendix C below).
2. Coordinates and velocities provide us with accurate ‘readings’ of satellites and velocimeters. One exploits the pseudo-random normal number generators (Box and Muller, Reference Box and Muller1958) with SD $\delta _{x}$
 and $\delta _{v}$ to make corrections to the sensors’ readings.
3. The sensor data are the input parameters for restoring the coordinates and velocities in the platform frame using Equations (A.1) and (A.4).
4. The orientation of the gimbal is either assumed unchanged (for methods 1.1, 1.2, 2.1), or restored (for methods 1.3 and 2.2). In the last case, one solves Equation (60) using the iterative method (see Appendix B).
5. If necessary, one restores the instantaneous rotation rate of the gimbal $\mathbf {\Omega }(T)$
[according to the Equation (52a)].6. Finally, after restoring the velocity of the platform [see Equations (46) or (65)], one obtains the desired coordinates of the platform from Equations (45) or (68).


With the exception of the first, in each loop of the navigation cycle, one uses the initial position, speed, orientation, and rotation speed of the platform restored in the previous loop. As a result, the navigation error $\Delta X$ accumulates and increases by seven orders of magnitude, from $1\,{\mu }$
 m to $10$
 m at the end of the cycle.
The accuracy of navigation increases with more accurate measurement of the position of the particles in the platform frame. To achieve this, we propose using not only one set of satellites and velocimeters, but ensembles of these sensors. Specifically, during the simulation, we assumed that there are $n_{x}$ satellites located in the platform on each of the semi-axes. Then, it is obvious that the ensemble of measured coordinates consists of

elements. At the same time, on each of the axes, we have arranged $n_{v}=n_{x}^{2}$ velocimeters so that the ensemble of velocity measurements consists of the same number of elements,

The simulation showed that the navigation error on one side is not sensitive to the position of satellites and velocimeters, and on the other side depends on the values of the particles’ launch velocities. We have not been able to find any qualitative or quantitative criteria to minimise this dependence. We emphasise that we are talking about a nine-dimensional velocity space $\{ \mathbf {v,v}^{\prime }\mathbf {,v}^{\prime \prime }\}$ . Therefore, we randomly selected the velocity components in a given range, gradually increasing the size of this range until, at $n_{x}=1$
 , the navigation accuracy dropped to the value of $\Delta X( t_{n}) \sim 100$
 m. We expected that with an increase in the number of satellites along each of the semi-axes $n_{x}$
 and a simultaneous increase in the number of velocimeters $n_{v}=n_{x}^{2}$
 , the error of the navigation will drop to the desired level of $\Delta X( t_{n}) \sim 10$
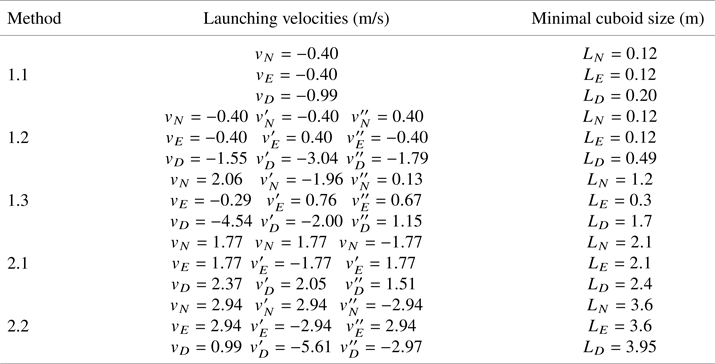
 m. The simulation confirmed this expectation (see the red curves in the fourth column of Figure 6). The values of launching velocities chosen for the simulation are given in Table 1.
Launching velocities chosen for navigation simulations and corresponding sizes of the navigation cuboids

We assume that a navigation cuboid with dimensions $\{ L_{N},L_{E},L_{D}\}$ is installed in the NED-coordinate system of the platform, which is shielded from all fields and in which a vacuum is maintained sufficient for one to believe that particles move freely only under the action of the Earth's gravitational field. The minimal sizes of the cuboid at which there will be no collision of particles with the cuboid walls are also given in Table 1. Since in the second-order LPS-N one observes the particle motion during the time $2T$
 , the sizes of the cuboid are larger than for the first-order LPS-N at the given $T$
 .
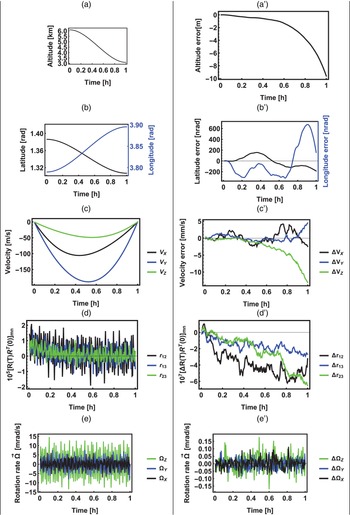
To illustrate the LPS-N, the build up in time of the navigation errors when the platform moves along trajectory 20 (see Figure 4) is shown in Figure 5. Although the various plots on this and the next figures may be difficult to read at standard magnification, they can be read easily using the zoom feature when read online in PDF format. The navigation method 1.3 is used here. In this method, the largest number of platform parameters are restored, the orientation of the gimbal, then sequentially the rotation rate of the gimbal, the velocity, and finally the position of the platform. At the same time, only an error in restoring orientation is caused by the accuracy of measuring the difference in the coordinates of particles launched at different velocities. Errors in restoring the subsequent parameter are related both to the quality of satellites and velocimeters, and to the accuracy of restoring previous parameters. It is for this reason that the error in Figure 5$(a^{\prime }$ ) is five orders of magnitude larger than the error in Figure 2.
(Colour online) Time dependence of the parameters of the platform motion and rotation (plots $i$ ) and the errors of their restoring (plots $i^{\prime }$
 ), where $i=a,\ldots,e$
 . Trajectory 20 (see Figure 4). LPS-N method 1.3. Plots (a,a′) for the altitude of the platform origin trajectory, plots (b,b') for the latitude and longitude of this trajectory, (c,c') for the platform velocity $\boldsymbol{V}(t)$
 , (d,d') for the matrix elements of the rotation matrix $r(t) =R(t) R^{T}(0)$
 , (e,e') for the platform rotation rate $\mathbf {\Omega }(t)$


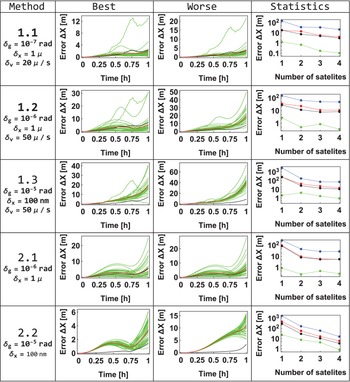
The simulation results are summarised in Figure 6.
(Colour online) Five LPS-N methods. Results of simulations for the same 30 trajectories as in Figure 2 generated for a navigation process. This was done for 11 sets of pseudo-random errors of satellites and velocimeters. As a result, one has an ensemble of 330 $\Delta X( t)$ -dependences. The average errors over this ensemble for $t_{n}=1$
 h of the navigation are shown by red dots in the fourth column. In the same plots, the blue, green, and black dots show the maximum and minimum values of the error and SD for the entire ensemble, respectively. The $\Delta X(t)$
 -dependences for 30 platform trajectories with a given set of sensors’ errors are shown in the second and third columns. They contain plots for those sets of sensor errors at which one of the $\Delta X(t)$
 curves reaches the minimum (best) or maximum (worst) value of $\Delta X(t_{n})$


The five rows of the table in Figure 6 correspond to three first-order LPS-N methods (1.1, 1.2, and 1.3) and two second-order LPS-N methods (2.1 and 2.2). One sees that in method 1.1, when it is assumed that the quality of the gimbal is sufficient to neglect the rotation at all, to achieve the ultimate goal of navigation of Equation (8), it is necessary to use a gimbal with a root-mean-square (rms) of $\delta _{g}=10^{-7}$ rad and velocimeters with an accuracy of $\delta _{v}=20$
 $\mathrm {\mu }$
 /s. The requirements can be mitigated for the gimbal by an order of magnitude, and for the velocimeters by a factor of 2.5 if one uses method 1.2, when only the angular rate of the gimbal rotation is restored. Moreover, one can weaken the requirement for a gimbal by an order of magnitude in method 1.3, when both the rate of rotation and the orientation of the gimbal are restored, but satellites with an rms error of $\delta _{x}=100$
 nm are needed.
If the second-order difference in Equation (5b) is used, then, due to its low sensitivity to the platform velocity, one may not need to use the velocimeters at all. For both second-order LPS-N methods, 2.1 and 2.2, we verified that even the use of ideal velocimeters, with zero error of velocity measurement, has no effect on the navigation error $\Delta X(t)$ . In addition, the lever-arm term disappears, when one launches all three particles from the same point [see Equation (66)], and therefore the platform rotation rate may not be restored. Finally, with the second-order LPS-N, the requirements for the quality of the gimbal are weakened by an order of magnitude (compare the fourth and first rows in Figure 6).
We have verified that with another random choice of trajectories and orientations, the navigation error $\Delta X(t)$ remains the same of the order of its magnitude.
In conclusion, the simulation showed that the LPS can provide navigation accuracy in 1 h of the order of 10 m, if a gimbal with rms $\delta _{g}=10^{-6}$ rad and satellites, distance sensors, with an error $\delta _{x}=1\,\mu$
 m are used.
However, the reverse formulation of the question is also possible. If the accuracy of the satellites and velocimeters, the rms of gimbal, and the navigation box sizes are given, then our code will allow us to determine the expected accuracy of LPS-navigation $\Delta X$ for a given time $t_{n}$
 .
Acknowledgements
The author is grateful to Drs. K. Tintschurin, B. Young, I. Teper, and A. Zorn for the fruitful discussions.
Appendix A. Particle's position and velocity measurements in the platform frame
A.1 LPS – measurement of the position
Let us assume that there are three satellites installed on the platform at the points $\mathbf {s}_{i}=( x_{i},y_{i},z_{i}) ^{T}$ , which measure the distances to a given point $\mathbf {x}=( x,y,z) ^{T},$
 $r_{i}=\vert \mathbf {x}-\mathbf {s}_{i}\vert$
 . Then for the point coordinates, one has (Shebshaevich et al., Reference Shebshaevich, Dmitriev, Ivancevich, Kalugin, Kovalevsky, Kudryavtsev, Kutikov, Molchanov and Maksyutenko1993)


A.2 Velocity measurement
For the first-order LPS-N, one must measure the velocity $\mathbf {v}$ of a particle in the platform frame at a given point $\mathbf {x}$
 . If three velocimeters, located at points $\mathbf {s}_{vi}$
 , measure the projection of the particle velocity

where

then for the particle velocity, one gets

where the matrix $\underline {n}$ is given by

Appendix B. Recurrent relations
To decompose

one needs to get a series for a degree

To calculate the coefficient $\delta _{v}^{(p) }$ , one truncates Equation (62a) with the first $(\nu +1)$
 terms

Then,

where $\delta _{ik}$ is the Kronecker symbol, and so

Substituting the decomposition Equation (B2) into Equation (B1), one finds that


where $[ a]$ is the Entire part of a. Similarly, one gets


Multiplying the power series in Equation (60), one comes to the following equation for the coefficients:

where

It follows from Equations (B6b), (B5), and (63a) that

and for $s=1$ , one gets the equation

the solution of which, taking into account the normalisation condition, $\vert \mathbf {n}^{( 0) }\vert =1$ , coincides with Equation (63).
The coefficients of our interest, $\{ \mathbf {n}^{( s-1) },\delta ^{( s) }\}$ are contained only in the terms $\mathbf {w}_{i0}$
 and $\mathbf {w}_{i( s-1) }$
 . For $\mathbf {w}_{i0}$
 from Equation (B10), one has

and from Equations (B6b), (B11), one gets

where

From Equation (B5) for $p=1$ and $\nu =s-1$
 , one sees that $\delta _{s-1}^{( 1) }$
 contains only one term at $\{ r_{1}\ldots r_{s}\} =\{ 0\ldots 01\}$
 , which is equal to

Then, with $s>1$ , one can rewrite Equation (B8) as


This is an equation of the same type as Equation (48) for the speed of rotation and Equation (57) for the angle of rotation $\boldsymbol{\delta }$ . By analogy with those equations, the solution of Equation (B16a) is

where the function $\mathbf {f}$ is given by Equation (52b). Let us consider the normalisation condition $\mathbf {n}^{2}=1$
 . It means that

Substituting here Equation (B17), one arrives to the expression for the coefficient $\delta ^{( s) },$

Equations (B17) and (B19) are the desired recurrent relations.
Consider them for the lowest orders. If $s=2,$ then from Equations (B7a) and (B14), it is obvious that $c_{0}=\frac {1}{2}$
 and $q_{2}=0$
 , which means that

and therefore,


For $s=3$ , one consequently finds that


after that,

And since $q_{3}=-\tfrac {1}{6}$ , then

and finally,

Appendix C. Earth's gravitational field
We consider navigation in the gravitational field of a rotating Earth. This field consists of normal and anomaly parts:

For the potential of the normal component, one has Heiskanen and Moritz (Reference Heiskanen and Moritz1967)


where $GM=3.986004418 \times 10^{14}$ m$^{3}$
 s$^{-2}$
 is the geocentric gravitational constant, $a=6.37813659 \times 10^{6}$
 m is the semimajor axis of the geoid, $e=\sqrt {f( 2-f) }$
 is the first eccentricity, $f$
 is polar flattening $(1/f=298.25765)$
 , $J_{2}=1.0826267 \times 10^{-3}$
 is a dynamic form factor of the Earth (Groten, Reference Groten2000), $P_{n}( x)$
 is the Legendre polynomial, $\theta$
 is the polar angle of the vector $\mathbf {X}$
 . From here, one derives the following expressions for the normal components of the gravitational acceleration and the gravity-gradient tensor of the Earth:


where


where $\mathbf {z}$ is a unit vector along the $Z$
 -axis.
For the anomaly part of the potential $U_{a}( \mathbf {X})$ , we could not find an analytical expression. Nevertheless, it is known from Committee on Earth Gravity from Space (1997) that the rms of anomalous acceleration

and from Plate 5 in Wang (Reference Wang2001), one can conclude that the rms of the anomaly part of the gravity-gradient tensor $\Gamma _{a}\sim 100$ E. It follows that the typical size of the anomaly field oscillations in space is

Unfortunately, the known analytical (Yu et al., Reference Yu, Jekeli and Zhu2003) or numerical (Jekeli et al., Reference Jekeli, Lee and Kwon2007; Wang, Reference Wang2016) approaches to the calculation of the gravitational field in the space around the Earth, including its anomalous part, cannot be used in our calculations, since they assume a known field on the Earth's surface. Therefore, for our code, we assumed that the anomalous potential consists of the sum of sinusoidal terms

in which the wave vectors were generated by the formula

where $r$ is a pseudo-random number uniformly distributed over the interval $[ 0,1]$
 , and for amplitudes $h_{aj}$
 , a generator of normal pseudo-random numbers was used, after which they were normalised by the condition

Of course, Equation (C7) has nothing common with reality [it follows, for example, that particles move in a hypothetical medium with a density of $\rho =-4\pi \triangle U_{a}( \vec {r}) /G\not =0,$ which can even be negative]. Despite this, we accept it, since at $n_{a}\gg 1$
 , the anomalous field has an rms given by Equation (C5) and a spatial period given by Equation (C6). In addition, the representation of the anomalous potential in the form of sums of harmonic terms can qualitatively correspond to the topographic undulations observed by the GRACE and GOCE satellites.