I. INTRODUCTION
Cavitation erosion is a particular form of material damage caused by the collapse of gas bubbles on a metal surface.Reference Knapp, Daily and Hammitt1–Reference Franc and Michel4 This collapse, which is usually associated to abrupt variations in pressure related to the fluid hydrodynamics, exerts on solid surfaces nearby a particular solicitation characterized by repeated and randomly distributed stress pulses of several hundreds of megapascal in pressure. The result is an extended damage of the surface characterized by small holes, named cavitation pits, with characteristic dimensions in the order of several tens of micrometer and whose accumulation can lead to the material failure.
One of the main issues in cavitation erosion is the estimation of the cavitation intensity or flow aggressiveness of a cavitating flow. This could be used for the prediction of material mass loss as a function of exposure time by proper modeling of the material response to cavitation erosion impacts.Reference Hammitt5–Reference Franc and Michel7 In this light, knowledge of the spectrum of impact loads is essential due to its capability to provide useful information on the flow aggressiveness. Conventional pressure sensors are commonly adopted to extract this information by mounting them in an appropriate location of a target material subjected to an erosion test. Even if a lot of efforts have been made in recent years to develop reliable techniques for the direct measurement of cavitation collapse pulses,Reference Franc and Michel7–Reference Okada, Hattori and Shimizu11 some issues are still present, as the sensors’ size is big compared to collapse size, they may not necessarily meet the required conditions for an accurate measurement of the impact loads, in particular in terms of resonant frequency and rise time, and they may be easily damaged by cavitation themselves.
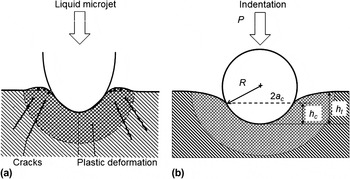
Actually, a major step in the estimation of the spectrum of impact loads could lie in the use of pitting test techniques. Pitting tests consist in performing erosion tests of small duration on samples mounted in the cavitating region of interest while adjusting the exposure time so that pits can be easily identified without any significant overlapping. Various techniques are available to analyze pits and measure their geometric characteristics such as depth, surface, and volume with high reliability.Reference Belahadji, Franc and Michel12–Reference Ahmed, Hokkirigawa, Ito and Oba14 However, no validated inverse procedure is available to infer the features of the stress pulses from the measured geometric characteristics of the pits. The issues in deducing the impact load responsible for each pit are due to several reasons, mainly related to the need of a proper modeling of the material behavior. Indeed, the material microstructure, grain size, modes of plastic deformation, and several other parameters can certainly affect the material response at the microscale; further, a proper understanding of the material response in case of impact loading is required to estimate the pressure distribution from pitting tests; and finally, a complex relation between the loading state and the material response is expected due to the high strain rates coupled with the multiaxial stress field generated during an impact. In this light, nanoindentation measurement techniques are supposed to provide useful information in assessing the intensity of cavitation impacts due to their intrinsically local nature, which is capable to provide information of the material behavior at the nano and microscale, and due to the similarities between substrate deformation under liquid impact and under indentation testing, where complex multiaxial stress fields occur (Fig. 1).
Sketches representing the analogy in the substrate deformation under (a) liquid impact and (b) indentation testing.

In recent years, instrumented indentation has become increasingly used in materials science and engineering,Reference Oliver and Pharr15–Reference VanLandingham17 being commonly used to measure mechanical properties such as elastic modulus, hardness, and fracture toughness at the micrometer scale owing to simple analytical formulations based on the elastic contact theory.Reference Oliver and Pharr18, Reference Field and Swain19 Instead, the reduction of stress–strain relationships from indentation tests is not as straightforward. Actually, it has been shown that such a relationship is unique only in case of non-self-similar indenter geometries (i.e., spheres), whereas uniqueness of the solution in not guaranteed for pyramidal or conical indenters.Reference Cheng and Cheng20 Pioneering work to determine expressions for indentation stress and strain was done by TaborReference Tabor21 and focused primarily on the response of metals to contact loading. Since that work, a number of studies have attempted to describe indentation stress–strain curves with some promising success.Reference Field and Swain22–Reference Juliano, VanLandingham, Weerasooriya and Moy29
In this work, we propose to use depth-sensing indentation techniques to calibrate the impact pressure due to bubble collapses by adopting the material itself as a sensor, which is able to detect the impact loads. To achieve this goal, indentation experiments with a spheroconical diamond tip were performed on a nickel–aluminum–bronze alloy and analytical procedures were developed to extract stress–strain curves from indentation loading–unloading data; experimental pitting tests were performed in a cavitation tunnel at four different operating pressures, and a conventional contact profilometer was adopted to measure the main geometrical characteristics (depth, surface, and volume) of the erosion pits; and finally, the coupling of the analysis of pitting tests with the material information obtained via the indentation tests allowed the evaluation of the pressure of cavitation impacts and its statistical distribution, thereby quantifying the hydrodynamic aggressiveness of the cavitating flow.
II. EXPERIMENTAL PROCEDURES
The Nickel–Aluminum–Bronze alloy C95800, hereinafter named NAB, was selected for testing in this work. The material composition consists of ∼11% aluminum, ∼83% copper, ∼4% iron, and ∼2% nickel. The average grain size of the alloy is ∼25 μm. This material was chosen because of its widespread use in applications subjected to cavitation erosion. Large samples with 100-mm diameter were carefully polished to a mirror finish using 0.05-μm diamond particle suspensions embedded in a soft polishing cloth pad in the final polishing step before testing.
Instrumented indentation tests were conducted with a Nano Indenter XP (Agilent Technologies, Inc., Santa Clara, CA) in ambient conditions using a spheroconical diamond probe tip with a 10-μm nominal radius. The tip area function was calibrated on a fused silica reference sample by performing 25 indentations at 500-mN maximum load with the continuous stiffness technique. The frame compliance was evaluated by using the same protocol. A 5 × 5 array of indents with 100-μm spacing was generated. Maximum depth was set to 5 μm. Tests were run at a constant indentation strain rate of 0.05 1/s. A 60-s hold period was included at the end of the loading phase to avoid the arising of time-dependent effects; a similar hold period was also added at the end of the unloading phase to account for thermal or electronic drift, the maximum allowed drift rate being set to 0.05 nm/s.
Pitting tests were conducted in a hydrodynamic tunnel described in detail by Franc.Reference Franc30 The maximum operating pressure of the tunnel is 40 bar, which corresponds to a maximum velocity of 90 m/s. Tests were made at four different velocities between 45 (corresponding to an upstream pressure of 10 bar) and 90 m/s. For each flow velocity, the test duration was adjusted to avoid any overlapping of pits which would result in measuring errors. The exposure time was only a few seconds for the tested alloy at the maximum velocity and was about 2.5 min at the lower velocity. The reader is referred to Franc et al.Reference Franc, Riondet, Karimi and Chahine31 for further details on the experimental set-up and tests.
III. ANALYTICAL PROCEDURES
A. Extraction of stress–strain curves from nanoindentation tests
To derive the relationship for stress and strain for indentation tests, the existing contact mechanics framework is considered.
In this context, TaborReference Tabor21 came to the experimental conclusion that equivalent strain at the indenter contact edge is given by:

In the previous formulation, a c is the projected contact radius, which can be calculated from the projected area of contact A c (estimated by evaluating the empirically determined indenter shape function A c= f(h c) from the tip area function calibration), and R is the end radius of the spherical tip [Fig. 1(b)]. The radius R is geometrically related to the contact depth h c (representing the actual depth at which the material surface is in contact with the indenter with reference to the indenter tip position) and the projected contact radius a c by:
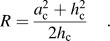
The contact depth h c [Fig. 1(b)] is calculated asReference Oliver and Pharr18:
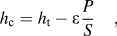
where ε is a geometric constant that is 0.75 for a paraboloid of revolutionReference Sneddon32 and S is the harmonic contact stiffness, representing the slope of the initial portion of unloading curve. This last term can be measured continuously throughout the duration of loading by employing the continuous stiffness technique.Reference Oliver and Pharr15 The continuous stiffness is determined by superimposing a small oscillating excitation displacement amplitude z o at a frequency ω on top of the quasistatic applied load and using the relation:

where F o is the force amplitude resulting from z o, φ is the phase angle shift of ω, K s is the support spring stiffness, M is the mass of the indenter column, and K f is the frame stiffness. In the performed indentation experiments, zo was set to 2 nm and ω to 45 Hz; values for K s, M, and K f are determined by the response of a free-hanging indenter tip.
The definition of true indentation stress is:

where P/A c is the mean contact pressure and ψ is the constraint factor. This factor, which is a function of the equivalent plastic strain, has been found to be ∼1.11 when a material is in the purely elastic regime and ∼2.87 when full plasticity has been developed.Reference Francis33 In the intermediate elastic–plastic regime, we correlated the constraint factor to the h t/h c ratio as proposed by Juliano et al.Reference Juliano, VanLandingham, Weerasooriya and Moy29:
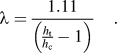
The final expression for the constraint factor ψ is:
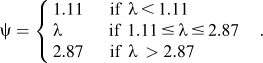
Therefore, ψ can be easily calculated from the experimental measurements of load P and displacement into surface h t and from the Eqs. (3) and (4).
The Ramberg–Osgood lawReference Ramberg and Osgood34:
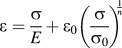
was used to describe the nonlinear relationship between the stress σ and strain ε and the work-hardening phenomenon occurring in metals such as the NAB alloy here used. In Eq. (8), E is the Young’s modulus, σ 0 is the reference stress related to the permanent strain ε 0, and n is the strain-hardening index. The value ε 0 can be seen as a yield offset and was fixed at the commonly accepted value of strain of 0.2%, which means that σ 0 represents the reference stress at 0.2% of plastic strain.
B. Analysis of pitting tests
The analysis of a pitting test consists in determining, for each pit, the coordinates of its center, its maximum depth, its equivalent diameter, and the associated deformed volume. In the present work, a conventional contact profilometer using a stylus with a tip radius of 2 μm was used to measure the surface of the sample after pitting.Reference Franc30, Reference Franc, Riondet, Karimi and Chahine31 The mesh size for describing the surface is 1 × 1 μm2, and several surfaces (typically four) of 2 × 4 mm2 were analyzed in each sample to have a large enough number of pits for the statistical analysis. All measurements were made in the region of maximum pitting damage.
To identify the pits, a cutoff depth was applied when postprocessing the measured surface. In this work, the cutoff depth was chosen at 0.5 μm below the original material surface. This value is considered as a good compromise to avoid both the detection of erroneous pits, which would lead to an overestimation of the pitting rate, and the merging of a pit with neighboring pits or with small surface defects, which would alter pit size estimation.Reference Franc, Riondet, Karimi and Chahine31
In the analysis of pitting tests , pit size is defined as the equivalent diameter of the section of the pit by the plane x = 0.5 μm, pit depth is counted from the original material surface x = 0, and the pit volume is calculated using a fully three-dimensional approach. It should be remarked that no assumption is made on the shape of the pits which, in particular, are not assumed axisymmetric for volume computation at this stage of the work.Reference Franc30, Reference Franc, Riondet, Karimi and Chahine31
C. Evaluation of the pressure of cavitation impacts and its statistical distribution
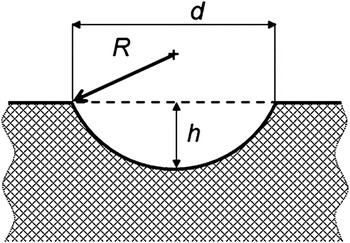
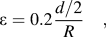
The analogy between material deformation under liquid impact and under indentation testing was used to evaluate the pressure of cavitation impacts. At this point, we assume that a cavitation pit could be completely characterized by its depth and diameter and we hypothesize spherical cap geometry for modeling the cavitation pit (Fig. 2). With the assumptions above, Eq. (1), which gives the equivalent strain under spherical indentation, can be reformulated as:
Spherical cap geometry adopted to model the cavitation pits.

where d represents the diameter of the cavitation pit. Since R can be geometrically related to the pit depth h and the diameter of the cavitation pit d by rewriting Eq. (2):

the strain of a cavitation pit results:
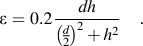
Therefore, the measurement of pits diameter d and depth h allows determining the strain ε of a cavitation pit.
The pressure σ of cavitation impacts is calculated by applying Eq. (11) in conjunction with the stress–strain relationship [Eq. (8)]. As the above procedure was systematically applied to each detected pit, a distribution of the hydrodynamic impact pressure was obtained. Since the distribution of these pulses is statistical, the probability density function of these pulses’ amplitudes can be established from the histogram of the number of impacts versus impact pressure amplitude experimentally determined.
Finally, to define a mean value representative of the whole spectrum for each pressure level, an averaging procedure based on energy arguments was adopted. Since, from a dimensional viewpoint, the product of pit volume V and impact pressure σ has the units of energy, the mean impact pressure σ m was calculated by the following averaging procedureReference Franc30:
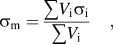
where the summation is relative to all the identified pits. Here, V is the pit volume obtained directly from the analysis of pitting test (see “Analysis of pitting tests”).
IV. RESULTS
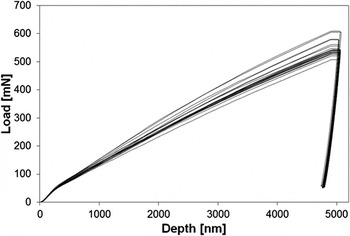
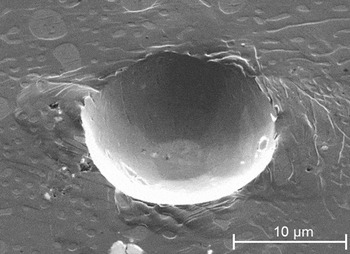
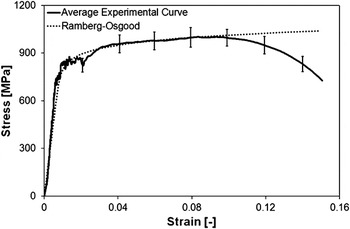
The loading–unloading curves obtained from the indentation experiments are reported in Fig. 3. Although the unloading branches of the load–displacement indentation curves are well superimposed, a relatively low degree of reproducibility was obtained in the loading branches at different locations. This is due to the presence of inclusions and precipitates peculiar of NAB alloy.Reference Pidaparti, Aghazadeh, Whitfield, Rao and Mercier35–Reference Ni, Xue, Wang, Xiao and Ma37 Scanning electron microscopy (SEM) imaging revealed no significant pileup of the material for a penetration depth of about 5 μm (Fig. 4). The loading–unloading indentation curves were converted to stress–strain curves by adopting the procedure detailed in “Extraction of stress–strain curves from nanoindentation tests.” The average stress–strain curve obtained from the elaboration of the 25 indentation curves is reported in Fig. 5. The initial elastic behavior is followed by an extended region of plastic flow with relatively low material hardening up to ε = 0.084; for further values of strains, a softening behavior is evidenced. The stress corresponding to a strain of 8.4% has been considered as the ultimate strength σ U: indeed, this descending branch of the loading–unloading curve means the impossibility for the material to further sustain loads when subjected to high strains and is a typical sign of failure in samples subjected to confined compression, as in an indentation test.
Loading–unloading indentation curves obtained from the 5 × 5 indentation tests at 5-μm maximum depth on the Nickel–Aluminum–Bronze (NAB) alloy.

Scanning electron microscopy image of a single spherical indentation in the NAB alloy.

Average stress–strain curve obtained from the elaboration of the 25 loading–unloading indentation curves reported in Fig. 3 (continuum line). Standard deviations are calculated at 0.02 deformation intervals up to ε = 0.14. The Ramberg–Osgood law trend identified from best fitting of the experimental curves is reported too (dotted line).

The Ramberg–Osgood law [Eq. (8)] best fitting the experimental stress–strain curves is reported in Fig. 5. The adopted material model fits extremely well with both the initial elastic range of material behavior and the extended work-hardening region occurring in this alloy. The fitting results are presented in detail in Table I, where the mean value and standard deviation of the fitting parameters E, σ 0, and n over the 25 experimental curves are reported together with the correlation coefficient (R 2) value. Due to the above considerations, the fitting was performed for deformations up to 8.4%. The ultimate strength σ U calculated by the Ramberg–Osgood law and the related strain ε U are also reported.
Best fitting of the experimental stress–strain curve with the Ramberg–Osgood model [Eq. (8)].

The mean value and standard deviation of the fitting parameters E, σ 0, and n over the 25 experimental curves are reported together with the correlation coefficient value R 2. The ultimate strength σ U and strain ε U are also reported.
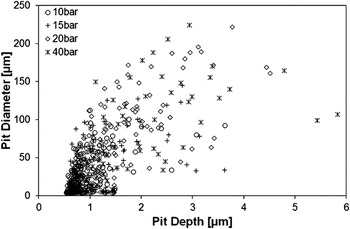
The analysis of pitting tests and the subsequent data allowed the identification of each pit and the measurement of its main geometrical features (maximum depth, mean diameter, surface, and volume). A representation of the pit depth–pit diameter correlation is reported in Fig. 6: here, each point represents one pit at the four different values of the upstream pressures (10, 15, 20, and 40 bar). Pit depth and pit diameter can be considered as independent since no clear correlation between these two parameters is noticeable. In other words, large pits are not necessarily deeper, and no definite geometric similarity is observed on pit profiles.
Pit depth–pit diameter correlation at the four tested upstream pressures (10, 15, 20, and 40 bar) obtained from the analysis of pitting tests. A total number of 600 pits are plotted.

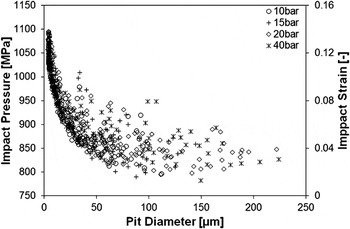
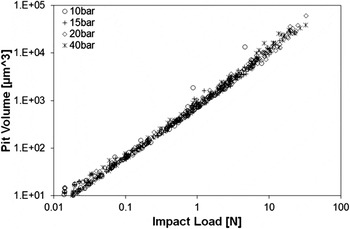
For each pit, the pressure of cavitation impacts and its statistical distribution were established by the correspondence between pit geometry and strain of a cavitation pit determined by Eq. (11) coupled with the stress–strain relationship in Eq. (8). Figure 7 reports a plot of the impact pressure–pit diameter correlation for the four tested upstream pressures: as for the pit depth–pit diameter plot (Fig. 6), no clear correlation between these two parameters is noticeable. The associated strains are reported in Fig. 7 too. Instead, a strong correlation is found between the impact loads (calculated for each pit as the product of the impact pressure and the pit surface) and the volume of pits obtained from the pitting test analysis, as reported in Fig. 8. The volume of pits is found to follow a power law with impact loads, which does not depend significantly upon the operating conditions in the present range of investigation. Indeed, the exponent values for 10, 15, 20, and 40 bar upstream pressures obtained by a linear regression analysis on the four sets of data are 1.08, 1.06, 1.09, and 1.11, respectively. The correlation coefficient R 2 is higher than 0.99 in all cases. Therefore, the exponent is just slightly larger than one and the pit volume has a strong, almost linear correlation with impact load. This result is consistent with that of Carnelli et al.Reference Carnelli, Karimi and Franc38 on aluminum alloy samples.
Plot of the impact pressure–pit diameter correlation for the four tested upstream pressures. The corresponding impact strains are reported in the secondary vertical axis.

Pit volume–impact load trends for the four tested upstream pressures.

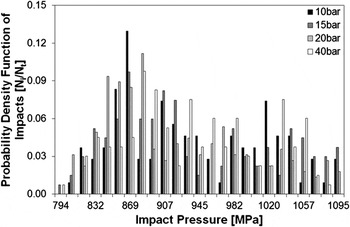
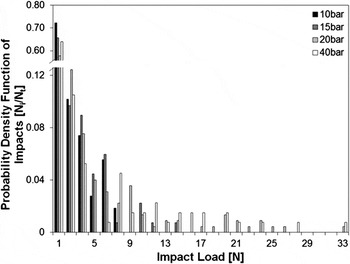
A histogram of the number of impacts versus impact pressure amplitude was drawn: the whole spectrum of pressures was divided in 25 pressure levels from the lowest (σ min = 781 MPa) to the highest (σ max = 1095 MPa) impact pressure recorded, and the number of impacts N i belonging to each interval with respect to their total number N t was considered (Fig. 9). This plot represents the probability density function of the pulses’ amplitudes. The same procedure explained above was used to calculate the histogram of the number of impacts versus impact load (Fig. 10) by dividing the whole spectrum of impact loads depicted in Fig. 8 in 25 load levels from L min = 0.01 N to L max = 32.7 N.
Histogram of the number of impacts versus impact pressure amplitude for the four tested upstream pressures. N i represents the number of impacts belonging to a certain pressure interval and N t is the total number of impacts detected at the different upstream pressures.

Histogram of the number of impacts versus impact load for the four tested upstream pressures. N i and N t are defined in Fig. 9.

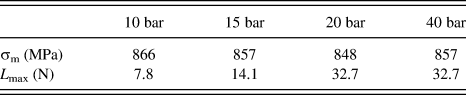
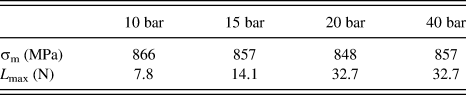
The mean values σ m of the impact pressure for the four tested upstream pressures [see Eq. (12)], reported in Table II, range between 848 and 866 MPa, with poor correlation between σ m and the upstream pressures. The maximum loads L max at the four investigated upstream pressures are also reported in Table II. As L max range between 7.8 (at 10 bar upstream pressure) and 32.7 N (at 20 and 40 bar upstream pressures), a better correlation with the upstream pressures has been found in this case.
Mean value of the impact pressure (σ m) determined from the weighted average over the pit volumes [Eq. (12)] and maximum loads (L max) obtained at the four tested upstream pressures.
V. DISCUSSION AND CONCLUSION
This article focuses on the use of depth-sensing indentation to calibrate the impact pressure due to bubble collapses obtained by pitting tests. The coupling of these two experimental techniques, together with the development of advanced analytical procedures to analyze the data, enabled the evaluation of the hydrodynamic aggressiveness of the cavitating flow, here represented by the spectra of impact pressure and loads responsible for material erosion. In particular, depth-sensing nanoindentation measurements were used to extract the mechanical properties of the NAB alloy exposed to cavitation erosion. This is a novelty in the field of cavitation erosion study where the sample material is usually characterized by means of conventional mechanical tests, whereas the actual solicitation in cavitation erosion, characterized by a complex multiaxial stress fields, is remarkably different from uniaxial tension or compression and rather similar to the indentation testing.
FrancisReference Francis33 classified indentation states into the following three regions: (i) elastic region with recoverable deformation, (ii) transition region with elastic–plastic deformation, and (iii) fully plastic region with dominant plastic deformation. By investigating the experimental results, Francis suggested to link the constraint factor ψ to a normalized variable Φ:

where E is the Young’s modulus of the material, by the relationships:

In this work, the function λ [Eq. (6)] plays the role of the variable Φ. The definition of constraint factor ψ provided in Eq. (7) is more convenient to be used than Eqs. (13) and (14) due to its explicit formulation and its direct link with the experimentally measured parameters h t and h c.
As already stated, the correlation between the constraint factor and the h t/h c ratio reported in Eq. (6) is due to Juliano et al.,Reference Juliano, VanLandingham, Weerasooriya and Moy29 which used this formulation to express the constraint factor ψ through the whole three loading regimes (i.e., λ = ψ). Actually, since the h t/h c ratio is expected to be equal to 2 if the contact is purely elastic and equal to 1 if the contact is purely plastic, in principle ψ will be equal to 1.11 in the elastic case but it is expected to increase dramatically if a purely plastic condition arises,Reference Juliano, VanLandingham, Weerasooriya and Moy29 unlike tending to 2.87, as in the work of Francis.Reference Francis33 For this reason, in the present work the formulation of the constraint factor ψ has been modified with respect to Juliano et al. and Eq. (6) was used to describe the behavior of ψ only in the elastic–plastic transition regime as evidenced by Eq. (7), whereas in the elastic and fully plastic regions, the boundary values suggested by Francis were adopted.
The comparison between the ultimate strength of the NAB alloy stress–strain curve and the values of the pressure of cavitation impacts obtained in this work can provide significant information on the cavitation intensity and on the inverse procedure adopted here. The ultimate strength σ U= 1010 MPa results to be lower than the higher stress recorded with the adopted procedure (σ max = 1095 MPa). Further, the amount of impacts associated to stresses higher than σ U is quantifiable as ∼18% of the total impacts. Thus the work-hardening process occurring with the superimposition of several impacts with magnitude lower than the ultimate strength is expected to be joined by impacts with magnitude higher than σ U. This finding is also consistent with previous results reported by Carnelli et al.Reference Carnelli, Karimi and Franc38
The impact load histograms at the four different operating pressures (Fig. 10), and in particular the maximum loads L max obtained at the four tested upstream pressures (Table II), can give some other information about the operating conditions. The occurrence of intense events, which corresponds to large values of the pit volume and high impact loads associated to them, is more likely to occur when the upstream pressure (i.e., the flow velocity) is high (Figs. 8 and 10); whereas, weak impacts occur at all the upstream pressure levels and therefore the loads related to these impacts are basically superimposed in the different operating conditions. Instead, no clear correlation between the impact pressure values and the operating upstream pressures is noticeable in Fig. 7; further, no clear information can be extracted from the pressure amplitude histograms at the four different operating pressures (Fig. 9) or from the mean values σ m of the impact pressure (Table II). Therefore, in general impact loads seem to be a better indicator than impact pressure in the evaluation of the aggressiveness of the cavitating flows.
In this work, nanoindentation has been adopted for two different purposes: first, to extract stress–strain curves for the NAB alloy (see “Extraction of stress–strain curves from nanoindentation tests”); second, to evaluate the pressure of cavitation impacts (see “Evaluation of the pressure of cavitation impacts and its statistical distribution”). Concerning the first point, i.e., the extraction of stress–strain curves for the NAB alloy, as the collapse of the gas bubbles on the surface exerts in the metal a stress field mainly dominated by compression, conventional mechanical testing, such as tensile tests, are clearly inadequate to represent the material response to cavitation. This is even more true in case of materials with different mechanical behavior between tension and compression (as the NAB alloy adopted in this work, for which the compressive yield stress is almost three times higher than the tensile stressReference Twarog39), for which tensile tests could led to wrong interpretations of the pressure of cavitation impacts, and for nonbulk materials, such as coatings, for which conventional mechanical testing are not possible: in these two cases, instead, nanoindentation can still be used under basically the same framework presented in “Extraction of stress–strain curves from nanoindentation tests”. Concerning the second aspect, i.e., the evaluation of the pressure of cavitation impacts, the use of the similarity between nanoindentation and cavitation allows to adapt some well-established relations usually adopted for the nanoindentation data analysis to the analysis of cavitation pits: in this respect, the use of nanoindentation theories is essential and allows a successful estimation of the pressure of cavitation impacts based on the coupling between pitting tests and nanoindentation.
We have already underlined the similarities between substrate deformation under liquid impact and under indentation testing. On the other hand, some differences between indentation and cavitation erosion exist, too. The indenter tip, which is made of diamond, is much more rigid than a water microjet; further, cavitation erosion is known to be characterized by a higher strain rate, quantifiable in the order of 102–103 s−1, whereas in this work the material properties were extracted from quasistatic indentation tests performed at a controlled strain rate of 0.05 s−1. In this light, it would be necessary to evaluate the strain rate effect and correlate the pitting test results with material properties at high strain rate, which would be more representative of the actual loading conditions during the cavitation erosion process. Although indentation tests at strain rates of 102–103 s−1 are not feasible, indentation tests at maximum stain rates in the order of 1 s−1 and spanning three orders of magnitude have been already performed.Reference Yang and Nieh40–Reference Nieh, Schuh, Wadsworth and Li42 Therefore, a possible strain rate effect of the NAB alloys could be partially taken into account by directly increasing the strain rate of the instrumented indentation tests. Another development of the presented technique would consider the descending branch of the stress–strain curve in the calculation of the pressure due to cavitation impact: in this light, a modification of the stress–strain law in Eq. (8) would be required.
A further limitation of the work consists in the assumption that a cavitation pit could be completely characterized by its depth and diameter and in the hypothesized spherical cap geometry for modeling the cavitation pit, introduced to evaluate the pressure of cavitation impacts by means of the analogy between cavitation and indentation. It should be noticed that the spherically shaped cap assumption is not volume conserving as a discrepancy of about 20–25% is evidenced by comparing the pit volume obtained from pitting tests and the one calculated by adopting the spherical cap geometry assumption. Nevertheless, all the geometrical parameters adopted in the extraction of the pressure of cavitation impacts are the pit depth, h, and pit diameter, d, which are directly measured by the contact profilometer.
In this work, the estimation of the pressure of cavitation impacts and its statistical distribution was successfully assessed owing to the coupling between pitting test experiments and analyses and the material mechanical behavior obtained by nanoindentation measurements. The proposed approach strongly supports the link between information regarding the flow geometry, the operating hydrodynamic conditions, and the mechanical properties of the material subjected to cavitation erosion to acquire a deeper knowledge of the cavitation erosion mechanisms. In the authors’ opinion, this novel procedure represents an important step in the determination of the cavitation intensity from pitting tests.
ACKNOWLEDGMENTS
The authors thank Dr. Ki-Han Kim from the Office of Naval Research and Dr. Richard Vogelsong from the Office of Naval Research Global for supporting this work. They are also very grateful to Dr. Georges L. Chahine (Dynaflow, Inc.), Dr. Farrel Martin (Naval Research Laboratory), and Dr. Martin Donnelly (Naval Surface Warfare Center Carderock Division) for fruitful discussions; to Michel Riondet for his contribution in the pitting tests; and to Akshath Shetty for SEM observation of indentations.