Introduction
Ongoing climate change will lead to increased sea ice melting and ice-free summer in the Arctic Ocean within the next few decades (e.g. Stroeve et al. Reference Stroeve, Holland, Meier, Scambos and Serreze2007). As the ice melt season becomes longer, the large quantities of ice melt freshwater supplied to the ocean surface will influence the heat budget, water temperature, ice cover, and water stratification by reducing vertical mixing in the water column (e.g. Steele et al. Reference Steele, Zhang and Ermold2010). In addition to changing the physical structure of the atmosphere-ocean system, these effects also influence biogeochemical processes and ecosystems through changes in vertical and horizontal transport of chemical substances and biological components, and in food web structure, thereby altering the processes affecting gas flux between the ocean and atmosphere (e.g. Arrigo et al. Reference Arrigo, Robinson, Worthen, Dunbar, Ditullio, Vanwoert and Lizotte1999, Reference Arrigo, van Dijken and Pabi2008, Bates & Mathis Reference Bates and Mathis2009). Arrigo et al. (Reference Arrigo, Robinson, Worthen, Dunbar, Ditullio, Vanwoert and Lizotte1999) found that the phytoplankton community structure in the Ross Sea is related to the water stratification. Water stratification could favour the growth of diatoms, which would reduce nutrient utilization efficiency and rates of the production in nutrient limited waters. Therefore, they indicated that the capacity of the biological community to draw down the atmospheric CO2 and transport it to the deep ocean could decrease with the increase of the water stratification (Arrigo et al. Reference Arrigo, Robinson, Worthen, Dunbar, Ditullio, Vanwoert and Lizotte1999).
There are clear relationships in spring and summer between the physical regime and biological productivity at the ice-edge at the seasonal timescale (Smith & Nelson Reference Smith and Nelson1985, Niebauer et al. Reference Niebauer, Alexander and Henrichs1990, Pérez et al. Reference Pérez, Figueiras and Ríos1994, Jin et al. Reference Jin, Deal, Wang, Alexander, Gradinger, Saitoh, Iida, Wan and Stabeno2007). These studies showed that water stratification due to the supply of freshwater to the surface advances the ice-edge bloom that is seeded from ice algae in the meltwater supply. The nutrients in the surface water are eventually depleted through consumption by phytoplankton. Similar depletions are also found in the ice-gap layers of sea ice (Kattner et al. Reference Kattner, Thomas, Haas, Kennedy and Dieckmann2004, Papadimitriou et al. Reference Papadimitriou, Thomas, Kennedy, Kuosa and Dieckmann2009), surface ponds (Kennedy et al. Reference Kennedy, Thomas, Kattner, Haas and Dieckmann2002), crack pools between the sea ice (Gleitz et al. Reference Gleitz, Grossmann, Scharek and Smetacek1996), and under-ice water (e.g. McMinn et al. Reference McMinn, Bleakley, Roberts and Trenerry2000).
In this study, we conducted an artificial pool experiment in the Antarctic multi-year land-fast ice to examine and simulate the effect of sea ice melting on physical and biogeochemical components in the sea ice field. Our results provide a detailed description of the mechanisms and relationships between water stratification, biological productivity, and related biogeochemical components in the open water within the sea ice.
Materials and methods
Experimental setting
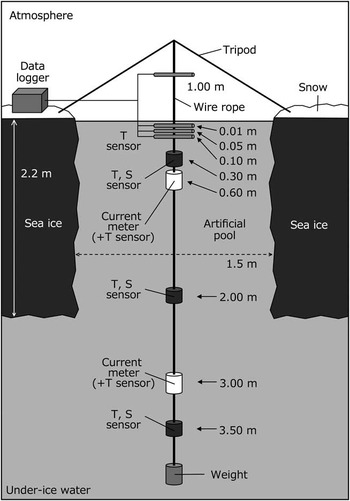
We constructed an artificial pool in the multi-year land-fast ice in Lützow-Holm Bay, East Antarctica (68°59′54″S, 39°37′03″E) from 22–24 December 2009 (Fig. 1). First, snow on the sea ice was removed with a snow shovel, and holes were drilled along the outline of the pool (1.5 m x 1.5 m) with a Jiffy ice drill (Model 30, Feldmann Engineering & Manufacturing Co. Inc, WI, USA). The sea ice was then crushed with a long chisel and removed with ice tongs and a net. The sea ice was 2.2 m thick. The depth of the snow on the ice surrounding the pool decreased from 0.4–0.1 m during the study period.
Schematic illustration of the artificial pool used in this study showing the placement of temperature (T) and salinity (S) sensors and current meters.

Three types of sensors were attached to a line supported by a tripod and passing through the water column at the centre of the pool. The sensors were used for long-term measurements of temperature, salinity and current speed (24 December 2009–17 January 2010). The temperatures at 1.0 m above the pool water surface and at water depths of 0.01, 0.05, and 0.10 m were measured by thermistor probe (TR-5106, T&D Corp, Nagano, Japan), and temperature data were stored in a data logger (RTR-52A, T&D Corp). The temperature and salinity at water depths of 0.3, 2.0 and 3.5 m were measured by memory-type conductivity-temperature (CT) sensor (Compact CT, JFE Advantech Co. Ltd, Hyogo, Japan). During 8–9 January 2010, the thermistor probe and the CT sensor were removed for a battery change and data download and then reinstalled. Current speeds at water depths of 0.6 and 3.0 m were measured by memory-type current meter (Compact EM, JFE Advantech Co. Ltd), which also had a temperature sensor. During 1–9 January 2010 the current meter could not record data because of a program error related to the transition from 2009 to 2010.
Pool water sampling
Samples of the pool water were collected at depths of 0.01, 0.05, 0.3, 1.5 and 3.5 m on 24 and 26 December 2009 and on 3, 5, 11, and 15 January 2010 by using a Teflon tube and a diaphragm pump (EWP-01, As One Corporation, Osaka, Japan). Water was collected into a 12 ml glass screw-cap vial (Nichiden-Rika Glass Co. Ltd, Kobe, Japan) for measurement of salinity, a 120 ml amber glass vial (Maruemu Co. Ltd, Osaka, Japan) for measurement of dissolved inorganic carbon (DIC) concentration, a 10 ml polyethylene screw-cap vial (Eiken Chemical Co. Ltd, Tokyo, Japan) for measurement of inorganic nutrient concentrations, and into a 500 ml Nalgene polycarbonate bottle (Thermo Fisher Scientific Inc, Waltham MA, USA) for measurement of chlorophyll a (chl a) concentration. To stop biological activity 200 μl of a saturated mercuric chloride solution was added to the DIC samples. Samples for measurement of salinity and DIC were stored in a refrigerator (+4°C), and those for measurement of nutrient concentrations in a freezer (-30°C) until further analysis. Samples for chl a measurement were filtered through 25 mm Whatman GF/F filters immediately after returning to the laboratory near the sampling station. Chlorophyll pigments on the filters were extracted in dimethylformamide (Suzuki & Ishimaru Reference Suzuki and Ishimaru1990) for 24 h at c. -80°C.
Sample analysis
Salinity was measured with a salinity analyser (SAT-210, Toa Electronics Ltd, Tokyo, Japan). The salinity analyser was calibrated with standard seawater from the International Association for the Physical Science of the Ocean (P series; Ocean Scientific International Ltd, Hampshire, UK). The standard deviation for salinities of 15 subsamples taken from a reference water sample (S = 10.00) was 0.03.
Dissolved inorganic carbon was determined by coulometry (Johnson et al. Reference Johnson, King and Sieburth1985). The DIC measurements were calibrated by using reference materials for seawater (Batch AG; KANSO Technos Co. Ltd, Osaka, Japan) traceable to the Certified Reference Material distributed by A.G. Dickson (Scripps Institution of Oceanography, La Jolla, CA, USA). The standard deviation for DICs of 20 subsamples from the reference material for seawater (DIC = 2035.4 μmol kg-1) was 1.4 μmol kg-1.
Nutrient concentrations were determined by using an auto-analyser system according to the Joint Global Ocean Flux Study (JGOFS) spectrophotometric method (Knap et al. Reference Knap, Michaels, Close, Ducklow and Dickson1996). Different systems were used for nitrate (NO3-) (AACS III, Bran+Luebbe, Tokyo, Japan) and silicic acid (Si(OH)4) (Quaatro-Marine 5ch, SEAL Analytical Ltd, Hampshire, UK). The analysers were calibrated with standard reference materials for nutrient analysis (Lots AW and BG; KANSO Technos Co. Ltd). The standard deviation for nutrient concentrations in 20 subsamples from a reference seawater sample (10.0 μmol kg-1 NO3-, 120.1 μmol kg-1 Si(OH)4) was 0.3 μmol kg-1 for NO3- and 1.1 μmol kg-1 for Si(OH)4.
Chlorophyll a concentrations were determined using a fluorometer (Model 10AU, Turner Designs Inc, Sunnyvale CA, USA) following methods described by Parsons et al. (Reference Parsons, Takahashi and Hargrave1984). The fluorometer was calibrated before measurements by using calibration standards (0.28–282.3 μg l-1 chl a) made by stepwise dilution of a liquid chl a standard (Wako Pure Chemical Industries Ltd, Osaka, Japan) with N,N-dimethylformamide.
Results
Temperatures of air and pool water
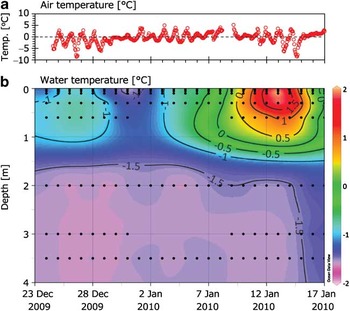
Mean air temperatures throughout the study period were close to 0°C although there were daily variations (mean ± SD, -0.3 ± 2.2°C) (Fig. 2a). Water temperatures in the upper part of the pool (shallower than about 1.2 m) were below zero (-1.0 ± 0.6°C) from the start of the study until 8 January 2010, and then increased to positive values (+0.9 ± 1.3°C) throughout the rest of the study period (Fig. 2b). Water temperatures towards the bottom part of the pool (deeper than about 1.2 m) were below zero (-1.6 ± 0.1°C) throughout the study period (Fig. 2b).
Temperature time series data. a. Air temperature, and b. depth profiles of pool water temperature obtained by moored sensors. Colour scale and contour lines indicate the temperature in °C. The contour plot was created using Ocean Data View software version 3.4.3.

Salinity and current speed
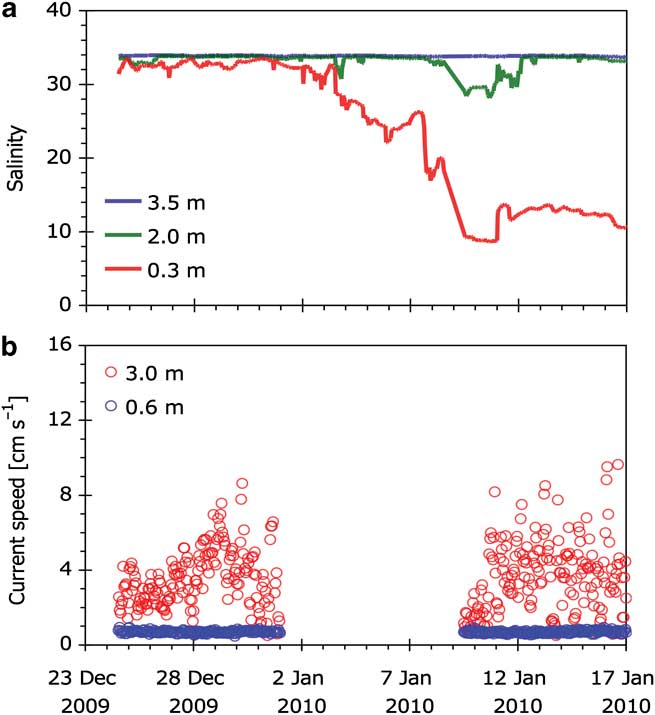
Salinity of the pool water at 0.3 m depth decreased drastically from a range of 30.8–33.6 on 24–31 December 2009 to 8.6–13.7 on 10–17 January 2010 (Fig. 3a). In contrast, salinity of the pool water at depths of 2.0 and 3.5 m was almost constant at 33.7 ± 0.3, except for 3 January and 8–12 January 2010. The salinity at 2.0 m decreased to 30.7 on 3 January and to 28.5 on 10 January 2010.
Time-series data recorded by moored sensors. a. Salinity, and b. current speed.
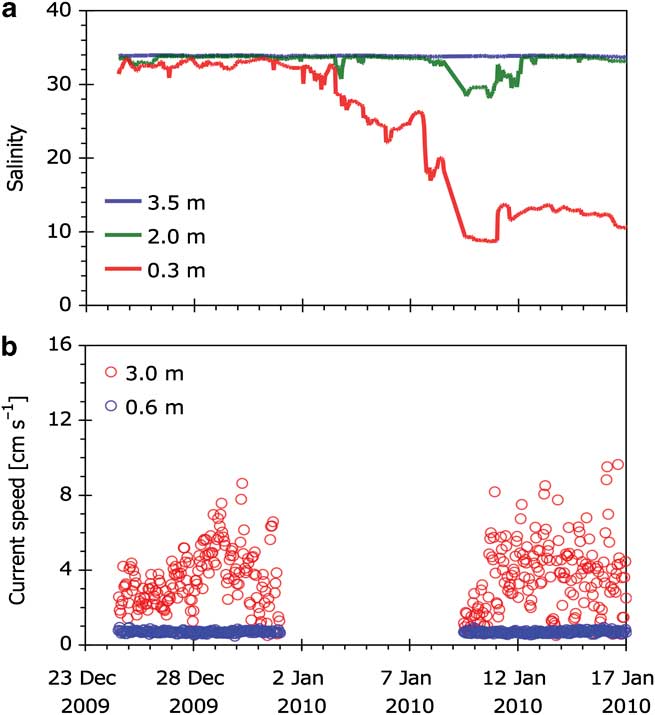
Current speed at 0.6 m depth was almost constant at 0.7 ± 0.1 cm s-1 during the study period (Fig. 3b). In contrast, the current speed at 3.0 m varied from 0.5–9.6 cm s-1 during the study period with a mean of 3.6 cm s-1.
Salinity, DIC, nutrients and chl a
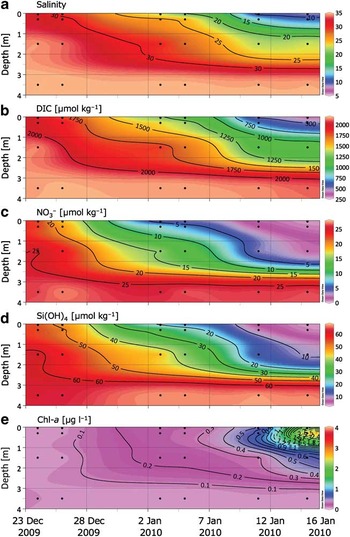
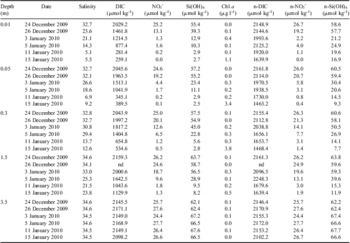
The results from analyses of bottle samples were used to create time series depth profiles of salinity, DIC, NO3-, Si(OH)4 and chl a concentrations (Fig. 4). Detailed values for each parameter are presented in Table I. Pool water salinity was almost constant vertically on 24 and 26 December 2009 (32.4 ± 3.3). By 15 January 2010 the salinity at the top of the pool (0.01 m) had decreased drastically to 5.5. Throughout the study period, the salinity at 3.5 m remained constant (34.6 ± 0.0) (Fig. 4a, Table I). The salinity variations detected in bottle samples were consistent with those recorded by the moored sensors (Fig. 3a).
Time-series of pool water biogeochemical components. a. Salinity, b. dissolved inorganic carbon (DIC), c. NO3-, d. Si(OH)4, and e. chl a. The contour plots were created using Ocean Data View software version 3.4.3.

Summary of all pool water data for each depth. The prefix “n-” indicates data normalised to a salinity of 34.6. n-DIC = normalized dissolved inorganic carbon, nd = no data.

Variations in DIC, NO3- and Si(OH)4 concentrations were similar to those of salinity, with drastic decreases in pool surface water (0.01 m) from > 2000 μmol kg-1 to 259.1 μmol kg-1 for DIC, from > 25 μmol kg-1 to 0.0 μmol kg-1 for NO3-, and from > 55 μmol kg-1 to 2.7 μmol kg-1 for Si(OH)4 over the course of the study period (Fig. 4b–d, Table I). Concentrations at 3.5 m remained almost constant through the study period: 2147.0 ± 26.3 μmol kg-1 for DIC, 26.4 ± 1.2 μmol kg−1 for NO3-, and 65.4 ± 2.4 μmol kg-1 for Si(OH)4.
The chl a concentrations were extremely low at all depths on 24 and 26 December 2009 (0.1 ± 0.0 μg l-1). Chlorophyll a concentrations then increased drastically to 3.4 μg l-1 at 0.05 m depth and to 3.8 μg l-1 at 0.3 m depth on 15 January 2010 (Fig. 4e, Table I). These trends in chl a concentrations are opposite to those of salinity, DIC, NO3- and Si(OH)4 (Fig. 4). The colour of the pool water visibly changed from clear to green between the samplings on 5 and 11 January 2010.
Salinity-normalized DIC and nutrients
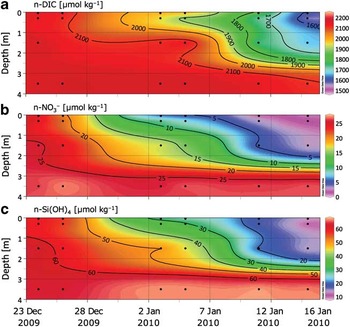
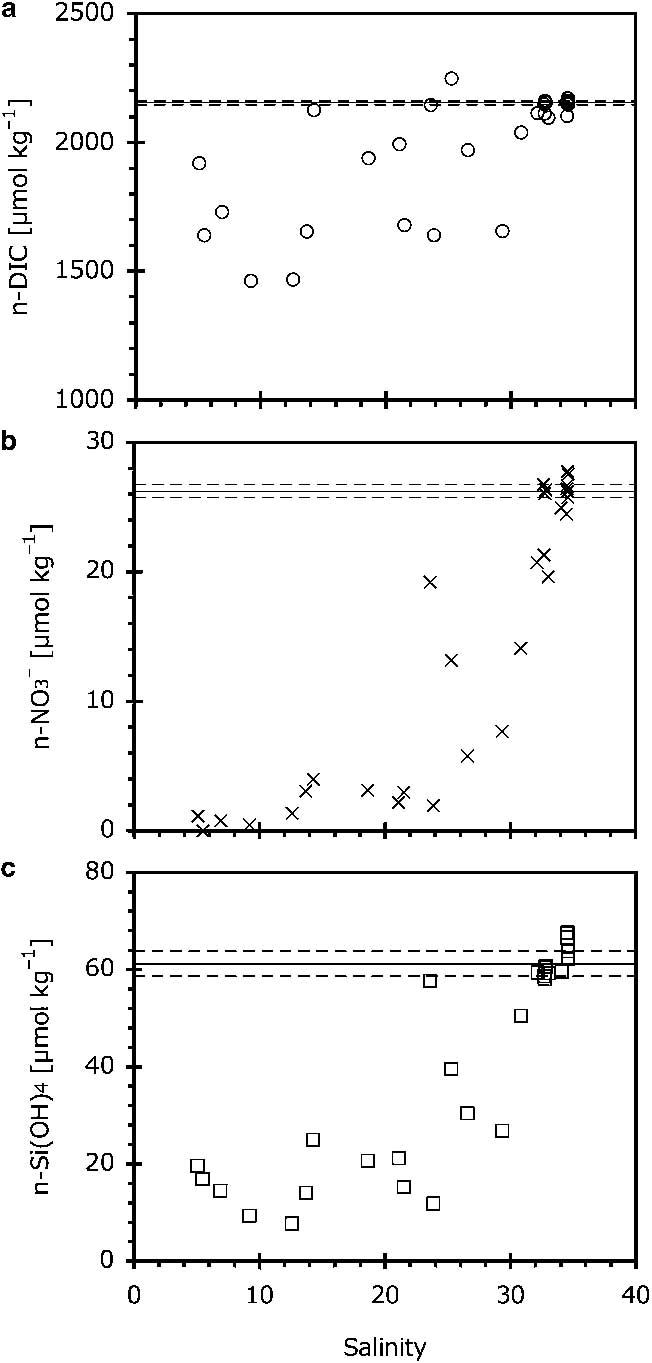
To assess effects of dilution or concentration processes on the biogeochemical components of the pool water, we normalized each component to a salinity of 34.6, which was the mean salinity of the pool water at a depth of 3.5 m during the sampling period (Table I). The trends in concentrations of normalized DIC (n-DIC) and nutrients (n-NO3- and n-Si(OH)4) (Fig. 5) were similar to those of DIC, NO3- and Si(OH)4 (Fig. 4), which decreased drastically in the pool surface water (shallower than 1.5 m): nDIC decreased from > 2100 μmol kg-1 to <1500 μmol kg-1, n-NO3- decreased from > 20 μmol kg-1 to almost zero and n-Si(OH)4 decreased from > 60 μmol kg-1 to < 10 μmol kg-1 over the study period (Fig. 5, Table I). Throughout the study period, concentrations of n-DIC, n-NO3- and n-Si(OH)4 were almost constant at 3.5 m depth (Fig. 5, Table I).
Time-series of pool water biogeochemical components normalized (“n-” prefix) to a salinity of 34.6. a. Normalized dissolved inorganic carbon (n-DIC), b. n-NO3-, and c. n-Si(OH)4. The contour plots were created using Ocean Data View software version 3.4.3.

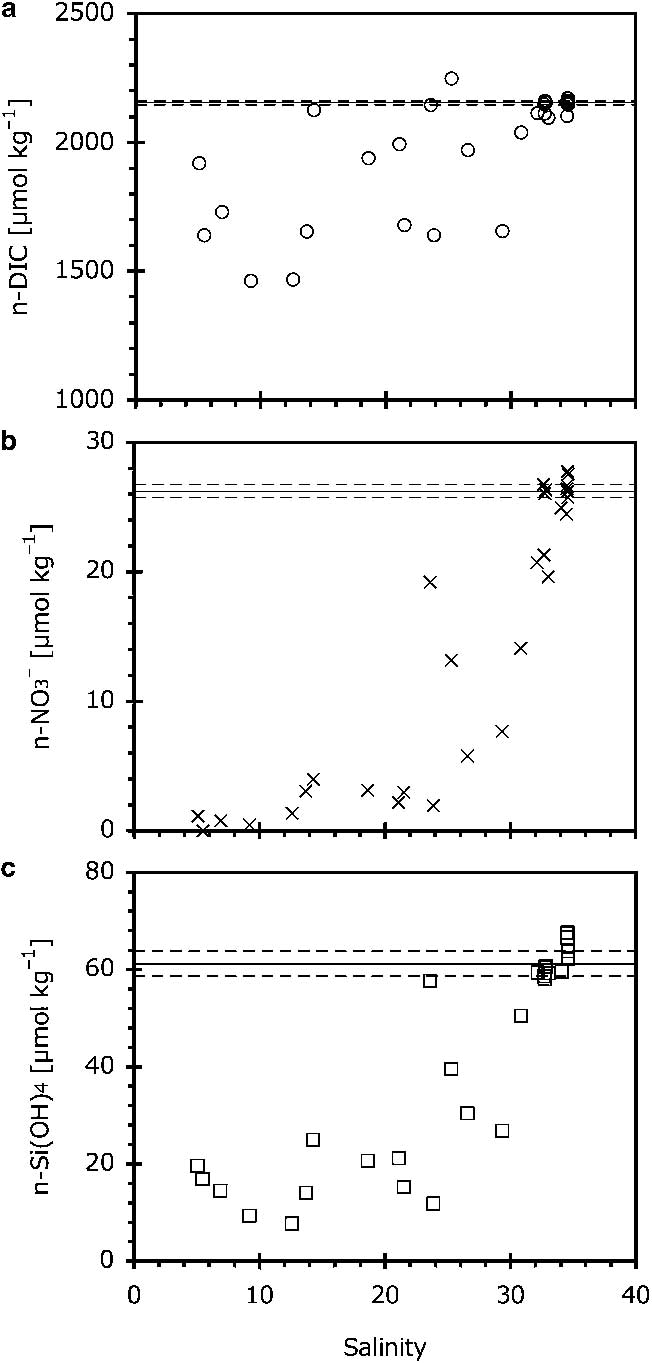
We determined the relationships between the concentration of each component and the pool water salinity (Fig. 6). Generally, n-DIC, n-NO3- and n-Si(OH)4 concentrations were lower than the mean value of the pool water at the depth of 3.5 m, particularly at lower salinities (Fig. 6). Lowest n-DIC, n-NO3- and n-Si(OH)4 concentrations correspond to decreases from the mean pool water values at 3.5 m of 686.8 μmol kg-1 for n-DIC, 26.4 μmol kg-1 for n-NO3-, and 57.8 μmol kg-1 for n-Si(OH)4, or 31.9%, 100.0% and 88.2%, respectively.
Relationships between salinity-normalized dissolved inorganic carbon (n-DIC) and nutrients in pool water and salinity. a. n-DIC vs salinity, b. n-NO3- vs salinity, and c. n-Si(OH)4 vs salinity. The “n-” indicates normalization to a salinity of 34.6. Solid and dashed lines indicate the mean and range, respectively, during the study period of the values in the pool at 3.5 m depth.
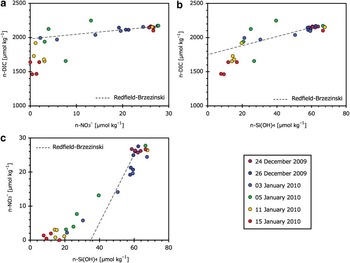
We also compared the relationships between each pair of components in the pool water (Fig. 7). There were high degrees of correlation for each relationship: n-NO3- vs n-DIC, r 2 = 0.63, P < 0.001; n-Si(OH)4 vs n-DIC, r 2 = 0.73, P < 0.001; and n-Si(OH)4 vs n-NO3-, r 2 = 0.95, P < 0.001. However, for n-NO3- vs n-DIC and n-Si(OH)4 vs n-DIC, the data plotted for the final stage of the study period (11 and 15 January 2010) deviated widely from the line of Redfield-Brzezinski nutrient ratio for marine phytoplankton (C:N:Si:P = 105:16:15:1; Brzezinski Reference Brzezinski1985) at the low n-NO3- and n-Si(OH)4 (Fig. 7a & b). For n-Si(OH)4 vs n-NO3, most of the data plotted deviated from the line of Redfield-Brzezinski ratio (Fig. 7c).
Relationships between salinity-normalized biogeochemical components in pool water. a. Normalized dissolved inorganic carbon (n-DIC) vs n-NO3-, b. n-DIC vs n-Si(OH)4, and c. n-NO3- vs n-Si(OH)4. The “n-” indicates normalization to a salinity of 34.6. The dashed lines indicate the Redfield-Brzezinski nutrient ratio.

Discussion and conclusions
The abrupt increase of temperature and decrease of salinity observed during the study period, particularly in the upper part of the pool (Figs 2b, 3a & 4a) are attributed to the input of meltwater from the snow around the pool and the melting of sea ice because of the input of solar radiation to the pool water. During the study period, the depth of snow surrounding the pool decreased drastically, suggesting that the snow meltwater was supplied to the pool mainly from the bottom of the snow layer.
The influx of higher temperature and lower salinity water induced stratification, with the less dense water in the surface layer of the pool (Figs 2b, 3a & 4a). The water stratification was enhanced by the greatly reduced current speeds at the surface of the pool. The current speed at the top of the pool (mean 0.7 cm s-1 at 0.6 m depth) was much lower than that in the under-ice water below the pool (mean 3.6 cm s-1 at 3.0 m depth) (Fig. 3b). Shirasawa & Leppäranta (Reference Shirasawa and Leppäranta2003) measured similar current speeds (2–3 cm s-1) under the ice in a semi-enclosed lagoon in the southern part of the Okhotsk Sea. They indicated that the ice cover reduced the wind driven mixing at the water surface. Although the air temperature occasionally fell below -5°C during the second half of the study period (Fig. 2a), the surface layer of the pool remained at temperatures that were relatively warmer (Fig. 2b). These results suggest that no vertical mixing was induced in the pool through cooling of the pool surface water.
Concentrations of the biogeochemical components (DIC, NO3- and Si(OH)4) decreased drastically in the top layer of the pool, tracking the variation of the salinity (Fig. 4, Table I). At first glance, these results suggest that these biogeochemical components were diluted by the freshwater supply from the outside of the pool. However, even after these components were normalized to salinity, we observed decreases in n-DIC, n-NO3- and n-Si(OH)4 with salinity and time in the surface layer of the pool (Figs 5 & 6). In contrast to the variations of biogeochemical components, chl a concentrations increased in the surface layer with time (Fig. 4e). These results clearly suggest that the DIC and nutrients were consumed during photosynthesis by the phytoplankton at the surface of the pool.
A drastic increase in the maximum chl a concentration was observed at the end of the experiment (15 January 2010, Fig. 4e), indicating that it took about three weeks for a phytoplankton bloom to occur in the pool even though the pool water was exposed to sunlight immediately after the onset of the experiment (24 December 2009). These results suggest that the timing of the phytoplankton bloom in the pool was affected by the degree of water column stratification in the pool. This is a situation similar to those at the ice-edge during the ice melting season. Ice-edge blooms are closely related to the water stratification, and the blooms are seeded from ice algae, which are released from sea ice with ice meltwater (Smith & Nelson Reference Smith and Nelson1985, Niebauer et al. Reference Niebauer, Alexander and Henrichs1990, Pérez et al. Reference Pérez, Figueiras and Ríos1994, Jin et al. Reference Jin, Deal, Wang, Alexander, Gradinger, Saitoh, Iida, Wan and Stabeno2007).
Despite the favourable conditions provided for phytoplankton blooms by the water stratification, the stratification eventually resulted in nutrient depletion, particularly of NO3-, in the upper layer of the pool where salinity was low (Fig. 6b, Table I). The supply of nutrients from under the pool declined because of the water stratification in the pool, and the bloom presumably would have ended after our experiment. Therefore, it appears that phytoplankton succession in surface waters of semi-enclosed marine systems is strongly affected by the balance between the water stratification and nutrient supply from the under-ice water. Nutrient depletion has been observed at the ice-edge (e.g. Niebauer et al. Reference Niebauer, Alexander and Henrichs1990) and in the relatively closed sea ice systems in the ice-gap layer at the top of sea ice (e.g. Kattner et al. Reference Kattner, Thomas, Haas, Kennedy and Dieckmann2004, Papadimitriou et al. Reference Papadimitriou, Thomas, Kennedy, Kuosa and Dieckmann2009), surface ponds (Kennedy et al. Reference Kennedy, Thomas, Kattner, Haas and Dieckmann2002) and crack pools between the sea ice (Gleitz et al. Reference Gleitz, Grossmann, Scharek and Smetacek1996).
Relationships between n-DIC and n-NO3- (Fig. 7a) and n-Si(OH)4 (Fig. 7b) in this study indicated that the data plotted for the final stage of the study period (11 and 15 January 2010) were below the line of Redfield-Brzezinski ratio at the low n-NO3- and n-Si(OH)4 (Fig. 7a & b). This suggests that the DIC consumption relative to NO3- and Si(OH)4 was higher than that expected for general phytoplankton growth. In previous studies, over-consumption of carbon was found in blooms in a mesocosm (Engel et al. Reference Engel, Goldthwait, Passow and Alldredge2002), stratified waters (Arrigo et al. Reference Arrigo, Robinson, Worthen, Dunbar, Ditullio, Vanwoert and Lizotte1999) and under various sea ice conditions (Gleitz et al. Reference Gleitz, Grossmann, Scharek and Smetacek1996, Günther et al. Reference Günther, Gleitz and Dieckmann1999, Papadimitriou et al. Reference Papadimitriou, Thomas, Kennedy, Kuosa and Dieckmann2009). These carbon over-consumptions were attributed to the production of the carbohydrates and lipids (Fahl & Kattner Reference Fahl and Kattner1993, Gleitz et al. Reference Gleitz, Grossmann, Scharek and Smetacek1996, Schartau et al. Reference Schartau, Engel, Schröter, Thoms, Völker and Wolf-Gladrow2007, Papadimitriou et al. Reference Papadimitriou, Thomas, Kennedy, Kuosa and Dieckmann2009) and to the substantial utilization by phytoplankton of ammonium and urea in addition to nitrate (e.g. Papadimitriou et al. Reference Papadimitriou, Thomas, Kennedy, Kuosa and Dieckmann2009). In this study, there were no data collected that would explain the main reasons for the over-consumption of carbon.
There are other factors that might help explain the deviations from the Redfield-Brzezinski ratio observed in this study (Fig. 7a & b). One factor is the non-conservative nature of DIC in the pool water during the study period. Gas exchange between pool water and the atmosphere would change the DIC concentration in the pool water. The blooming of phytoplankton during the study period (Fig. 4e) suggests that the partial pressure of CO2 (pCO2) in the pool water became lower than that of the atmosphere. Therefore, atmospheric CO2 would have been absorbed by the pool water, increasing the DIC concentration. In addition, calcium carbonate (CaCO3) precipitation or dissolution would change the DIC concentration in the pool water. In the low temperature, high salinity conditions of sea ice, CaCO3 crystals in the form of ikaite (CaCO3·6H2O) have been found in the Arctic and Antarctic (Dieckmann et al. Reference Dieckmann, Nehrke, Papadimitriou, Göttlicher, Steininger, Kennedy, Wolf-Gladrow and Thomas2008, Reference Dieckmann, Nehrke, Uhlig, Göttlicher, Gerland, Granskog and Thomas2010). The formation of this CaCO3 releases CO2 into the sea ice, whereas the dissolution of this CaCO3 consumes CO2 and decreases the pCO2 in water (e.g. Papadimitriou et al. Reference Papadimitriou, Kennedy, Kattner, Dieckmann and Thomas2004). This latter process usually occurs during the ice melting season. Therefore, in this study, gas exchange and CaCO3 dissolution would have tended to increase the DIC concentration in the pool water. Although these processes could potentially alter the C:N:Si ratios away from the Redfield-Brzezinski ratio (Fig. 7a & b), processes other than gas exchange and carbonate dissolution were responsible for carbon over-consumption in this study.
It is said that the phytoplankton community structure in the Ross Sea is related to the water stratification (Arrigo et al. Reference Arrigo, Robinson, Worthen, Dunbar, Ditullio, Vanwoert and Lizotte1999). Water stratification could favour the growth of diatoms, which would cause the over-consumption of carbon. In addition, the reduction of nutrient utilization efficiency and rates of the production occurred in the diatoms dominated waters (Arrigo et al. Reference Arrigo, Robinson, Worthen, Dunbar, Ditullio, Vanwoert and Lizotte1999). Therefore, they indicated that the capacity of the biological community to draw down the atmospheric CO2 and transport it to the deep ocean could decrease with the increase of the water stratification (Arrigo et al. Reference Arrigo, Robinson, Worthen, Dunbar, Ditullio, Vanwoert and Lizotte1999).
In order to estimate the rate of production by the phytoplankton in the pool, changes in depth-integrated n-DIC were evaluated during the study period. The depth-integrated n-DIC decreased with time, and the result indicated that the production rate was 0.84 g C m-2 day-1. Same order of the production rate (0.93 g C m-2 day-1) was observed in the Ross Sea when the phytoplankton community was dominated by diatoms (Arrigo et al. Reference Arrigo, Robinson, Worthen, Dunbar, Ditullio, Vanwoert and Lizotte1999). This result and the over-consumption of carbon found in this study suggest that diatoms were dominated within the stratified pool water.
Most of the data plotted deviated from the line of Redfield-Brzezinski ratio for n-Si(OH)4 vs n-NO3 (Fig. 7c), but n-Si(OH)4 and n-NO3 were highly correlated (r 2 = 0.95, P < 0.001). The slope of the regression line for the relationship between n-NO3- and n-Si(OH)4 was 0.5. This value was smaller than the Redfield-Brzezinski ratio (N:Si = 1.1). It is said that the N:Si ratio varies considerably, particularly in polar environments (Jennings et al. Reference Jennings, Gordon and Nelson1984, Arrigo & Sullivan Reference Arrigo and Sullivan1994). Values of 0.4 have been reported for the Southern Ocean (Jennings et al. Reference Jennings, Gordon and Nelson1984) and for sea ice algae growing in McMurdo Sound, Antarctica, where a value of 0.4 was used for modelling microalgal growth (Arrigo & Sullivan Reference Arrigo and Sullivan1994). These values are in good agreement with the slope of 0.5 obtained in this study. However, the active uptake of Si by diatoms in sea ice environments is governed by the many factors that control growth, including temperature, light conditions and the nutrient composition of the environment (e.g. Thomas & Papadimitriou Reference Thomas and Papadimitriou2003).
Based on an artificial pool experiment in the Antarctic multi-year land-fast ice, we could examine and simulate the effect of sea ice melting on physical and biogeochemical components. Our results provide a detailed description of the mechanisms and relationships between water stratification, biological productivity, and related biogeochemical components in the open water within the sea ice and ice-edge regions in the polar seas.
Acknowledgements
We express heartfelt thanks to Dr S. Kudoh for his help in making the artificial pool. We thank Dr Y.W. Watanabe for providing the instrument for DIC analysis, and to Prof J. Kanda, Ms S. Yasui and Ms C. Oouchida for nutrient analyses. We also thank Dr P. Assmy, Dr S. Koga, Mr H. Shimoda, Ms S. Youkongkaew and all of the members of the 51st Japanese Antarctic Research Expedition (JARE-51) for their comment and support in the field. We also thank National Research University Project of CHE Fund (CC1043A). This paper was supported by funds from the National Institute of Polar Research for English proofreading. The constructive comments of the reviewers are also gratefully acknowledged.